"Quantifying the Unquantifiable" in Aerospace Electronics and Ergonomics Engineering: Review
Abstract
The today's efforts of aerospace system engineers, not to mention human psychologists, to assure adequate operational reliability of electronic-and-photonic (E&P) products and satisfactory success-and-safety of a mission or of an extraordinary situation, are, as a rule, based on more or less trustworthy statistics and on what is known as best practices. These efforts are typically unquantifiable, i.e. do not end up with numerical data that enable comparing different possible scenarios of the outcome of a planned undertaking. The objective of this review is to show, using examples from different and sometimes even unconnected areas of aerospace E&P and ergonomics engineering, how probabilistic predictive modeling (PPM) geared to a carefully designed, thoroughly conducted and adequately interpreted highly-focused and highly cost effective failure-oriented accelerated testing (FOAT) can be employed to quantify what is typically considered as "unquantifiable", i.e., to evaluate the lifetime and the corresponding probability of failure (PoF) of an aerospace E&P system, and/or the role of the human factor (HF), and to predict the outcome of a human-in-the-loop (HITL) related mission or an extraordinary situation, when equipment's reliability (both hard- and software) and human performance contribute jointly to the never-zero PoF of a mission or an extraordinary situation. The reader is not expected to necessarily "connect the dots", associated with different situations and examples provided. The only, but an important, feature that these examples have in common is that many aerospace system and ergonomics engineering related tasks and problems, which are perceived and treated today as unquantifiable, could and, in the author's opinion, should be quantified to assure safe and successful outcome of a particular aerospace undertaking of importance.
Acronyms
BAZ: Boltzmann-Arrhenius-Zhurkov (model); BIT: Burn-in testing; COV: Coefficient of Variation; DEPDF: Double Exponential Probability Distribution Function; EVD: Extreme Value Distribution; FDR: Flight Data Record; FOAT: Failure Oriented Accelerated Testing; E&P: Electronic and Photonic; GWB: George Washington Bridge; HALT: Highly Accelerated Life Testing; HCF: Human Capacity Factor; HF: Human Factor; HITL: Human-in-the-Loop; KCAS: Knots Calibrated Air Speed; LGA: La Guardia Airport; MWL: Mental Workload; NTCB: National Transportation Safety Board; PDfR: Probabilistic Design for Reliability; PM: Predictive Modeling; PoF: Probability of Failure; PPM: Probabilistic Predictive Modeling; PRM: Probabilistic Risk Management; RAT: Ram Air Turbine; QT: Qualification Testing; SF: Safety Factor; SM: Safety Margin; TRACON: Terminal Radar Approach Control; TTF: Time to Failure
Introduction
The current efforts led by system engineers to improve reliability of E&P materials, devices, packages and systems, and by human psychologists - in various safety-oriented documentations and activities, are, as a rule, qualitative. E&P systems reliability assurances, even when high operational reliability is crucial, are based on best practices and highly-accelerated-life-testing (HALT) [1,2] - a "black box" that might improve, but does not quantify reliability. The today's efforts of making missions and hazardous situations, including those when the HF is critical, successful and safe, employ, as rule, various non-quantified considerations and speculations. The majority of these efforts are of the mental workload (MWL) or situation awareness type [3-11]. In this review based primarily on the author's recent publications it is shown how analytical PPM geared to a highly focused FOAT (based on the anticipated bottlenecks of the system reliability and human performance) can be effectively employed to "quantify unquantifiable" - predict the PoF and the corresponding lifetime of an E&P product and/or a mission or an off-normal situation, when the role of the HF is critical [12], or when the reliability of the equipment (both hard- and software) and the human performance contribute jointly to the never-zero PoF of the considered effort. Accordingly, three major areas are distinguished and addressed with an objective to quantify what lends itself to more or less convincing quantification: 1) The aerospace E&P reliability [13-109]; 2) The role of the HF in some more or less typical aerospace situations [110-126]; 3) Some HITL related missions and situations, when the instrumentation's reliability and human performance contribute jointly to the outcome of such missions and situations [127-144]. The analyses use analytical modeling and applied probability theory [145-150]. It is briefly indicated also [151-154] how some of the developed models could be used to quantify the outcomes of processes or events even beyond the above areas, such as, e.g., survivability of species in different habitats [154]. The author would like to emphasize again that the "dots" associated with the addressed examples may or may not lend themselves to simple "connection". It is his intent and hope that an aerospace system or ergonomics engineer, after reading the abstract and the introduction, will go through the review and the cited references and will select the analyses pertinent to his/hers area of professional interest.
Review
E&P reliability
Today's practices
some problems envisioned and questions asked: Here are some problems envisioned and questions asked in connection with the today practices in the aerospace system and ergonomics engineering:
• E&P products that underwent HALT [1,2,20,22,54,56], passed the existing qualification tests (QT) and survived burn-in testing (BIT) [94,98,103] (see Table 1 below) often exhibit nonetheless premature field failures. Are these methodologies and practices, and particularly the accelerated test procedures, adequate [26]?
• Do electronic industries need new approaches to qualify their products, and if they do, what should be done differently [45,76]?
• Could the existing practices be improved to an extent that if the product passed the reliability tests, there is a way to assure that it will satisfactorily perform in the field?
• In many applications, such as, e.g., aerospace, military, long-haul communications, medical, etc., high reliability of E&P materials and products is particularly imperative. Could the operational (field) reliability of an electronic product be assured, if it is not predicted, i.e., not quantified [41]?
• And if such quantification is found to be necessary, could that be done on the deterministic, i.e. on a non-probabilistic basis [24,35,40]?
• Should electronic product manufacturers keep shooting for an unpredictable and, perhaps, unachievable very long, such as, e.g., twenty years or so, product lifetime or, considering that every five years a new generation of devices appear on the market and that such long time predictions are quite shaky, to say the least, should the manufacturers settle for a shorter, but well substantiated, predictable and assured lifetime, with an adequate, although never-zero, probability of failure?
• And how such a lifetime should be related to the acceptable (adequate and, if appropriate, even specified) probability of non-failure for a particular product and application?
• Considering that the principle of superposition does not work in reliability engineering, how to establish the list of the crucial accelerated tests, the adequate, i.e., physically meaningful, stressors and their combinations and levels?
• The best engineering product is, as is known, the best compromise between the requirements for its reliability, measurable cost effectiveness and short-as-possible time-to-market [47]; it goes without saying that, in order to make optimization possible, the reliability of such product should also be quantified, but how to do that?
• Bathtub curve [61], the experimental "reliability passport" of a mass-fabricated product, reflects the inputs of two critical irreversible processes - the statistics-of-failure process that results in a reduced failure rate with time (this is particularly evident from the infant mortality portion of the curve) and physics-of-failure (aging, degradation) process that leads to an increased failure rate with time (this trend is explicitly exhibited by the wear out portion of the bathtub diagram). Could these two critical processed be separated [52]? The need for that is due to the obvious incentive to minimize the role and the rate of aging, and this incentive is especially significant for products like lasers, solder joint interconnections and others, which are characterized by long wear out portions and when it is economically infeasible to restrict the product's lifetime to the steady-state situation, when the two irreversible processes in question compensate each other [77].
• A related question has to do with the fact that real rime degradation is a very slow process. Could physically meaningful and cost-effective methodologies for measuring and predicting the degradation (aging) rates and consequences be developed?
In the review that follow some of the above problems are addressed with an objective to show how the recently suggested PDfR concept [25,36,46,48,53,62-65,67,68,70,73,86,88,96] can be effectively employed for making a viable electronic device into a reliable and marketable product.
Accelerated testing
Shortening of electronic product's design and development time does not allow in the today's industrial environment for time consuming reliability investigations. To get maximum reliability information in minimum time and at minimum cost is the major goal of an electronic product manufacturer. On the other hand, it is impractical to wait for failures, when the lifetime of a typical today's electronic product is hundreds of thousands of hours, regardless of whether it could or could not predicted with sufficient accuracy. Accelerated testing is therefore both a must and a powerful means in E&P manufacturing. Different types of such testing are shown and their features are briefly indicated in Table 1.
A typical example of product development testing is shear-off testing conducted when there is a need to determine the most feasible bonding material and its thickness, and/or to assess its bonding strength and/or evaluate the shear modulus of this material. HALT is currently widely employed, in different modifications, with an intent to determine the product's reliability weaknesses, assess reliability limits, ruggedize the product by applying elevated stresses (not necessarily mechanical and not necessarily limited to the anticipated field stresses) that could cause field failures, and to provide large (although, actually, unknown) safety margins over expected in-use conditions. HALT often involves step-wise stressing, rapid thermal transitions, and other means that enable one to carry out testing in a time- and cost- effective fashion. HALT is sometimes referred to as a "discovery" test. It is not a qualification test though, i.e. not a "pass/fail" test. It is the qualification testing that is the major means for making a viable electronic device into a reliable marketable product. While many HALT aspects are different for different manufacturers and often kept as proprietary information, qualification tests and standards are the same for the given industry and product type. Qualification tests (QTs) are the major means to make a viable device into a marketable product. Burn-in testing (BIT) is a post-manufacturing testing. Mass fabrication, no matter how good the design concepts and/or the fabrication technologies are, generates, in addition to desirable-and-robust ("strong") products, also some undesirable-and-unreliable ("weak") devices ("freaks"), which, if shipped to the customer, will most likely fail in the field. BIT is supposed to detect and to eliminate such "freaks". As a result, the final bathtub curve (BTC) of a product that underwent burn-in does not supposedly contain its infant mortality portion. In the today's practice burn-ins, destructive tests for the "freaks" and non-destructive ones for the "healthy" products, are often conducted within the framework of, and concurrently with, HALT.
But are the today's practices based on the above HALT adequate? The funny, but quite practical, definition of a sufficiently robust electronic product is that, as some reliability managers put it, "reliability it is when the customer comes back, not the product". It is well known, however, that E&P products that underwent HALT, passed the existing QTs and survived burn-ins often exhibit premature operational failures. Are the existing practices adequate? Many reliability engineers think that one crucial shortcoming of the today's reliability assurance practices is that they are not based on understanding the underlying the reliability physics for the particular product, its time in operation and operation conditions. But how could one understand the physics-of-failure without running, certainly highly-focused and highly-cost-effective FOAT? It is clear also that if such testing is considered, it should be geared to a particular adequate, simple, easy-to-use and physically meaningful predictive model. Predictive modeling has proven to be a highly useful means for understanding the physics of failure and designing the most practical accelerated tests in E&P engineering. It has been recently suggested that FOAT should be considered as the experimental basis of the new fruitful, flexible and physically meaningful approach - probabilistic design for reliability (PDfR) of E&P products. This approach is based on the following ten major requirements ("commandments") reflecting the rationale behind the PDfR concept.
PDfR and its "ten commandments"
The PDfR concept is an effective means for improving the state-of-the-art in the E&P reliability field by quantifying, on the probabilistic basis, the operational reliability of a material or a product by predicting the probability of its inevitable failure under the given loading conditions and after the given service time, and to use this probability as a suitable and physically meaningful criterion of the product's expected performance. The following ten major governing principles ("commandments") reflect the rationale behind the PDfR concept:
1) When reliability is imperative, ability to predict it is a must; reliability cannot be assured, if it is not quantified;
2) Such a quantification should be done on the probabilistic basis; nothing is perfect; the difference between a highly reliable and an insufficiently reliable product is "merely" in the level of their never-zero probability of failure;
3) Reliability evaluations cannot be delayed until the product is made and should start at the design stage; it should be taken care of, however, at all the significant stages of the product's life: at the design stage, when reliability is conceived; at the accelerated testing stage; at the production/manufacturing stage; and, if necessary and appropriate, should be maintained in the field during the product's operation;
4) Product's reliability cannot be low, but need not be higher than necessary either: it has to be adequate for the given product and application, considering its lifetime, environmental conditions and consequences of failure;
5) The best product is the best compromise between the requirements for its reliability, cost effectiveness and time-to-market; obviously, such a compromise cannot be achieved if reliability is not quantified;
6) One cannot design a product with quantified, assured and optimized reliability by limiting the effort to the HALT; understanding the underlying physics of failure is crucial, and therefore highly cost-effective and highly focused FOAT should be considered and conducted as a possible and natural extension of HALT;
7) FOAT, unlike HALT, is a "white/transparent box" aimed at understanding the physics of failure and to quantify the E&P product's reliability, and should be geared to a small number of pre-determined simple, easy-to-use and physically meaningful predictive reliability models (constitutive equations) and should be viewed as the experimental basis and an important constituent part of the PDfR effort;
8) Physically meaningful, easy-to-use and flexible multi-parametric Boltzmann-Arrhenius-Zhurkov (BAZ) equation can be used as a suitable model for the assessment of the lifetime and the corresponding probability-of-failure of an E&P product;
9) Predictive modeling, not limited to FOAT model(s), is a powerful means to carry out, if necessary, various sensitivity analyses (SA) aimed at quantification and optimization of the E&P product reliability;
10) Consideration of the role of the human factor is highly desirable in the PDfR effort: not only "nothing", but also "nobody" is perfect, and ability to consider and possible quantify of the role of the human factor (HF) in assessing the likelihood of the adequate performance of a product, is often critical.
FOAT ("transparent box") could be viewed as an extension of HALT ("black box")
A highly focused and highly cost effective FOAT is the experimental foundation and the "heart" of the PDfR concept. FOAT [148,56,58,62,84,92,93] should be conducted in addition to and, in some cases, even instead of HALT, especially for new products, whose operational reliability is unclear and for which no experience is accumulated and no best practices nor HALT methodologies are not yet developed. Predictions, based on the FOAT and the subsequent PPM might not be perfect, at least at the beginning, but it is still better to pursue this effort rather than to turn a blind eye on the fact that there is always a non-zero probability of the product's failure.
Understanding the underlying reliability physics for the product performance is critical. If one sets out to understand the physics of failure in an attempt to create, in accordance with the "principle of practical confidence", a failure-free product, then conducting a FOAT type of an experiment is imperative. FOAT's objective is to confirm the usage of a particular more or less well established predictive reliability model, to confirm (say, after HALT is conducted) the physics of failure, and establish the numerical characteristics (activation energy, time constant, sensitivity factors, etc.) of the particular FOAT model of interest.
FOAT could be viewed as an extension of HALT. While HALT is a "black box", i.e., a methodology which can be perceived in terms of its inputs and outputs without a clear knowledge of the underlying physics and the likelihood of failure, FOAT, on the other hand, is a "transparent box", whose main objective is to confirm the use of a particular reliability model that reflects a specific anticipated failure mode and is aimed at quantifying the probability of failure. The FOAT based approach could be viewed as a quantified and reliability physics oriented HALT.
The FOAT approach should be geared to a particular technology and application, with consideration of the most likely stressors. The major assumption is, of course, that the FOAT model should be valid in both accelerated testing and in actual operation conditions. While HALT does not measure (does not quantify) reliability, FOAT does. HALT can be used therefore for "rough tuning" of product's reliability, and FOAT could and should be employed when "fine tuning" is needed, i.e., when there is a need to quantify, assure and even specify the operational reliability of a product.
HALT tries to "kill many unknown birds with one (also not very well known) stone". There is a general perception that HALT might be able to quickly precipitate and identify failures of different origins. HALT has demonstrated, however, over the years its ability to improve robustness through a "test-fail-fix" process, in which the applied stresses (stimuli) are somewhat above the specified operating limits. This "somewhat above" is based, however, on an intuition, rather than on a calculation. FOAT and HALT could be carried out separately, or might be partially combined in a particular accelerated test effort. Since the principle of superposition does not work in reliability engineering, both HALT and FOAT use, when appropriate, combined stressing under various stimuli (stressors). It is always necessary to correctly identify the expected failure modes and mechanisms, and to establish the appropriate stress limits of HALTs and FOATs with an objective to prevent "shifts" in the dominant failure mechanisms. There are many ways of how this could be done (see, e.g., [35]).
New products present natural reliability concerns, as well as significant challenges at all the stages of their design, manufacture and use. An appropriate combination of HALT and FOAT efforts could be especially useful for ruggedizing and quantifying reliability of such products.
Deterministic and probabilistic approaches in the design for reliability of electronic products: Design for reliability is, as is known, a set of approaches, methods and best practices that are supposed to be used at the design stage of the electronic product to minimize the risk that the fabricated product might not meet the reliability objectives and customer expectations.
When deterministic approach is used, reliability of a product could be based on the belief that sufficient reliability level will be assured if a high enough safety factor (SF) is used. The deterministic SF is defined as the ratio of the capacity ("strength") C of the product to the demand ("stress") D. The PDfR SF is introduced as the ratio of the mean value of the safety margin to its standard deviation ŝ, so that the probabilistic safety factor is evaluated as . When the random time-to-failure (TTF) is of interest, the SF can be found as the ratio of the MTTF to the standard deviation of the TTF. The use of SF as a measure of the probability of failure (PoF) is more convenient than the direct use of the PoF itself. This is because this probability is expressed, for highly reliable and, hence, typical electronic products, by a number, which is very close to one, and, for this reason, even significant changes in the product's design, with an appreciable impact on its reliability, might have a minor effect on the level of the PoF, at least the way it appears to and perceived by the user. The SF tends to infinity, when the probability of non-failure tends to one. The PoF (the level of the SF) should be chosen depending on the experience, anticipated operation conditions, possible consequences of failure, acceptable risks, the available and trustworthy information about the capacity and the demand, the accuracy, with which the capacity and the demand are determined, possible costs and social benefits, information on the variability of materials and structural parameters, fabrication technologies and procedures, etc.
Some simple PDfR examples
Adequate heat sink: Consider a device whose steady-state operation is determined by the Arrhenius equation. The probability of non-failure can be found using the exponential law of reliability as
Solving this equation for the absolute temperature T, we have [67]:
Addressing, e.g., surface charge accumulation related failure, for which the ratio of the activation energy to the Boltzmann's constant is , assuming that the FOAT- predicted time factor is hours, that the customer requires that the probability of failure at the end of the device's service time of hours is only , the above formula yields: . Thus, the heat sink should be designed accordingly, and the vendor should be able to deliver such a heat sink. The situation changes to the worse, if the temperature of the device changes, especially in a random fashion. This situation can also be predicted by a simple probabilistic analysis, which is, however, beyond the scope of this analysis (see [72]).
Reliable seal glass: The maximum interfacial shearing stress in the thin solder glass layer (Figure 1) can be computed by the formula [15]: . Here is the parameter of the interfacial shearing stress, is the assembly's axial compliance that is calculated as a sum of the axial compliances of its two constituents, is its interfacial compliance, and are the shear moduli of the ceramics and the glass materials, is the maximum normal stress in the mid-portion of the glass layer, is the change in temperature from the soldering temperature to the low (room or testing) temperature, is the difference in the effective coefficients of thermal expansion (CTEs) of the ceramics and the glass, are these coefficients for the given temperature t, t0 is the annealing (zero stress, setup) temperature, and are the time dependent CTEs for the materials in question. In an approximate analysis one could assume that the axial compliance α of the assembly is due to the glass only, so that and therefore the maximum normal stress in the solder glass is . While the geometric characteristics of the assembly, the change in temperature and the elastic constants of the materials can be determined with high accuracy, this is not the case for the difference in the CTEs of the brittle materials of the glass and the ceramics. In addition, because of the obvious incentive to minimize this difference, such a mismatch is characterized by a small difference of close and appreciable numbers. This contributes to the uncertainty of the problem in question justifies the application of the probabilistic approach.
Treating the CTEs of the two materials as normally distributed random variables, we evaluate the probability P that the thermal interfacial shearing stress is compressive (negative) and, in addition, does not exceed a certain allowable level [15]. This stress is proportional to the normal stress in the glass layer, which is, in its turn, proportional to the difference of the CTE of the ceramics and the glass materials, one wants to make sure that the requirement
takes place with a very high probability. For normally distributed random variables and the variable is also distributed in accordance with the normal law with the mean value and standard deviation as and , where and are the mean values of the materials' CTEs, and and are their variances. The expression
defines the probability that the above condition takes place. Here
is the error function, is the safety factor (SF) for the CTE difference and is the SF for the acceptable level of the allowable stress. If, e.g., the elastic constants of the solder glass are and the sealing (fabrication) temperature is 485 ℃ the lowest (testing) temperature is -65 ℃ (so that ∆t = 550 ℃), the predicted effective CTE's at this temperature are and , the standard deviations of these STEs are and the (experimentally determined) ultimate compressive strength for the given glass material is With the acceptable SF of, say, 4, we have . The calculated allowable level of the CTE-difference parameter is
The mean value and the variance of this parameter are and , respectively. Then the predicted actual and acceptable SFs associated with the thermal mismatch of the materials in question are and , respectively, and the probability of non-failure of the seal glass material is
Note that if the standard deviations of the materials CTEs were, say, , then the SFs of importance would be much higher: and , and the probability of non-failure would be as high as .
Extreme response to temperature cycling: Let an electronic device be operated in temperature cycling conditions, and the random amplitude of the induced thermal stress, when a single cycle is applied is distributed in accordance with the Rayleigh law, so that the probability density function of the stress amplitude is
And what is the most likely extreme value of this amplitude for a large number n of cycles? The probability distribution density function and the probability distribution function for the extreme value Yn of the stress amplitude are expressed as
and
respectively (see, e.g., [145]). Considering the second formula, the first one results in the following expression for the probability distribution density function:
Where is the sought dimensionless amplitude of the induced thermal stress. Applying the condition the following equation can be obtained:
If the number n of cycles is significant, the second term in this expression is small in comparison with the first term and can be omitted, so that and, hence, . As evident from this result, the ratio of the extreme response , after n cycles are applied, to the response , when a single cycle is applied, is . This ratio is 3.2552 for 200 cycles, 3.7169 for 1000 cycles, and 4.1273 for 5000 cycles. With, say, one cycle per day, these correspond to 6.7 months, 2.8 years, and 13.7 years.
BAZ model
Possible way to quantify and assure reliability: The simplest Boltzmann-Arrenius-Zhurkov (BAZ) equation [13,38,39,50,65,71] has been suggested in 1957 by the Russian physisist S.N. Zhurkov in application to experimental fracture mechanics as a generalization of the Arrhenius equation introduced in 1889 by the Swedish chemist S. Arrhenius in the kinetic theory of chemical reactions (1903 Nobel Prize in chemistry). The BAZ and Arrhenius equations consider the role of the ratio of the activation energy (this term was coined by Arrhenius to characterize material's propensity to get engaged into a chemical reaction) to the thermal energy determined as the product of the Boltzmann's constant and the absolute temperature In these equations, is interpreted as the mean time to failure (MTTF), is the experimental time constant, is the applied stress per unit volume, and is the sensitivity factor. Arrhenius equation is formally not different of what is known as Boltzmann's or Maxwell-Boltzmann's equation in the kinetic theory of gases. This equation postulates that the absolute temperature of an ideal gas, when it is in thermodynamic equilibrium with the environment, is determined by the average probability of the collisions of the gas particles (atoms or molecules). Chemist Arrhenius was member of physicist Boltzmann's team in the University of Graz in Austria in 1887 and suggested that Boltzmann's equation be used to assess the significance of the energy barrier, the activation energy, to be got over in order to trigger a chemical reaction. Although Arrhenius equation has been criticized over the years on several grounds (it has been argued, particularly, that this energy might not be a constant property of a material, but might be time- and/or temperature-dependent), it is still widely used, mostly because of its simplicity, in numerous applied science applications, when it is believed that it is the elevated temperature that is primarily responsible for the duration of the useful lifetime of a material or a device of interest.
The effective activation energy
plays in the BAZ equation the same role as the stress-free energy plays in the Arrhenius equation. It has been recently shown [39] that these equations can be obtained as steady-state solutions to the Fokker-Planck equation in the theory of Markovian processes (see, e.g., [145]) and that these solutions represent the worst case scenarios, so that the predictions based on the steady-state BAZ model are reasonably conservative and, hence, advisable in engineering applications.
Zhurkov and his associates used the BAZ equation to determine the fracture toughness of a large number of materials experiencing combined action of elevated temperature and external mechanical loading. While Arrhenius equation, when used to determine the lifetime of a solid, considers only the effect of the elevated temperature on its lifetime, BAZ equation takes into account also the role of the applied mechanical stress. While the elevated temperature affects the long-term reliability of the material (its aging/degradation), the mechanical stress might cause its short-term failure. In addition, in Zhurkov's tests the loading was always a constant mechanical tensile stress, and, because fracture mechanics does not address the initiation of cracks, but only their propagation, the test specimens were always notched ones. It has been recently suggested [53-55] that when the performance of an electronic or a photonic material is considered, any other loading of importance (voltage, current, thermal stress, humidity, vibrations, radiation, light output, etc.) can also be used as an appropriate stressor/stimulus, and, since the superposition principle cannot be employed in reliability engineering, that even a combination of relevant stimuli can be considered, so that a multi-parametric BAZ equation could be employed to evaluate the lifetime of a material or a product.
The use of the BAZ equation has been suggested as a possible physics-of-failure oriented kinetic model in connection with the development of the PDfR concept [25,36,46,48,53,62-65,67,68,70,73,86,88,96] for E&P materials, devices, assemblies, packages and systems to quantify, on the probabilistic basis, the operational lifetime of an E&P product using the results of highly-focused and highly cost-effective failure-oriented-accelerated-testing (FOAT) [22,48,56,58,62]. Such a multi-parametric BAZ equation has been recently employed in application to several critical E&P reliability physics problems. Examples are: an electronic package subjected to the combined action of two or more stressors (such as, say, elevated humidity and voltage) [22]; three-step concept (TSC) in modeling reliability [50]; static fatigue (delayed fracture) of optical silica fibers [71]; low-cycle fatigue of solder joint interconnections [80]; long-term reliability of IC devices [83,85,86,88,91,96] and the BIT [94,98,102] in E&P manufacturing.
The value is viewed in the Boltzmann's equation and in BAZ model
as the mean-time-to-failure (MTTF). This suggests that when the exponential law of the reliability that defines the probability of non-failure
is used, the MTTF corresponds to the moment of time when the entropy of this double-exponential distribution reaches its maximum value. Indeed, from the equation it could be found that the function reaches its maximum for the probability of non-failure
In such a situation the above distribution yields: Comparing this result with the Arrhenius or BAZ equation one concludes that the MTTF expressed by this equation corresponds to the moment of time when the entropy of the process is the largest and is equal to as well.
Note that the above formulation of entropy is different of both Boltzmann's and Shannon's formulations. Boltzmann's entropy in thermodynamics is a quantitative measure of disorder, or of the energy in a system to do work. Shannon's entropy in the communication theory is the probability of character number appearing in the stream of characters of the communication message. It has been recently demonstrated [154] that this definition of entropy could be employed also in some human psychology problems, when there is a need to quantify the role of the human capacity factor, and particularly the role of trust to and trustworthiness of an individual, a concept or a technology.
From the BAZ equation, considering that the probability of failure is we have: . This relationship explains the physical meaning of the BAZ equation: the degree of degradation (aging) of the material or the population of E&P products of interest is proportional to the entropy of the process and is inversely proportional to time.
It has been suggested (see, e.g., [25]) that when information (experimental data) about the lifetime of a particular E&P material or a device in the given environmental/test conditions is available, the time constant in the above distribution could be replaced, having in mind subsequent reliability evaluations, by a quantity where t is time, C is a suitable criterion of failure (such as, say, elevated leakage current or high electrical resistance in FOAT in E&P engineering), the above double-exponential distribution for the probability of non-failure can be replaced by the expression
which, in the case of multiple FOAT stressors, can be generalized as
It should be emphasized that the sum in this expression does not mean that the superposition principle is used. It is just a convenient way to consider the input of different loading to the outcome of FOAT.
Let us show how the multi-parametric BAZ model could be employed using, as an example, a situation when the product of interest is subjected to the combined action of the elevated relative humidity and the elevated voltage V, and let us assume that the failure rate of the product of interest is determined by the level of the leakage current, so that The probability of the product's non-failure can be sought in this case using the following expression for the probability of non-failure:
Here the factors reflect the sensitivities of the device under test to the change in the corresponding stressors. Although only two stressors are selected here - the relative humidity and the elevated voltage - the model can be easily made multi-parametric, i.e., generalized for as many physically meaningful stimuli as necessary. The sensitivity factors should be determined from the FOAT when the combined action of all the stimuli (stressors) of importance is considered.
The physical meaning of the above distribution could be seen from the formulas
where is the entropy of the probability of non-failure. The following two conclusions can be made based on these formulas: 1) The change in the probability of non-failure always increases with an increase in the entropy (uncertainty) of the distribution and decreases with an increase in the leakage current and with time; 2) The last two formulas show the physical meaning of the sensitivity factors : these factors are ratios of the change in the probability of non-failure with respect to the corresponding stimulus to the change of this probability with the change in the stress-free activation energy.
The governing equation for the probability of non-failure contains four empirical parameters: the stress-free activation energy and three sensitivity factors : Leakage-current factor, relative-humidity factor and elevated-voltage factor. Here is how these factors could be obtained from the FOAT data. First one should run the FOAT for two different temperatures and keeping the levels, low or high, of the relative humidity and elevated voltage the same in both tests; recording the percentages (values) and of non-failed samples (or values and of the failed samples); and assuming a certain criterion of failure (say, when the level of the measured leakage current exceeds a certain level Then the relationships
for the probabilities of non-failure can be obtained. Since the numerators in these relationships are kept the same, the following equation must be fulfilled for the sought sensitivity factor :
Here and are the times, at which the failures were detected. It is expected that more than just two series of FOAT tests and at more than two temperature levels are considered, so that the sensitivity parameter is predicted with a high enough accuracy. At the second step, FOAT at two relative humidity levels and should be conducted for the same temperature and voltage. This leads to the relationship:
Similarly, at the third step of tests, by changing the voltages and , the expression
for the sensitivity factor can be obtained:. The stress-free activation energy can be computed, for any consistent humidity, voltage, temperature and time, as
The above relationships could be obtained particularly also for the case of zero voltage, i.e., without a high-voltage bias. This will provide additional information of the materials and device reliability characteristics.
Let, e.g., the following input information is available from FOAT:1) After of testing at the temperature , the voltage V = 600V and the relative humidity H = 0.85, 10% of the tested modules exceeded the allowable (critical) level of the leakage current of and, hence, failed, so that the probability of non-failure is 2) After of testing at the temperature at the same voltage and the same relative humidity, 20% of the tested samples reached or exceeded the critical level of the leakage current and, hence, failed, so that the probability of non-failure is Then the sensitivity factor can be obtained from the equation:
This equation yields: so that . A more accurate solution can be always obtained by using Newton iterative method for solving transcendental equations. This concludes the first step of testing. At the second step, FOAT at two relative humidity levels, and , were conducted for the same levels of temperature and voltage. Then the sensitivity factor is
Let, e.g., after of testing at the relative humidity of at the given voltage (say, V = 600 V) and temperature (say, ), 5% of the tested modules failed, so that , and after of testing at the same temperature and at the relative humidity of , 10% of the tested modules failed, so that . Then the above equation for the value, with the Boltzmann constant yields: . At the third step, FOAT at two different voltage levels and has been carried out for the same temperature-humidity bias, say, and , and it has been determined that 10% of the tested devices failed after of testing () and 20% of devices failed after of testing (). The voltage sensitivity factor is
After the sensitivity factors are found, the stress free activation energy can be determined for the given temperature and for any combination of the loadings (stimuli). Calculations indicate that the stress free activation energy in the above numerical example (even with the rather tentative, but still realistic, input data) is about
This result is consistent with the existing experimental data for IC devices. Indeed, for semiconductor device failure mechanisms the activation energy ranges from 0.3 to 0.6eV, for metallization defects and electro-migration in Al it is about 0.5eV, for charge loss it is on the order of 0.6 eV, for Si junction defects it is 0.8 eV.
The total cost of reliability could be quantified and even minimized
Let us show [47], using rather elementary reasoning, how the total cost of an IC product associated with reliability (dependability) on one hand and cost-effectiveness on the other could be minimized. The cost of achieving and improving reliability can be estimates based on the exponential formula , where is the actual level of the MTTF, is the specified MTTF level, is the cost of achieving the level of reliability and is the cost factor associated with reliability improvements. Similarly, let us assume that the cost of reliability repair can be also assessed by the exponential formula , where is the cost of restoring the product's reliability, and is the factor of the reliability restoration (repair) cost. The latter formula reflects a natural assumption that the cost of repair is lower for a product of higher reliability. The total cost has its minimum
when the minimization condition is fulfilled. Let us further assume that the factor of the reliability improvement cost is inversely proportional to the MTTF (dependability criterion), and the factor of the reliability restoration cost is inversely proportional to the mean time to repair MTTR (reparability criterion). Then the minimum total cost is
where the availability
is the probability that the product is sound and is available to the user any time at the steady-state operations. In this formula is the mean TTF and is the mean time to repair. The above result obtained for the total minimum cost establishes, in an elementary way, the relationship between the minimum total cost of achieving and maintaining (restoring) the adequate reliability level and the availability criterion. The obtained relationship quantifies the intuitively obvious fact that the total cost of the product depends on both the total cost and the availability of the product.
The formula
that follows from the above derivation indicates that if the availability index is high, the ratio of the cost of repairs to the cost aimed at improved reliability is low. When the availability index is low, this ratio is high. This intuitively obvious result is quantified by the obtained simple relationship. The above reasoning can be used to interpret the availability index from the cost-effectiveness point of view: the index reflects, in effect, the ratio of the cost of improving reliability to the minimum total cost of the product associated with its reliability level. This and similar, even elementary, models can be of help, particularly, when there is a need to minimize costs without compromising reliability, i.e., in various optimization analyses.
Possible next generation of the QTs
The application of FOAT, the PDfR concept and particularly the multi-parametric BAZ model enables improving dramatically the state of the art in the field of the E&P products reliability predictions and assurances. Since FOAT cannot do without simple, easy-to-use and physically meaningful predictive modeling, the role of such modeling, both computer-aided and analytical (mathematical), in making the suggested new approach to QT practical and successful is paramount. It is imperative also that the reliability physics that underlies the mechanisms and modes of failure is well understood. Such an understanding can be achieved only provided that flexible, powerful and effective PDfR effort is implemented. The next generation QT could be viewed as a "quasi-FOAT," "mini-FOAT", a sort-of an "initial stage of FOAT" that more or less adequately replicates the initial non-destructive, yet full-scale, stage of FOAT conducted and agreed upon when the particular manufacturing technology of importance is developed. The duration and conditions of such a "mini-FOAT" QT could and should be established based on the observed and recorded results of the actual, pre-manufacturing, FOAT, and the actual QT should be limited to the stage when no failures, or a predetermined and acceptable small number of failures in the actual, full-scale, FOAT, was conducted and analyzed.
Various suitable PHM technologies could be concurrently tested as useful "canaries" to make sure that the safe limit is established correctly and is not exceeded. Such an approach to qualify electronic devices into products will enable the industry to specify, and the manufacturers - to assure, a predicted and adequate probability of failure for an E&P product that passed the QT and is expected to be operated in the field under the given conditions for the given time. The appropriate highly focused and highly cost-effective FOAT should be thoroughly designed, implemented, and analyzed, so that the QT of a product if importance is based on the trustworthy FOAT data.
Three-step concept in prognostics-and-health monitoring (PHM) engineering
When encountering a particular reliability problem at the design, fabrication, testing, or an operation stage of a product's life, and considering the use of predictive modeling to assess the seriousness and the likely consequences of the a detected failure, one has to choose whether a statistical, or a physics-of-failure-based, or a suitable combination of these two major modeling tools should be employed to address the problem of interest and to decide on how to proceed. A three-step concept [50] is suggested as a possible way to go in such a situation. The classical statistical Bayes formula can be used at the first step in this concept as a technical diagnostics tool. Its objective is to identify, on the probabilistic basis, the faulty (malfunctioning) device(s) from the obtained signals ("symptoms of faults").
The physics-of-failure-based BAZ model and particularly its multi-parametric extension can be employed at the second step to assess the RUL of the faulty device(s). If the RUL is still long enough, no action might be needed; if it is not, corrective restoration action becomes necessary. In any event, after the first two steps are carried out, the device is put back into operation (testing), provided that the assessed probability of its continuing failure-free operation is found to be satisfactory. If an operational failure nonetheless occurs, the third step should be undertaken to update reliability. Statistical beta-distribution, in which the probability of failure is treated as a random variable, is suggested to be used at this step.
While various statistical methods and approaches, including Bayes formula and beta-distribution, are well known and widely used in numerous applications for many decades, the BAZ model was introduced in the microelectronics reliability area only several years ago. Its attributes and use are addressed and discussed therefore in some detail. The suggested concept is illustrated by a numerical example geared to the use of the highly popular today prognostics-and-health-monitoring (PHM) effort in actual operation, such as, e.g., en-route flight mission.
Electron device subjected to temperature cycling
Predicted time-to-failure: Using the BAZ model, the probability of non-failure of a vulnerable material, such as, e.g., solder joint interconnection experiencing inelastic strains during temperature cycling, can be sought as
.
Here is the activation energy and is the characteristic of the solder material's propensity to fracture, is the damage caused by a single temperature cycle and measured, in accordance with Hall's concept [109], by the hysteresis loop area of a single temperature cycle for the strain of interest, is the absolute temperature (say, the cycle's mean temperature), is the number of cycles, is Boltzmann's constant, , is time, is the measured (monitored) electrical resistance at the peripheral joint location, and is the sensitivity factor for the resistance. It could be shown that the MTTF expressed as
Mechanical failure, associated with temperature cycling, takes place, when the number of cycles is When this condition takes place, the temperature in the denominator in the parentheses of the above BAZ equation becomes irrelevant, and this equation yields: where is the measured probability of non-failure for the situation when failure occurred because of temperature cycling, and is the MTTF. If, e.g., 20 devices have been temperature cycled and the high resistance considered as an indication of failure was detected in 15 of them, then If the number of cycles during such FOAT was, say, and each cycle lasted for 20min = 1200sec., then the time at failure is , and the sensitivity factor and the can be determined as
and
According to Hall's concept [109], the energy of a single cycle should be evaluated, by running a specially designed test, in which strain gages should be used. Let, e.g., in the above tests this energy (the area of the hysteresis loop) was Then the stress-free activation energy for the solder material is
To assess the number of cycles to failure in actual operation conditions one could assume that the temperature range in these conditions is, say, half the accelerated test range, and that the area of the hysteresis loop is proportional to the temperature range. Then the number of cycles to failure is
If the duration of one cycle in actual operation conditions is one day, then the time to failure will be
Role of the human factor (HF)
PPM concept in HF related situations
Human error contributes to about 80% of vehicular (aerospace, maritime, railroad, automotive) casualties (see, e.g., [110-126]). Ability to understand their nature and minimize their likelihood is of obvious and significant importance. While considerable improvements in various vehicular technologies and other HF related missions and situations can be achieved through better ergonomics, better work environment, and other traditional means that directly affect human behaviors and performances, there is also an opportunity (potential) for a further reduction in vehicular and other HF related casualties through better understanding the role that various uncertainties play in the designer's and operator's world of work. By employing quantifiable and measurable ways to assess the role of these uncertainties and by treating HITL as a part, often the most critical part, of the complex man-instrumentation-equipment-vehicle-environment system, one could improve dramatically the human's performance, to predict, minimize and, when possible and appropriate, even specify the probability of the occurrence of a never-completely-avoidable casualty. It is the author's belief that adequate human performance cannot be assured, if it is not quantified and, since nobody is perfect, that such quantification should be done on the probabilistic basis. In effect, the only difference between what is perceived as a failure-free and an unsatisfactory human performance is, in effect, the difference in the levels of the never-zero probability of human failure. Application of the quantitative PPM concept should complement in various HF related situations, whenever feasible and possible, the existing human psychology practices, which are, as a rule, qualitative a-posteriori statistical assessments. A PPM approach based particularly on the DEPDF is a suitable quantitative technique for assessing the probability of the human non-failure (HnF) in various aircraft missions and off-normal flight situation. The long-term HCF is considered below vs. the (elevated) short-term MWL that the human has to cope with to successfully withstand an off-normal (emergency) situation.
The famous 2009 US Airways "miracle-on-the-Hudson" successful ditching and the infamous 1998 Swiss Air "UN-shuttle" disaster are chosen to illustrate the usefulness and fruitfulness of the approach. The input data are hypothetical, but not unrealistic. And it is the approach, and not the numbers, that is, in the author's opinion, the merit of the study. As the co-inventor of the calculus, the great German mathematician Gottfried Leibnitz put it, "there are things in this world, far more important than the most splendid discoveries-it is the methods by which they were made." It is shown that it was the exceptionally high HCF of the US Airways crew and especially that of its captain Sullenberger that made a reality what seemed to be, at the first glance, a "miracle". It is shown also that the highly professional and, in general, highly qualified Swiss Air crew exhibited inadequate performance (quantified in our analysis as a relatively low HCF level) in the much less challenging off-normal situation they encountered with. The Swiss Air crew made several serious errors and, as a result, crashed the aircraft. In addition to the DEPDF based approach, we show, using a convolution approach in the applied probability, that the probability of safe landing can be evaluated by comparing the (random) operation time (that consists of the decision making time and the actual landing time) with the "available" anticipated time needed for landing. It is concluded that the developed formalisms, after trustworthy input data are obtained (using, e.g., flight simulators [119] or by applying Delphi method (see, e.g. [145]) might be applicable even beyond the vehicular domain and can be employed in various HITL situations, when a long term high HCF is imperative and the ability to quantify it in comparison with the short term MWL is highly desirable. It is concluded also that, although the obtained numbers make physical sense, it is the approach, not the numbers, that is, in the author's opinion, the main merit of the paper.
In the analysis below we show, as an example, how the double-exponential probability distribution function (DEPDF) could be applied for the evaluation of the likelihood of a human non-failure in an emergency vehicular mission-success-and-safety situation. The famous 2009 "miracle-on-the-Hudson" event and the infamous 1998 "UN-shuttle" disaster [131] are used to illustrate the substance and fruitfulness of the approach. We try to shed "probabilistic light" on these two well-known events. As far as the "miracle-on-the-Hudson" is concerned, we intend to provide quantitative assessments of why such a "miracle" could have actually occurred, and what had been and had not been indeed a "miracle" in this incident: a divine intervention, a perceptible interruption of the laws of nature, or "simply" a wonderful and rare occurrence that was due to a heroic act of the aircraft crew and especially of its captain Sullenberger ("Sully") the lead "miracle worker" in the incident. As to the "UN-shuttle" crash, we are going to demonstrate that the crash occurred because of the low HCF of the aircraft crew in an off-normal situation that they had encountered and that was, in effect, much less demanding than the "miracle-on-the-Hudson" situation.
MWL vs. HCF: A way to quantify human performance
In the simplest model such a failure should be attributed to an insufficient human capacity factor (HCF), when he/she has to cope with a high cognitive (mental) workload (MWL). Our suggested MWL/HCF models and their possible modifications and generalizations can be helpful, after appropriate sensitivity factors are established and sensitivity analyses (SA) are carried out, 1) When developing guidelines for personnel selection and training; 2) When choosing the appropriate simulation conditions; and/or 3) When there is a need to decide, if the existing levels of automation and of the employed equipment (instrumentation) are adequate in off-normal, but not impossible, situations, and if not, 4) Whether additional and/or more advanced and perhaps more expensive equipment or instrumentation should be developed, tested and installed, so that the requirements and constraints associated with a mission or a situation of importance are met.
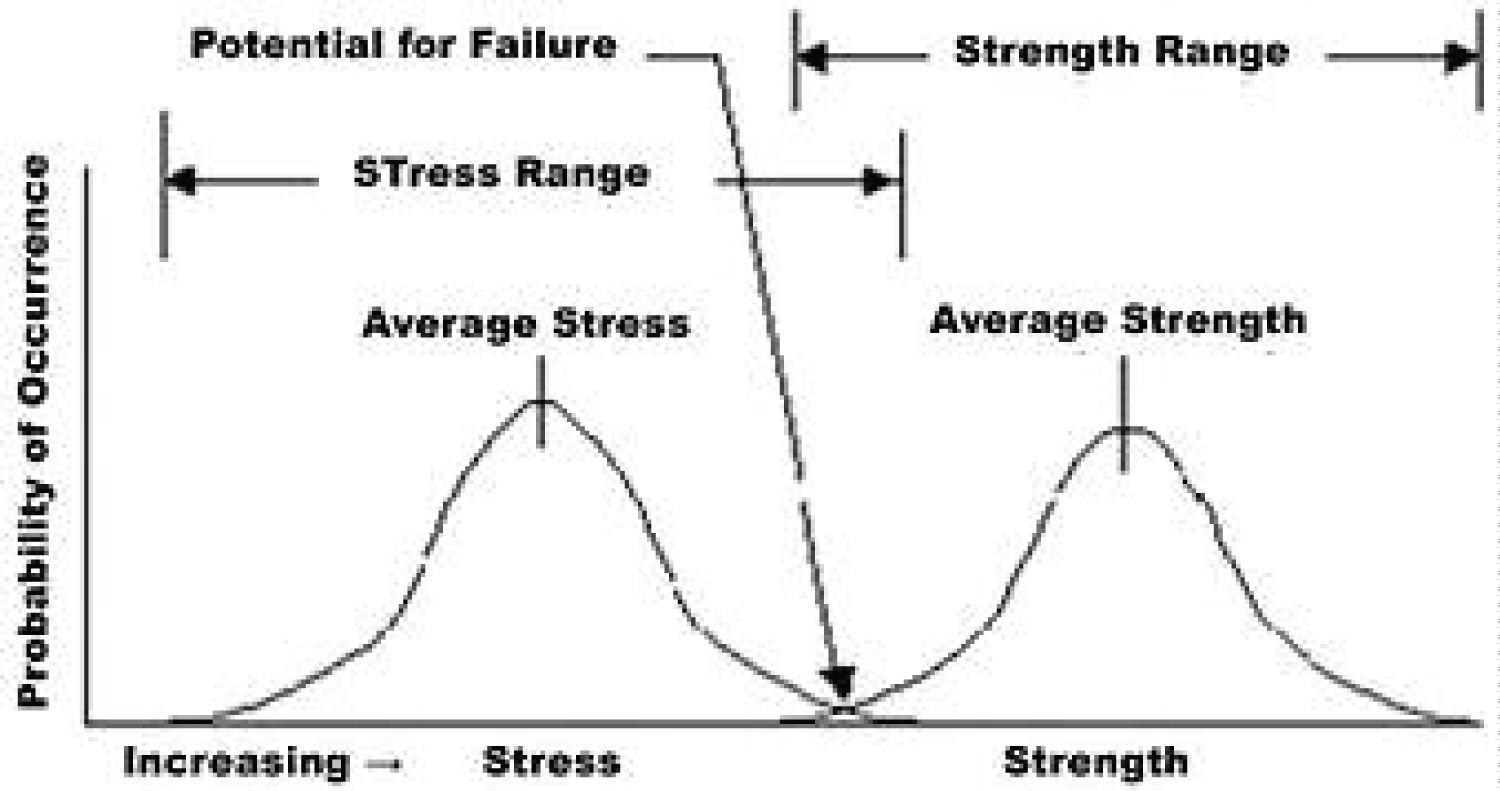
Our MWL/HCF based approach is, in effect, an attempt to quantify, on the probabilistic basis, using probabilistic risk management (PRM) techniques, the role that the human plays, in terms of his/her ability (capacity) to cope with a mental overload. Using an analogy from the reliability engineering field and particularly with the well known "stress-strength" interference model (Figure 2), the MWL could be viewed as a certain possible "demand" ("stress"), while the HCF - as an available or a required "capacity" ("strength"). The MWL level depends on the operational conditions and the complexity of the mission, i.e., has to do with the significance of the general task, while the HCF considers, but might not be limited to, the human's professional experience and qualifications, capabilities and skills; level and specifics of his/her training; performance sustainability; ability to concentrate; mature thinking; ability to operate effectively, in a "tireless" fashion, under pressure, and, if needed, for a long period of time (tolerance to stress); team-player attitude; swiftness in reaction, if necessary, etc., i.e., all the critical qualities that would enable him/her to cope with the high MWL. It is noteworthy that the ability to evaluate the "absolute" level of the MWL, important as it might be for numerous existing non-comparative evaluations, is less critical in our approach: it is the comparative levels of the MWL and the HCF, and the comparative assessments and evaluations that are important in our approach. The author does not intend to come up with an accurate, complete, ready-to-go, "off-the-shelf"-type of a methodology, in which all the i's are dotted and all the t's are crossed, but intends to show how the powerful and flexible PRM methods could be effectively employed to quantify the role of the human factor by comparing, on the probabilistic basis, the actual and/or possible MWL and the available or required HCF levels, so that the adequate and sufficient safety factor is assured.
In this section the famous "miracle-on-the-Hudson" event is used as a suitable example to illustrate the concept in question. We believe that the taken approach, with the appropriate modifications and generalizations, is applicable to many HITL situations, not necessarily in the vehicular domain, when a human encounters an uncertain environment and/or a hazardous situation and/or interacts with never perfect hardware and software. The author realizes that his approach might not be accepted easily by some traditional human psychologists. They might feel that the problem is too complex to lend itself to any type of formalized quantification. With this in mind we are suggesting possible next steps (future work) that could be conducted using, when necessary, flight simulators to correlate the suggested probabilistic models with the existing practice. Testing on a flight simulator is analogous to the highly-accelerated life testing (HALT) and particularly failure-oriented-accelerated testing (FOAT) in electronics and photonics reliability engineering.
The famous "Miracle-on-the-Hudson" event is chosen in this section to illustrate the possible application of the MWL-HCF bias in the HITL related missions and situations. It is important to emphasize that this is merely an illustration on how these two major aspects of the HITL related situation could be treated, and not to show, in a rather tentative fashion, why indeed Capt. Sullenberger was successful in an extraordinary situation, where other navigators may or may not be. As Gottfried Leibnitz, the famous German mathematician put it, "there are things in this world, far more important than the most splendid discoveries - it is the methods by which they were made".
HCF vs. MWL approach
"The ten commandments" of the HCF vs. MWL approach: Here are the major principles ("ten commandments") of our PRM-based approach in the HF related tasks:
1. HCF is viewed in this approach as an appropriate quantitative measure (not necessarily and not always probabilistic though) of the human ability to cope with an elevated short term MWL;
2. It is the relative levels of the MWL and HCF (whether deterministic or random) that determine the probability of human non-failure in a particular HITL situation;
3. Such a probability cannot be low, but need not be higher than necessary either: it has to be adequate for a particular anticipated application and situation;
4. When adequate human performance is imperative, ability to quantify it is highly desirable, especially if one intends to optimize and assure adequate HITL performance;
5. One cannot assure adequate human performance by just conducting routine today's human psychology based efforts (which might provide appreciable improvements, but do not quantify human behavior and performance; in addition, these efforts might be too and unnecessarily costly), and/or by just following the existing "best practices" that are not aimed at a particular situation or an application; the events of interest are certainly rare events, and "best practices: might or might not be applicable;
6. MWLs and HCFs should consider, to an extent possible, the most likely anticipated situations; obviously, the MWLs are and HCFs should be different for a jet fighter pilot, for a pilot of a commercial aircraft, or for a helicopter pilot, and should be assessed and specified differently;
7. PRM is an effective means for improving the state-of-the-art in the HITL field: nobody and nothing is perfect, and the difference between a failed human performance and a successful one is "merely" in the level of the probability of non-failure;
8. Failure oriented accelerated testing (FOAT) on a flight simulator is viewed as an important constituent part of the PRM concept in various HITL situations: it is aimed at better understanding of the factors underlying possible failures; it might be complemented by the Delphi (experts' opinion) effort;
9. Extensive predictive modeling (PM) is another important constituent of the PRM based effort, and, in combination with highly focused and highly cost effective FOAT, is a powerful and effective means to quantify and perhaps nearly eliminate human failures;
10. Consistent, comprehensive and psychologically meaningful PRM assessments can lead to the most feasible HITL qualification (certification) methodologies, practices and specifications.
Mental workload (MWL): Our HCF vs. MWL approach considers elevated (off-normal) random relative HCF and MWL levels with respect to the ordinary (normal, pre-established) deterministic HCF and MWL values. These values could and should be established on the basis of the existing human psychology practices. The interrelated concepts of situation awareness and MWL ("demand") are central to the today's aviation psychology. Cognitive (mental) overload has been recognized as a significant cause of error in aviation. The MWL is directly affected by the challenges that a navigator faces, when controlling the vehicle in a complex, heterogeneous, multitask, and often uncertain and harsh environment. Such an environment includes numerous different and interrelated concepts of situation awareness: spatial awareness for instrument displays; system awareness for keeping the pilot informed about actions that have been taken by automated systems; and task awareness that has to do with the attention and task management. The time lags between critical variables require predictions and actions in an uncertain world. The MWL depends on the operational conditions and on the complexity of the mission. MWL has to do therefore with the significance of the long- or short-term task. The long-term MWL is illustrated in Figure 3.
Task management is directly related to the level of the MWL, as the competing "demands" of the tasks for attention might exceed the operator's resources - his/her "capacity" to adequately cope with the "demands" imposed by the MWL.
Measuring the MWL has become a key method of improving aviation safety. There is an extensive published work in the psychological literature devoted to the measurement of the MWL in aviation, both military and commercial. Pilot's MWL can be measured using subjective ratings and/or objective measures. The subjective ratings during FOAT (simulation tests) can be, e.g., after the expected failure is defined, in the form of periodic inputs to some kind of data collection device that prompts the pilot to enter a number between 1 and 10 (for example) to estimate the MWL every few minutes. There are some objective MWL measures, such as, e.g., heart rate variability. Another possible approach uses post-flight paper questionnaires. It is easier to measure the MWL on a flight simulator than in actual flight conditions. In a real aircraft, one would probably be restricted to using post-flight subjective (questionnaire) measurements, since one would not want to interfere with the pilot's work.
Given the multidimensional nature of MWL, no single measurement technique can be expected to account for all the important aspects of it. In modern military aircraft, complexity of information, combined with time stress, creates difficulties for the pilot under combat conditions, and the first step to mitigate this problem is to measure and manage the MWL. Current research efforts in measuring MWL use psycho-physiological techniques, such as electroencephalographic, cardiac, ocular, and respiration measures in an attempt to identify and predict MWL levels. Measurement of cardiac activity has been a useful physiological technique employed in the assessment of MWL, both from tonic variations in heart rate and after treatment of the cardiac signal.
Human capacity factor (HCF): HCF includes, but might not be limited to, the following major qualities that would enable a professional human to successfully cope with an elevated off-normal MWL. Some of them are: age; personality type; state of health and fitness; psychological suitability for a particular task (relevant capabilities and skills, and performance sustainability/ consistency/ predictability); professional experience and qualifications; education, both special and general; level, quality and timeliness of training; leadership ability; independent thinking and independent acting, when necessary; mature (realistic) thinking ability to concentrate; ability to anticipate; adequate level of self control and ability to act in cold blood in hazardous and even life threatening situations; ability to operate effectively under pressure, and particularly under time pressure; ability to make well substantiated decisions in a short period of time; tolerance to stress (ability to operate effectively, when necessary, in a tireless fashion, for a long period of time, including propensity to drowsiness); team-player attitude, when necessary; swiftness in reaction, when necessary; adequate trust (in humans, technologies, equipment); ability to maintain the optimal level of physiological arousal.
These and other qualities are certainly of different importance in different HITL situations. It is clear also that different individuals possess these qualities in different degrees. Long-term HCF could be time-dependent. These and other qualities are certainly of different importance in different HITL situations. It is clear also that different individuals possess these qualities in different degrees. Long-term HCF could be time-dependent. To come up with a suitable figures-of-merit (FOM) for the HCF, one could rank the above and perhaps other qualities on the scale from, say, one to four, and calculate the average FOM for each individual and particular task and/or a mission or a situation (see, e.g., Table 2, Table 3 and Table 4 below).
Application of the double-exponential probability distribution function (DEPDF): Different PRM approaches can be used in the analysis and optimization of the interaction of the MWL and HCF. When the MWL and HCF characteristics are treated as deterministic ones, a high enough safety factor can be used. When both MWL and HCF are random variables, the safety factor can be determined as the ratio of the mean value of the random safety margin to its standard deviation SSM.
When the capacity-demand ("strength-stress") interference model is used (Figure 2) the HCF can be viewed as the capacity (strength) and the MWL as the demand (stress), and their overlap area could be considered as the potential (probability) of possible human failure. The capacity and the demand distributions can be steady-state or transient, i.e., their mean values can move towards each other when time progresses, and/or the MWL and HCF curves can get spread over larger areas. Yet another PRM approach is to use a single distribution that accounts for the roles of the HCF and MWL, when these (random) characteristics deviate from (are higher than) their (deterministic) most likely (regular) values. It is this approach that is used in the analysis below. A function
which is a DEPD function, can be used to characterize the likelihood of a human non-failure to perform his/her duties, when operating a vehicle. Here is the probability of non-failure of the human performance as a function of the off-normal mental workload (MWL) and outstanding human capacity factor (HCF) , is the probability of non-failure of the human performance for the specified (normal) MWL and the specified (ordinary) HCF The specified (most likely, nominal, normal) MWL and HCF can be established by conducting testing and measurements on a flight simulator. The probabilities
are shown in Table 5. The following conclusions can be drawn from the table data:
1) At normal (specified, most likely) MWL level () and/or at an extraordinary (exceptionally) high HCF level the probability of human non-failure is close to 100%;
2) The probabilities of human non-failure in off-normal situations are always lower than the probabilities of non-failure in normal (specified) conditions;
3) When the MWL is extraordinarily high, the human will definitely fail, no matter how high his/her HCF is;
4) When the HCF is high, even a significant MWL has a small effect on the probability of non-failure, unless the MWL is exceptionally high. For high HCFs the increase in the MWL has a much smaller effect on the probabilities on failure than for relatively low HCFs;
5) The probability of human non-failure decreases with an increase in the MWL, especially at low MWL levels, and increases with an increase in the HCF, especially at low HCF levels. These intuitively more or less obvious conclusions are quantified by the Table 5 data.
These data show also that the increase in the probability ratio above 3.0 ("three is a charm" in this case) has a minor effect on the probability of non-failure. This means particularly that the navigator (pilot) does not have to be trained for an unrealistically high MWL, i.e., does not have to be trained by a factor higher than 3.0 compared to a navigator of ordinary capacity (skills, qualification). In other words, a pilot does not have to be a superman to successfully cope with a high level MWL, but still has to be trained in such a way that, when there is a need, he/she would be able to cope with a MWL by a factor of 3.0 higher than the normal level, and his/her HCF should be by a factor of 3.0 higher than what is expected of the same person in ordinary (normal) conditions. Of course, some outstanding individuals (like, e.g., Captain Sullenberger) might have a HCF that corresponds to MWL's significantly higher than 3.0.
Let us determine the underlying physics for the introduced DEPDF. The MWL derivative of this distribution is as follows:
where is the entropy of the distribution. When the MWL is significant, this formula yields:
This result explains the physical meaning of the distribution in question: the change in the probability of human non-failure (provided that the probability of non-failure in normal conditions is simply 100%) with the change in the MWL is, for large MWL levels, proportional to the uncertainty level defined by the entropy of the distribution in question and is inversely proportional to the MWL level. The right part of the obtained formula can be viewed as a kind of coefficient of variation (COV), where the role of the uncertainty level in the numerator is played by the entropy (rather than by the standard deviation, which, as is known, is also, in a way, a measure of uncertainty) and the role of the stress (loading) level in the denominator is played by the MWL (rather than by the mean value of the random characteristic of interest). One could find also:
When the random HCF is equal to its nominal (low level) value , this formula yields:
This result can also be used to interpret the physics underlying the introduced DEPDF: the change in the probability of human non-failure with the change in the HCF at its nominal (normal) level is proportional to the entropy of this distribution and is inversely proportional to the nominal HCF. From the equation for the probability we obtain:
This relationship is tabulated in Table 6. The following conclusion can be drawn from the computed data: 1) The HCF level needed to cope with an elevated MWL increases rather slowly with an increase in the probability-of-non-failure, especially for high MWL levels, unless this probability is very low (below 0.1) or very high (above 0.9); 2) In the region the required high HCF level increases with an increase in the MWL level, but this increase is rather moderate, especially for high MWL levels; 3) Even for significant MWLs that exceed the normal MWL by orders of magnitude the level of the HCF does not have to be very much higher than the HCF of a person of ordinary HCF level. When the MWL ratio is as high as 100, the HCF ratio does not have to exceed 4 to assure the probability of non-failure of as high as 0.999.
Approach based on the convolution technique: Operation time vs. available time
The above time-independent DEPDF based approach enables one to compare, on the probabilistic basis, the relative roles of the MWL and HCF in a particular off-normal HF related situation. The role of time (e.g., swiftness in reaction) is accounted for in an indirect fashion, through the HCF level. In the analysis that follows we assess the likelihood of safe landing by considering the roles of different times directly, by comparing the operation time, which consists of the decision making time and actual landing time, with the "available" landing time (i.e., the time from the moment when an emergency was determined to the moment of landing). Particularly, we address the ability of the pilot to anticipate and to make a substantiated and valid decision in a short period of time (as Captain Sullenberger has put it, "We are going to be in the Hudson"). It is assumed, for the sake of simplicity, that both the decision making and the landing times could be approximated by the Rayleigh's law, while the available time, considering, in the case of the "miracle-on-the-Hudson" flight) the glider conditions of the aircraft, follows the normal law with a high ratio of the mean value to the standard deviation. Safe landing could be expected if the probability that it occurs during the "available" landing time is sufficiently high. The formalism of such a model is similar to the one taken in the helicopter-landing-ship (HLS) approach [127]. If the (random) sum, T = t + θ, of the (random) decision making time, t, and the (random) time, θ, needed to actually land the aircraft is lower, with a high enough probability, than the (random) duration, L, of the available time, then safe landing becomes possible (in the HLS problem it was the random time of the lull in the sea condition).
In the analysis that follows the Rayleigh's law
is used as a suitable approximation for the random times t and θ of decision making and actual landing, and the normal law
as an acceptable approximation for the available time, L ("lull" time in the HLS problem). In these formulas, and are the most likely times of decision making and landing, respectively, is the most likely (mean) value of the available time, and is the standard deviation of this time. The ratio ("safety factor") of the mean value of the available time to its standard deviation should be large enough (say, larger than 4), so that the normal law could be used as an acceptable approximation for a random variable that, in principle, cannot be negative, as it is the case when this variable is time. In a simplified approach the time L could be treated as a non-random variable. Captain Sullenberger certainly had a general feeling for this time, i.e. of how long his aircraft would stay in the air. The probability, , that the sum T = t + θ of the random variables t and θ exceeds a certain time level, , can be found on the basis of the convolution of two random times distributed in accordance with the Rayleigh law as follows:
where
is the error function. When the most likely duration of landing, , is very small compared to the most likely decision making time, , this expression yields: , i.e., the probability that the total time of operation exceeds a certain time duration, , depends only on the most likely decision making time, . Then . If the acceptable probability, , of exceeding the "available" time, , if this time is treated as a non-random variable of the level , is, say, , then the time of making the decision should not exceed 0.2330 = 23.3% of the time, , otherwise the requirement will be compromised. If the available time is, say, 2 min, then the decision making time should not exceed 28 sec, which is in good agreement with Capt. Sullenberger's actual decision making time. Similarly, when the most likely time, , of decision making is very small compared to the most likely time, , of actual landing, then , i.e., the probability of exceeding a certain time level depends only on the most likely time, , of landing. As follows from the above formulas, the probability that the actual time of decision making or the time of landing exceed the corresponding most likely time is as high as .
In this connection it is noteworthy that the one-parametric Rayleigh law is characterized by a rather large standard deviation and therefore might not be the best approximation for the probability density functions for the decision making time and the time of landing. A more "powerful" and a more flexible two-parametric law, such as, e.g., the Weibull law, might be more suitable as an appropriate probability distribution of the random times, t and θ. Its use, however, will make our analysis unnecessarily more complicated. Our goal is not so much to "dot all the i's and cross all the t's", as far as modeling of the role the HF in the problem in question is concerned, but rather to demonstrate that the attempt to use PPM methods to quantify the role of the HF in the problems of the type in question might be quite fruitful. When developing practical guidelines and recommendations, a particular law of the probability distribution should be established beforehand based on the actual statistical data, and employment of various goodness-of-fit criteria [145] might be needed in the detailed and trustworthy analyses.
"Miracle-on-the-Hudson" vs. "Crash- in-the-Atlantic"
US Airways Flight 1549: incident: US Airways Flight 1549 was a domestic passenger flight from LaGuardia Airport (LGA) in New York City to Charlotte/Douglas International Airport, Charlotte, North Carolina. On January 15, 2009, the Airbus A320-214 flying this route struck a flock of Canada Geese during its initial climb out, lost engine power, and ditched in the Hudson River off midtown Manhattan. Since all the 155 occupants survived and safely evacuated the airliner, the incident became known as the "Miracle-on-the-Hudson" [131].
The bird strike occurred just northeast of the George Washington Bridge (GWB) about three minutes into the flight and resulted in an immediate and complete loss of thrust from both engines. When the crew determined that they would be unable to reliably reach any airfield, they turned southbound and glided over the Hudson, finally ditching the airliner near the USS Intrepid museum about three minutes after losing power. The crew was later awarded the Master's Medal of the Guild of Air Pilots and Air Navigators for successful "emergency ditching and evacuation, with the loss of no lives... a heroic and unique aviation achievement...the most successful ditching in aviation history."
The pilot in command was 57-year-old Capt. Chesley B. "Sully" Sullenberger, a former fighter pilot who had been an airline pilot since leaving the United States Air Force in 1980. He was also a safety expert and a glider pilot. The first officer was Jeffrey B. Skiles, 49. The flight attendants were Donna Dent, Doreen Welsh and Sheila Dail. The aircraft was powered by two GE Aviation/Snecma-designed CFM56-5B4/P turbofan engines manufactured in France and the U.S. One of 74 A320s then in service in the US Airways fleet, it was built by Airbus with final assembly at its facility at Aéroport de Toulouse-Blagnac in France in June 1999 and delivered to the carrier on August 2, 1999. The Airbus is a digital fly-by-wire aircraft: the flight control surfaces are moved by electrical and hydraulic actuators controlled by a digital computer. The computer interprets pilot commands via input from a side-stick, making adjustments on its own to keep the plane stable and on course. This is particularly useful after engine failure by allowing the pilots to concentrate on engine restart and landing planning. The mechanical energy of the two engines is the primary source of electrical power and hydraulic pressure for the aircraft flight control systems. The aircraft also has an auxiliary power unit (APU), which can provide backup electrical power for the aircraft, including its electrically powered hydraulic pumps; and a ram air turbine (RAT), a type of wind turbine that can be deployed into the airstream to provide backup hydraulic pressure and electrical power at certain speeds.
According to the NTSB, both the APU and the RAT were operating as the plane descended into the Hudson, although it was not clear whether the RAT had been deployed manually or automatically. The Airbus A320 has a "ditching" button that closes valves and openings underneath the aircraft, including the outflow valve, the air inlet for the emergency RAT, the avionics inlet, the extract valve, and the flow control valve. It is meant to slow flooding in a water landing. The flight crew did not activate the "ditch switch" during the incident. Sullenberger later noted that it probably would not have been effective anyway, since the force of the water impact tore holes in the plane's fuselage much larger than the openings sealed by the switch.
First officer Skiles was at the controls of the flight when it took off at 3:25 pm, and was the first to notice a formation of birds approaching the aircraft about two minutes later, while passing through an altitude of about 2,700 feet (820 m) on the initial climb out to 15,000 feet (4,600 m). According to flight data recorder (FDR) data, the bird encounter occurred at 3:27:11, when the airplane was at an altitude of 2,818 feet (856 m) above ground level and at a distance of about 4.5 miles north-northwest of the approach end of runway 22 at LGA. Subsequently, the airplane's altitude continued to increase while the airspeed decreased, until 3:27:30, when the airplane reached its highest altitude of about 3,060 feet (930 m), at an airspeed of about 185 kts calibrated airspeed (KCAS). The altitude then started to decrease as the airspeed started to increase, reaching 210 KCAS at 3:28:10 at an altitude of about 1,650 feet (500 m) The windscreen quickly turned dark brown and several loud thuds were heard.
Capt. Sullenberger took the controls, while Skiles began going through the three-page emergency procedures checklist in an attempt to restart the engines. At 3:27:36 the flight radioed air traffic controllers at New York Terminal Radar Approach Control (TRACON). "Hit birds. We've lost thrust on both engines. We're turning back towards LaGuardia." Responding to the captain's report of a bird strike, controller Patrick Harten, who was working the departure position told LaGuardia tower to hold all waiting departures on the ground, and gave Flight 1549 a heading to return to LaGuardia. Sullenberger responded that he was unable. Sullenberger asked if they could attempt an emergency landing in New Jersey, mentioning Teterboro Airport in Bergen County as a possibility; air traffic controllers quickly contacted Teterboro and gained permission for a landing on runway 1. However, Sullenberger told controllers that "We can't do it", and that "We're gonna be in the Hudson", making clear his intention to bring the plane down on the Hudson River due to a lack of altitude. Air traffic control at LaGuardia reported seeing the aircraft pass less than 900 feet (270 m) above GWB. About 90 seconds before touchdown, the captain announced, "Brace for impact", and the flight attendants instructed the passengers how to do so.
The plane ended its six-minute flight at 3:31 pm with an unpowered ditching while heading south at about 130 knots (150 mph; 240 km/h) in the middle of the North River section of the Hudson River roughly abeam 50th Street (near the Intrepid Sea-Air-Space Museum) in Manhattan and Port Imperial in Weehawken, New Jersey. Sullenberger said in an interview on CBS television that his training prompted him to choose a ditching location near operating boats so as to maximize the chance of rescue. After coming to a stop in the river, the plane began drifting southward with the current. National Transportation Safety Board (NTSB) Member Kitty Higgins, the principal spokesperson for the on-scene investigation, said at a press conference the day after the accident that it "has to go down [as] the most successful ditching in aviation history... These people knew what they were supposed to do and they did it and as a result, nobody lost their life".
The flight crew and particularly Captain Sullenberger were widely praised for their actions during the incident, notably by New York City Mayor Michael Bloomberg and New York State Governor David Paterson, who opined, "We had a Miracle on 34th Street. I believe now we have had a Miracle on the Hudson." Outgoing U.S. President George W. Bush said he was "inspired by the skill and heroism of the flight crew", and he also praised the emergency responders and volunteers. Then President-elect Barack Obama said that everyone was proud of Sullenberger's "heroic and graceful job in landing the damaged aircraft", and thanked the A320's crew.
The NTSB ran a series of tests using Airbus simulators in France, to see if Flight 1549 could have returned safely to LaGuardia. The simulation started immediately following the bird strike and "...knowing in advance that they were going to suffer a bird strike and that the engines could not be restarted, four out of four pilots were able to turn the A320 back to LaGuardia and land on Runway 13." When the NTSB later imposed a 30-second delay before they could respond, in recognition that it wasn't reasonable to expect a pilot to assess the situation and react instantly, all four pilots crashed. On May 4, 2010, the NTSB released a statement which credited the accident outcome to the fact that the aircraft was carrying safety equipment in excess of that mandated for the flight, and excellent cockpit resource management among the flight crew. Contributing factors to the survivability of the accident were good visibility, and fast response from the various ferry operators. Captain Sullenberger's decision to ditch in the Hudson River was validated by the NTSB. On May 28, 2010, the NTSB published its final report into the accident. It determined the cause of the accident to be "the ingestion of large birds into each engine, which resulted in an almost total loss of thrust in both engines".
Captain Sullenberger's hypothetical HCF: Sullenberger was born to a dentist father - a descendant of Swiss immigrants by the name of Sollenberger - and an elementary school teacher mother. The street, on which he grew up in Denison, Texas, was named after his mother's family, the Hannas. According to his sister, Mary Wilson, Sullenberger built model planes and aircraft carriers during his childhood, and might have become interested in flying after hearing stories about his father's service in the United States Navy. He went to school in Denison, and was consistently in the 99th percentile in every academic category. At the age of 12, his IQ was deemed high enough to join Mensa International. He gained a pilot's license at 14. In high school he was the president of the Latin club, a first chair flute, and an honor student. His high school friends have said that Sullenberger developed a passion for flying from watching jets based out of Perrin Air Force Base.
Sullenberger's hypothetical HCF is shown in Table 7. The calculations of the probability of the human non-failure are carried out using the DEPDF and are shown in Table 2. We did not try to anticipate and quantify a particular (most likely) MWL level of Capt. Sullenberger, but rather assumed different MWL deviations from the most likely level of a regular pilot. A more detailed MWL analysis can and should be conducted using flight simulation FOAT data. The computed data indicate that, as long as the HCF is high (and Capt. Sullenberger's HCF was extraordinarily, exceptionally high), even significant MWL levels, up to 50 or even higher, still result in a rather high probability of the human non-failure. This was due not only to his skills, education, training and other HCF qualities, but, to a great extent, to his age: in his late fifties, he was old enough to be an experienced performer and young enough to operate effectively in a cool demeanor under pressure and possessed other important qualities of a relatively young human.
As evident from the computed data, the probability of his non-failure in off-normal flight conditions is high, significantly higher than that of a pilot of normal skills in the profession. So, it would not be an exaggeration to say that the actual "miraculous" on-the-Hudson event was due to the fact that a person of extraordinary abilities (measured by the level of the HCF) turned out to be in the driving chair at the critical moment. Other favorable aspects of the situation were high and appropriate HCF of the crew, good weather and the ditching site, perhaps the most favorable one one could imagine. As long as this miracle did happen, everything else was not really a miracle. Captain Sullenberger knew when to take over control of the aircraft, when to abandon his communications with the (generally speaking, excellent) ATCs and to use his outstanding background and skills to ditch the plane: "I was sure I could do it...the entire life up to this moment was a preparation for this moment...I am not just a pilot of that flight. I am also a pilot who has flown for 43 years..." Miracles do not happen often, and the "Mirale-on-the-Hudson" is perhaps outside any existing indicative statistics.
Flight attendants' hypothetical HCF: The hypothetical HCF of a flight-attendant is assessed in Table 3, and the probabilities of his/her non-failure are shown in Table 8. The qualities expected from a flight-attendant are, of course, quite different of those of a pilot. As evident from the obtained data, the probability of the human non-failure of the airbus A-320 flight attendants is rather high up until the MWL ratio of 10 or even slightly higher. Although we do not try to evaluate the first officer's Skiles' HCF, we assume that his HCF is also high, although this did not manifest itself during the event.
It has been shown elsewhere [10] that it is expected that both pilots have high and, to an extent possible, equal qualifications and skills for a high probability of a mission success, if, for one reason or another, the entire MWL is taken by one of the pilots. In this connection we would like to mention that, even regardless of the qualification, it is widely accepted in the avionic and maritime practice that it is the captain, not the first officer (first mate) gets in control of a dangerous situations, especially life threatening ones. It did not happen, however, in the case of the Swiss-Air "UN-shuttle" last flight addressed in the next section.
Swiss Air Flight 111 ("UN-shuttle" flight): Crash: For the sake of comparison of the successful miracle-on-the-Hudson case with an emergency situation that ended up in a crash, we have chosen the infamous Swiss Air September 2, 1998, Flight 111, when a highly trained crew made several bad decisions under considerable time pressure that was, however, not as severe as in the miracle-on-the-Hudson case. Swissair Flight 111 was a McDonnell Douglas MD-11 on a scheduled airline flight from John F. Kennedy (JFK) International Airport in New York City, US to Cointrin International Airport in Geneva, Switzerland. On Wednesday, September 2, 1998, the aircraft crashed into the Atlantic Ocean southwest of Halifax International Airport at the entrance to St. Margaret's Bay, Nova Scotia. The crash site was just 8 km (5.0 nm) from shore. All 229 people on board died - the highest death toll of any aviation accident involving a McDonnell Douglas MD-11. Swissair Flight 111 was known as the "U.N. shuttle" due to its popularity with United Nations officials; the flight often carried business executives, scientists, and researchers.
The initial search and rescue response, crash recovery operation, and resulting investigation by the Government of Canada took over four years. The Transportation Safety Board (TSB) of Canada's official report stated that flammable material used in the aircraft's structure allowed a fire to spread beyond the control of the crew, resulting in the loss of control and crash of the aircraft. An MD-11 has a standard flight crew consisting of a captain and a first officer, and a cabin crew made up of a maître-de-cabine (M/C - purser) supervising the work of 11 flight attendants. All personnel on board Swissair Flight 111 were qualified, certified and trained in accordance with Swiss regulations, under the Joint Aviation Authorities (JAA).
The flight details are shown in Table 4. The flight took off from New York's JFK Airport at 20:18 Eastern Standard Time (EST). Beginning at 20:33 EST and lasting until 20:47, the aircraft experienced an unexplained thirteen-minute radio blackout. The cause of the blackout, or if it was related to the crash, is unknown. At 22:10 Atlantic Time (21:10 EST), cruising at FL330 (approximately 33,000 feet or 10,100 meters), Captain Urs Zimmermann and First Officer Stephan Loew detected an odor in the cockpit and determined it to be smoke from the air conditioning system, a situation easily remedied by closing the air conditioning vent, which a flight attendant did on Zimmermann's request. Four minutes later, the odor returned and now smoke was visible, and the pilots began to consider diverting to a nearby airport for the purpose of a quick landing. At 22:14 AT (21:14 EST) the flight crew made a radio call to air-traffic control (ATC) at Moncton (which handles trans-atlantics air traffic approaching or departing North American air space), indicating that there was an urgent problem with the flight, although not an emergency, which would imply immediate danger to the aircraft. The crew requested a diversion to Boston's Logan International Airport, which was 300 nautical miles (560 km) away. ATC Moncton offered the crew a vector to the closer, 66 nm (104 km) away, Halifax International Airport in Enfield, Nova Scotia, which Loew accepted. The crew then put on their oxygen masks and the aircraft began its descent. Zimmermann put Loew in charge of the descent, while he personally ran through the two Swissair standard checklists for smoke in the cockpit, a process that would take approximately 20 minutes and become a later source of controversy.
At 22:18 AT (21:18 EST), ATC Moncton handed over traffic control of Swissair 111 to ATC Halifax, since the plane was now going to land in Halifax rather than leave North American air space. At 22:19 AT (21:19 EST) the plane was 30 nautical miles (56 km) away from Halifax International Airport, but Loew requested more time to descend the plane from its altitude of 21,000 feet (6,400 m). At 22:20 AT (21:20 EST), Loew informed ATC Halifax that he needed to dump fuel, which ATC Halifax controllers would say later, was a surprise considering that the request came so late; dumping fuel is a fairly standard procedure early on in nearly any "heavy" aircraft urgent landing scenario. ATC Halifax subsequently diverted Swissair 111 toward St. Margaret's Bay, where they could more safely dump fuel, but still be only around 30 nautical miles (56 km) from Halifax. In accordance with the Swissair checklist entitled "In case of smoke of unknown origin", the crew shut off the power supply in the cabin, which caused the re-circulating fans to shut off. This caused a vacuum, which induced the fire to spread back into the cockpit. This also caused the autopilot to shut down; at 22:24:28 AT (21:24:28 EST), Loew informed ATC Halifax that "we now must fly manually." Seventeen seconds later, at 22:24:45 AT (21:24:45 EST), Loew informed ATC Halifax that "Swissair 111 heavy is declaring emergency", repeated the emergency declaration one second later, and over the next 10 seconds stated that they had descended to "between 12,000 and 5,000 feet" and once more declared an emergency. The flight data recorder stopped recording at 22:25:40 AT (21:25:40 EST), followed one second later by the cockpit voice recorder. The doomed plane briefly showed up again on radar screens from 22:25:50 AT (21:25:50 EST) until 22:26:04 AT (21:26:04 EST). Its last recorded altitude was 9,700 feet. Shortly after the first emergency declaration, the captain could be heard leaving his seat to fight the fire, which was now spreading to the rear of the cockpit. The Swissair volume of checklists was later found fused together, as if someone had been trying to use them to fan back flames.
The search and rescue operation was launched immediately by Joint Rescue Coordination Centre Halifax (JRCC Halifax) which tasked the Canadian Forces Air Command, Maritime Command and Land Force Command, as well as Canadian Coast Guard (CCG) and Canadian Coast Guard Auxiliary (CCGA) resources. The first rescue resources to approach the crash site were Canadian Coast Guard Auxiliary volunteer units - mostly privately owned fishing boats - sailing from Peggy's Cove, Bayswater and other harbors on St. Margaret's Bay and the Aspotogan Peninsula. They were soon joined by the dedicated Canadian Coast Guard SAR vessel CCGS Sambro and CH-113 Labrador SAR helicopters flown by 413 Squadron from CFB Greenwood.
The investigation identified eleven causes and contributing factors of the crash in its final report. The first and most important was: "Aircraft certification standards for material flammability were inadequate in that they allowed the use of materials that could be ignited and sustain or propagate fire. Consequently, flammable material propagated a fire that started above the ceiling on the right side of the cockpit near the cockpit rear wall. The fire spread and intensified rapidly to the extent that it degraded aircraft systems and the cockpit environment, and ultimately led to the loss of control of the aircraft".
Arcing from wiring of the in-flight entertainment system network did not trip the circuit breakers. While suggestive, the investigation was unable to confirm if this arc was the "lead event" that ignited the flammable covering on MPET insulation blankets that quickly spread across other flammable materials. The crew did not recognize that a fire had started and were not warned by instruments. Once they became aware of the fire, the uncertainty of the problem made it difficult to address. The rapid spread of the fire led to the failure of key display systems, and the crew were soon rendered unable to control the aircraft. Because he had no light by which to see his controls after the displays failed, the pilot was forced to steer the plane blindly; intentionally or not, the plane swerved off course and headed back out into the Atlantic.
Recovered fragments of the plane show that the heat inside the cockpit became so great that the ceiling started to melt. The recovered standby attitude indicator and airspeed indicator showed that the aircraft struck the water at 300 knots (560 km/h, 348 mph) in a 20 degrees nose down and 110 degree bank turn, or almost upside down. Less than a second after impact the plane would have been totally crushed, killing all aboard almost instantly. The TSB concluded that even if the crew had been aware of the nature of the problem, the rate at which the fire spread would have precluded a safe landing at Halifax even if an approach had begun as soon as the "pan-pan-pan" was declared. The plane was broken into two million small pieces by the impact, making this process time-consuming and tedious. The investigation became the largest and most expensive transport accident investigation in Canadian history.
Swiss Air Flight 111: Segments (events) and crew errors: The Swiss Air Flight 111 events (segments) and durations are summarized in Table 4. The following more or less obvious errors were made by the crew: 1) At 21:14 EST they used poor judgment and underestimated the danger by indicating to the ATC Moncton that the returned odor and visible smoke in the cockpit was an urgency, but not an emergency problem. They requested a diversion to the 300 nm (560 km) away Boston Logan Airport, and not to the closest 66nm (104 km) away Halifax Airport; 2) Captain Zimmermann put first officer Loew in charge of the descent and spent time for running through the Swissair checklist for smoke in the cockpit; 3) At 21:19 EST Loew requested more time to descend the plane from its altitude of 6,400 m, although the plane was only 30 nm (56 km) away from Halifax Airport; 4) At 21:20 EST Loew informed ATC Halifax that he needed to dump fuel. As ATC Halifax indicated later, it was a surprise, because the request came too late. In addition, it was doubtful that such a measure was needed at all; 5) At 21:24:28 the crew shut off the power supply in the cabin. That caused the re-circulating fans to shut off and caused a vacuum, which induced the fire to spread back into the cockpit. This also caused the autopilot to shut down, and Loew had to "fly manually". In about a minute or so the plane crashed. These errors are reflected in the Table 9 score sheet and resulted in a rather low HCF and low probability of the assessed human non-failure.
Swiss Air Flight 111: Pilot's hypothetical HCF: Flight 111 pilot's HCF and the probability of human non-failure are summarized in Table 9. The criteria used are the same as in Table 2 above. The probabilities of human non-failure are shown in Table 10.
The computed probability of non-failure is very low even at a non-very high MWL levels. Although the crew's qualification seems to be adequate, the qualities ##4, 6, 7, 8 and 10, which were particularly critical in the situation in question, turned out to be extremely low. No wonder that it led to a crash.
Thus, based on the above analyses, we conclude that the application of quantitative PPM approach should complement, whenever feasible and possible, the existing vehicular psychology practices that are, as a rule, qualitative assessments of the role of the human factor when addressing the likelihood of success and safety of various vehicular missions and situations.
It has been the high HCF of the aircraft crew and especially of Capt. Sullenberger's that made a reality what seemed to be a "miracle". The carried out PPM-based analysis enables one to quantify this fact. In effect, it has been a "miracle" that an outstanding individual like Capt. Sullenberger turned out to be in control at the time of the incident and that the weather was highly favorable. As long as this took place, nothing else could be considered as a "miracle": the likelihood of safe landing with an individual like Capt. Sullenberger in the cockpit was rather high. The taken PRM based approach, after the trustworthy input information is obtained using FOAT on a simulator and confirmed by an independent approach, such as, say, Delphi method, is applicable to many other HITL situations, well beyond the situation in question and perhaps even beyond the vehicular domain. Although the obtained numbers make physical sense, it is the approach, not the numbers that is, in the author's opinion, the main merit of the analysis.
Adequate trust
The double exponential probability distribution function (DEPDF) for the random HCF is revisited. It is shown particularly that the entropy of this distribution, when applied to the trustee (a human, a technology, a methodology or a concept), can be viewed as an appropriate quantitative characteristic of the propensity of a decision maker to an under-trust or an over-trust judgment and, as a consequence of that, to the likelihood of making a mistake or an erroneous decision.
Since Shakespearian "love all, trust a few" and "don't trust the person who has broken faith once" and to the today's ladygaga's "trust is like a mirror, you can fix it if it's broken, but you can still see the crack in that mother f*cker's reflection", the importance of human-human trust was addressed by numerous writers, politicians and psychologists. It was the 19th century South Dakota politician Frank Craine who seems to be the first who indicated the importance of an adequate trust in human relationships: "You may be deceived if you trust too much, but you will live in torment unless you trust enough". Madhavan and Wiegmann [125] drew attention at the importance of trust in engineering and, particularly, at similarities and differences between human-human and human-automation trust. Hoff and Bashir [123] considered the role of trust in automation. Rosenfeld and Kraus [126] addressed human decision making and its consequences, with consideration of the role of trust. The analysis that follows is in a way, an extension and a generalization of the recent Kaindl and Svetinovic [124] publication, and addresses some important aspects of the human-in-the-loop (HITL) problem for safety-critical missions and extraordinary situations. It is argued that the role and significance of trust can and should be quantified when preparing such missions. The author is convinced that otherwise the concept of an adequate trust simply cannot be effectively addressed and included into an engineering technology, design methodology or a human activity, when there is a need to assure a successful and safe outcome of a particular engineering effort or an aerospace or a military mission. Since nobody and nothing is perfect, and the probability-of-failure is never zero, such a quantification should be done on the probabilistic basis [117,130-132,135,137,138,152]. The DEPDF for the random HCF (Suhir, 2017) is revisited with an intent to show that the entropy of this distribution, when applied to the trustee, can be viewed as an appropriate quantitative characteristic of the propensity of a human to an under-trust or an over-trust.
A suitable modification of the DEPDF for the human non-failure, whether it is the performer (decision maker) or the trustee, is assumed here in the following simple form
Where is the probability of non-failure, is time, is the HCF, is the MWL, and is the sensitivity factor for the time. The expression for the probability of non-failure makes physical sense. Indeed, the probability of human non-failure, when fulfilling a certain task, decreases with an increase in time and increases with an increase in the HCF-to-the-MWL ratio. At the initial moment of time the probability of non-failure is and exponentially decreases with time, especially for low ratios. For very large HCF-to-the-MWL ratios the probability of non-failure is also significant, even for not-very short operation times. The above expression, depending on a particular task and application, could be applied either to the performer (the decision maker) or to the trustee. The trustee could be a human, a technology, a concept, an existing best practice, etc.
The ergonomics underlying the accepted distribution could be seen from the time derivative where is the entropy of the distribution. The formula for the time derivative of the probability of non-failure indicates that the distribution reflects an assumption that this derivative is proportional to the entropy of this distribution and decreases with an increase in time. As to the expression , it sheds some useful quantitative light on the recommendation [125] that both under-trust and over-trust should be avoided. The entropy , when applied to the suggested DEPDF and viewed in this case as the probability of non-failure of the trustee's performance, is zero for both extreme values of this performance: when the probability of non-failure is zero, it should be interpreted as an extreme under-trust in someone else's authority or expertise, or in the case of a "not invented here (NIH)" technology; when the probability of the trustee's non-failure is one, that means that there is an extreme over-trust in an NIH technology: as is known, "my neighbor's grass is always greener" and "no man is a prophet in his own land". The entropy reaches its maximum value for a rather moderate probability of non-failure of the trustee. In the light of the publication [124], adequate trust should also be considered, when appropriate, among other critical HCF qualities, and should be certainly added to the above list. Captain Sullenberger, the hero of the miracle-on-the-Hudson event did possess such a quality. He "avoided over-trust":
1) In the ability of the first officer, who ran the aircraft when it took off La Guardia airport, to successfully cope with the situation, when the aircraft struck a flock of Canada Geese and lost engine power, and took over the controls, while the first officer began going through the emergency procedures checklist in an attempt to find information on how to restart the engines; and
2) In the possibility, with the help of the air traffic controllers at laguardia and at Teterboro, to land the aircraft safely at these airports. What is even more important, is that Captain Sullenberger also "avoided under-trust" (as FDR has put it, "the only thing that we should fear, is fear itself"):
1) In his own skills, abilities and extensive experience that would enable him to successfully cope with the situation (57-year-old Capt. Sullenberger was a former fighter pilot, a safety expert, an instructor and a glider pilot); that was the rare case when "team work" was not the right thing to pursue;
2) In the aircraft structure that would be able to successfully withstand the slam of the water during ditching and, in addition, would enable slow enough flooding after ditching (it turned out that the crew did not activate the "ditch switch" during the incident, but Capt. Sullenberger later noted that it probably would not have been effective anyway, since the water impact tore holes in the plane's fuselage much larger than the openings sealed by the switch);
3) In the aircraft safety equipment that was carried in excess of that mandated for the flight;
4) In the outstanding cooperation and excellent cockpit resource management among the flight crew who trusted their captain and exhibited outstanding team work (that is where such work was needed and was useful) during landing and the rescue operation;
5) In the fast response from and effective help of the various ferry operators located near the USS Intrepid museum and the ability of the rescue team to provide timely and effective help; and
6) In the good visibility as an important contributing factor to the success of his effort. As is known, the crew was later awarded the Master's Medal of the Guild of Air Pilots and Air Navigators for successful "emergency ditching and evacuation, with the loss of no lives... a heroic and unique aviation achievement...the most successful ditching in aviation history."
National Transportation Safety Board (NTSB) Member Kitty Higgins, the principal spokesperson for the on-scene investigation, said at a press conference the day after the accident that it "has to go down [as] the most successful ditching in aviation history... These people knew what they were supposed to do and they did it and as a result, nobody lost their life".
Note that the probability of non-failure for the given HCF and MWL can be obtained from the adequately designed, thoroughly conducted and correctly interpreted FOAT data. Let us show how this could be done, using as an example, the role of the human factor in aviation. Flight simulator could be employed as an appropriate FOAT vehicle to quantify, on the probabilistic basis, the required level of the human capacity factor (HCF) with respect to the expected mental workload (MWL) when fulfilling a particular mission. When designing and conducting FOAT aimed at the evaluation of the sensitivity parameter in the DEPDF a certain MWL factor (electro-cardiac activity, respiration, skin-based measures, blood pressure, ocular measurements, brain measures, etc.) should be monitored and measured on the continuous basis until its agreed-upon high value , viewed as an indication of a human failure, is reached . Then the DEPDF could be written as
Bringing together a group of more or less equally (preferably highly) qualified individuals, and proceeding from the fact that the HCF is a characteristic that remains more or less unchanged for these individuals during the relatively short time of the FOAT. The MWL, on the other hand, is a short-term characteristic that can be tailored, in many ways, depending on the anticipated MWL conditions. From the expression for the DEPDF we have:
where
Let the FOAT is conducted at two MWL levels, and , and the criterion was observed and recorded at the times of and for the established percentages of and , respectively. Then the formula
for the value can be obtained. The HCF of the individuals that underwent the accelerated testing can be determined as follows:
Let, e.g., the same group of individuals was tested at two different MWL levels, and , until failure (whatever its definition and nature might be), and let the MWL ratio was Because of that the TTF was considerably shorter and the number of the failed individuals was considerably larger, for the same level (say, in the second round of tests. Let, e.g., and Then
The calculated required HCF-to-MWL ratios
for different probabilities of non-failure and different times are shown in Table 11. As evident from the calculated data, the level of the HCF in this example should exceed considerably the level of the MWL, so that a high enough value of the probability of human-non-failure is achieved, especially for long operation times.
The following conclusions can be drawn from the performed analysis:
1) Trust is an important HCF quality and should be included into the list of such qualities for a particular HCF related task;
2) This factor should always be evaluated vs. MWL when there is a need to assure a successful and safe outcome of a particular aerospace or military mission, or when considering the role of a human factor in a non-vehicular engineering system;
3) The DEPDF for the random HCF is revisited, and it is shown particularly that its entropy can be viewed as an appropriate quantitative characteristic of the propensity of a human to an under-trust or an over-trust judgment and, as the consequence of that, to an erroneous decision making or to a performance error.
Human-in-the-Loop (HITL) related missions and situations
Vehicular mission success-and-safety
The success (failure) of a vehicular mission could be time dependent and, in addition, could have different probabilities of success at different stages (segments). Let, e.g., the mission of interest consists of consecutive segments that are characterized by different probabilities, , of occurrence of a particular harsh environment or by other extraordinary conditions during the fulfillment of the th segment of the mission; by different durations, , of these segments; and by different failure rates, , of the equipment and instrumentation. These failure rates may or may not depend on the environmental conditions, but could be affected by aging, degradation and other time-dependent causes. In the simplified example below we assume that the combined input of the hardware and the software, as far as the failure rate of the equipment and instrumentation is concerned, is evaluated beforehand and is adequately reflected by the appropriate failure rate (failure rate of the equipment) values. These values could be either determined from the vendor specifications or could be obtained based on the specially designed and conducted FOAT and the subsequent predictive modeling. The probability of the equipment non-failure at the moment of time during the flight (mission fulfillment) on the th segment, assuming, in an approximate analysis, that Weibull distribution in the form , is applicable. Here is an arbitrary moment of time during the fulfillment of the mission on the th segment, and is the shape parameter in the Weibull distribution. This distribution is flexible: leads to the exponential distribution; when , Rayleigh distribution takes place; by putting , one obtains a distribution that is close to the normal distribution. We assume that the time-dependent probability of the human performance non-failure can be also represented as a Weibull distribution: , where is the failure rate, is the shape parameter and is the probability of the human non-failure at the initial moment of time of the given segment. When , the probability of non-failure (say, because of the human fatigue or other causes) tends to zero. The probability of non-failure at the initial moment of time is
Then the probability of the mission failure at the th segment can be found as
Since (condition of normalization), the overall probability of the mission failure can be found as
This formula can be used for the assessment of the probability of the overall mission failure, as well as, if necessary, for specifying the failure rates and the HCF in such a way that the probability of failure, when a human is involved, would be sufficiently low and acceptable. It can be used also, if possible, to choose an alternative route in such a way that the set of the probabilities brings the overall probability of failure of the mission to the acceptable level. If at a certain segment of the fulfillment of the mission the human performance is not critical, then the corresponding probability of human non-failure should be put equal to one. On the other hand, if there is confidence that the equipment (instrumentation) failure is not critical, or if there is a reason to believe that the probability of the equipment non-failure is considerably higher than the probability of the human non-failure, then it is the probability that should be put equal to one. Finally, if one is confident that a certain level of the harsh environment will be certainly encountered during the fulfillment of the mission at the th segment of the route, then the corresponding probability should be put equal to one.
Failure rate of the equipment (instrumentation) should be established, of course, based on the reliability physics of the particular underlying phenomenon. Examine, as suitable examples, two typical situations. 1) If the possible failure of the vulnerable structural element of a particular piece of equipment, device or a subsystem could be attributed to an elevated temperature and stress, then the BAZ law
can be used to assess the mean-time-to-failure . In this formula, is the absolute temperature, is the activation energy, is Boltzmann's constant, is the design stress (not necessarily mechanical) acting in the item of interest, and and are empirical parameters that should be established (found) based on the specially designed and conducted ALTs. Actually, the activation energy is also an empirical parameter, but, for various structural elements of silicon-based semiconductor electronic devices the activation energies have been determined and could be found in the reference literature . The second term in the numerator of the above formula accounts for the reduction in the activation energy level in the presence of a stress. If stress is not considered, the above formula reduces to the well-known Boltzmann-Arrhenius equation. After the mean-time-to-failure is determined, the corresponding failure rate can be found as
where
is the steady-state probability of failure in ordinary conditions, i.e., at the steady-state portion of the BTC. By analogy with how the failure rate for a piece of electronic equipment is determined, one could use the condition (12) to establish an ALT relationship for the human performance. We view the process of testing and training of a human on a simulator as a sort of an ALT setup for a vehicle operator. For , for a human of the ordinary skills in the vehicular "art", the following relationship can be assumed for the probability of non-failure, when a navigator is being tested or trained on a flight simulator: . Then the probability of human failure is
and the MTTF is
This formula can be employed to run a FOAT procedure on a simulator, using the elevated MWL level as the stimulus factor, to the same extent as the elevated absolute temperature is used to accelerate failures in electronics hardware. The parameters , and should be viewed as empirical parameters that could be determined as a result of testing at different MWL levels for many individuals and by evaluating the corresponding mean-time-to-failure . Note, that as far as steady-state condition is concerned, we use the simplest, exponential, distribution for the evaluation of the probability , while in our general mission-success-and-safety concept, we use a more general and more flexible Weibull distribution. Since there are three experimental parameters in the above relationship that have to be determined, one needs three independent equations to determine these parameters. If the tests on a simulator are being conducted for three groups of individuals at three MWL levels , and and the performance of these individuals is measured by recording the three times-to-failure, and then the value can be obtained from the following transcendental equation:
One could easily check that this equation is always fulfilled for . It is noteworthy that, as has been determined above, testing does not (and should not) be conducted for MWL levels essentially higher than three-fold higher than the normal MWL is, otherwise a "shift" in the modes of failure and misleading results are likely. In other words, the accelerated test conditions should be indeed accelerated ones, and have to be reasonably high, but should not be unrealistically and unreasonably high. We are all still human, not superhuman, and, even an experienced, young, yet mature, competent and well trained individual (say, of Captain Sullenberger type) cannot cope with an exceptionally high workload. After the normal (most likely) MWL is evaluated, the probability of non-failure at normal MWL conditions can be evaluated as
and the time is
As evident from the above formulas, the value can be found in a single way, the value can be found in two ways, and the value can be found in three ways. This circumstance should be used to check the accuracy in determining these values. On the other hand, for the analysis based on the above equations, only the value is needed. We would like to point out also that, although minimum three levels of the MWL are needed to determine the parameters , and , it is advisable that tests at more MWL levels (still within the range ) are conducted, so that the accuracy in the prediction could be assessed. After the parameters , and are found, the failure rate can be determined as a function of the MWL level as
The nominal failure rate is therefore
PPM of mission safety
We use the Weibull law to evaluate the time effect (aging, degradation) on the performance of both the equipment (instrumentation), considering the combined effect of the hardware and software, and the "human-in-the-loop". It is a two-parametric distribution with the probability distribution function , where the failure rate is related to the scale parameter of the distribution as , and the mean-time-to-failure and the standard deviation of the time-to-failure can be found as
where is the gamma-function. The probability density distribution function can be obtained, if needed, as
Let, for instance, the duration of a particular vehicular mission be 24 hours, and the vehicle spends equal times at each of the 6 segments (so that hours at the end of each segment), the failure rates of the equipment and the human performance are independent of the environmental conditions and are 1/hour, the shape parameter in the Weibull distribution in both cases is (Rayleigh distribution), the HCF ratio is (so that ), the probability of human non-failure at ordinary conditions is , and the MWL ratios are given vs. the probability of occurrence of the environmental conditions in Table 12. The Table 12 data presumes that about 95% of the mission time occurs in ordinary conditions. The computations of the probabilities of interest are also carried out in Table 12. We obtain the probability of the equipment non-failure as
and the probability of the human non-failure can be found as
and is the probability of the mission non-failure. The overall probability of mission failure is therefore
Some short-term tasks
The above concept is suitable for the design of the hardware and the software, for making long-term assessments and strategic decisions, and for planning a certain vehicular mission before this mission actually commences. There are, however, extraordinary situations, when the navigator has to make a decision on a short-term, some time even on an emergency, basis during the actual fulfillment of a mission or when encountering an extraordinary hazardous situation. Here are several examples that have also to do with the application of PPM methods to quantify the effect of the human-equipment-environment interaction.
Problem #1: The probability that the particular environmental conditions will be detrimental for the vehicle safety (say, the probability of exceeding a certain probability level) is p. The probability that these environmental conditions are detected by the available navigation equipment (say, radar or LiDAR), adequately processed and delivered to the navigator in due time is But the navigator is not perfect either, and the probability that he/she misinterprets the obtained information from the navigation instrumentation is If this happens, the navigator can either launch a false alarm (take inappropriate and unnecessary corrective actions), or conclude that the weather conditions are acceptable and make inappropriate go-ahead decision. The navigator receives n messages from the navigation equipment during his watch. What is the probability that at least one of the messages is assessed incorrectly?
Solution. The hypotheses about a certain message are: = The weather conditions are unacceptable, so that the corrective actions are necessary; = The weather conditions are acceptable and therefore no corrective actions are needed. The probability that a message is misinterpreted is Then the probability that at least one message out of is misinterpreted is . Clearly, , when . The above formulas indicate that the outcome depends on both the equipment (instrumentation) performance and the human ability to correctly interpret the obtained information. The obtained formula can be used particularly to assess the effect of the human fatigue on his/her ability to interpret correctly the obtained messages. Let, for instance, (the navigator receives 100 messages during his/her watch) and : the forecast environmental conditions that the vehicle will encounter will certainly cause an accident and should be avoided. So, the instrumentation did not fail, and the probability that the navigator obtained this information and that the information has been delivered in a timely fashion is = 0.999. Let the probability that the navigator interprets the information incorrectly is, say, just . Then P = 0.001 and Q = 0.0952. Thus, the probability that one message could be misinterpreted is as high as 9.5%. If the equipment is not performing adequately and the probability is only, say, = 0.95, then P = 0.05 and Q = 0.9941: one of the messages from the navigation equipment will be most certainly misinterpreted. Thus, the performance and the accuracy of the instrumentation are as important as the human factor is.
Problem # 2: The probability that the instrumentation does not fail during the time T of the fulfillment of a certain segment of a mission is . The probability that the human does not fail, i.e., receives and interprets the obtained information correctly during this time is It has been established that a certain (non-fatal though) accident has occurred during the time of the fulfillment of this segment of the mission. What is the probability that the accident occurred because of the equipment failure?
Solution: Four hypotheses were possible before the accident actually occurred: = the equipment did not fail and the human did not make any error; = the equipment failed, but no human error occurred; = the equipment did not fail, but the human made an error; = the equipment failed and the human made an error. The probabilities of these hypotheses are: . and the conditional probabilities of the event A "the accident occurred" are:
and . By applying Bayes' formula
we obtain the following expression for the probability that only the equipment failed:
Clearly, if the equipment never fails , then . On the other hand, if the equipment is very unreliable , then : the probability that the equipment fails is equal to the probability that the operator did not make an error. If the probabilities and are equal then is the probability that either the equipment failed or the human made an error. For very reliable equipment and a next-to-perfect operator (human) , the probability that only the equipment failed is 0.5. For very unreliable equipment and very "imperfect" human we obtain : it is quite likely that both the equipment failed and the human made an error.
Problem #3: The assessed probability that a certain segment of a mission will be accomplished successfully, provided that the environmental conditions are favorable, is This probability will not change even in unfavorable environmental conditions, if the navigation equipment is adequate and functions properly. If, however, the equipment (instrumentation) is not perfect, then the probability of safe fulfillment of the given segment of the mission is only It has been established that the probability of failure-free functioning of the navigation equipment is It is known also that in this region of the navigation space unfavorable navigation conditions are observed at the given time of the year in k% of the time. What is the probability of the successful accomplishment of the mission in any environmental conditions? What is the probability that the navigator used the equipment, if it is known that the mission has been accomplished successfully?
Solution. The probability of the hypothesis "the environmental conditions are favorable" is The probability of the hypothesis "the environmental conditions are unfavorable" is The conditional probability of the event A "the navigation is safe" when the environmental conditions are favorable is The conditional probability of the event A "the navigation is safe" when the environmental conditions are unfavorable can be determined as so that the expression
determines the probability of accident-free navigation on the given segment. If it is known that the mission has been accomplished successfully despite unfavorable environmental conditions, then the probability of accident-free navigation on the given segment is
Let, e.g., Then So, the probability of the successful accomplishment of the mission is 0.9992, and the probability that the navigator used the instrumentation/equipment that enabled him/her to accomplish the mission successfully is 0.7998, otherwise the mission would have failed.
Problem #4: The values for the wave conditions in North Atlantic in the region between 50° and 60° North Latitude are shown in Table 13 vs. wave heights of 3% significance (wave heights of 3% significance means that 97% of the waves are characterized by the heights below the level, and 3% have the height exceeding this level):
Two sources of information predict a particular value at the next segment of the route with different probabilities and What is the likelihood that the first source is more trustworthy than the second one?
Solution: Let A be the event "the first forecaster is right", be the event "the first forecaster is wrong", B be the event "the second forecaster is right", and be the event "the second forecaster is wrong". So, we have and Since the two forecasters (sources) made different predictions, the event took place. The probability of this event is
The first forecaster will be more trustworthy if the event takes place. The probability of this event is
This relationship is computed in Table 14. Clearly, if if and if and Other Table 14 data are not counter-intuitive either, but this table quantifies the role of the two mutually exclusive forecasts.
Most likely MWL
Cognitive overload has been recognized as a significant cause of error in aviation, and therefore measuring the MWL has become a key method of improving safety. There is an extensive published work in the psychological literature devoted to the measurement of MWL, both in military and in civil aviation (see, e.g., [110-118]). A pilot's MWL can be measured using subjective ratings or objective measures. The subjective ratings during simulation tests can be in the form of periodic inputs to some kind of data collection device that prompts the pilot to enter a number between 1 and 7 (for example) to estimate the MWL every few minutes. Another possible approach is post-flight paper questionnaires. There are some objective measures of MWL, such as heart rate variability. It is easier to measure the MWL in a flight simulator than in actual flight conditions. In a real airplane, one would probably be restricted to using post-flight subjective (questionnaire) measures, since one would not want to interfere with the pilot's work.
An aircraft pilot faces numerous challenges imposed by the need to control a multivariate lagged system in a heterogeneous multitask environment. The time lags between critical variables require predictions and actions in an uncertain world. The interrelated concepts of situation awareness and MWL are central to aviation psychology. The major components of situation awareness are spatial awareness, system awareness, and task awareness. Each of these three components has real-world implications: spatial awareness - for instrument displays, system awareness - for keeping the operator informed about actions that have been taken by automated systems, and task awareness - for attention and task management. Task management is directly related to the level of the mental workload, as the competing "demands" of the tasks for attention might exceed the operator's resources - his/her "capacity" to adequately cope with the "demands" imposed by the MWL. In modern military aircraft, complexity of information, combined with time stress, creates difficulties for the pilot under combat conditions, and the first step to mitigate this problem is to measure and manage MWL. Although there is no universally accepted definition of the MWL and how it should/could be evaluated, there is a consensus that suggests that MWL can be conceptualized as the interaction between the structure of systems and tasks, on the one hand, and the capabilities, motivation and state of the human operator, on the other. More specifically, MWL could be defined as the "cost" that an operator incurs as tasks are performed. Given the multidimensional nature of MWL, no single measurement technique can be expected to account for all the important aspects of it. Current research efforts in measuring MWL use psycho-physiological techniques, such as electroencephalographic, cardiac, ocular, and respiration measures in an attempt to identify and predict MWL levels. Measurement of cardiac activity has been a useful physiological technique employed in the assessment of MWL, both from tonic variations in heart rate and after treatment of the cardiac signal.
Most likely HCF
The HCF includes the person's professional experience; qualifications; capabilities; skills; training; sustainability; ability to concentrate; ability to operate effectively, in a "tireless" fashion, under pressure, and, if needed, for a long period of time; ability to act as a "team-player;" swiftness of reaction, i.e., all the qualities that would enable him/her to cope with high MWL. In order to come up with a suitable FOM for the HCF, one could rank each of the above and other qualities on a scale from one to ten, and calculate the average FOM for each individual.
Future work
The author realizes that the PPM approach, which has proven to be successful in numerous structural reliability problems, including aviation technologies, might not be accepted easily by some psychologists. Some of them may feel that the problem is too complex to lend itself to this type of formalized quantification and might even challenge the approach. With this in mind we would like to suggest several possible next steps (future work) that could be conducted using, when necessary, flight simulators to correlate the accepted DEPDF with the existing practice and to make this distribution applicable for the evaluation of the roles of the MWL and HCF in particular navigation situations.
Aviation psychologists do not normally measure HCF as a single, unitary quantity. They might estimate the navigator's ability to handle stress, or test his/her reaction time, or ability to visually detect targets out the window, etc. These are all separate parameters that improve the pilot's ability to handle workload. It is important, however, that all these parameters, as well as some more permanent factors, like the pilot's qualifications; general professional experience and skills; performance sustainability; ability to concentrate; ability to make adequate and prudent decisions in conditions of uncertainty; etc. are also considered in a unified HCF. It is mandatory, of course, that such a unified HCF is task specific and is measured in the same units as the MWL is, otherwise the "stress"-"strength" model could not be used. These units could be particularly dimensionless, but should be established for a particular mission or task in advance. In addition, HCF has to be multivariate and "dynamic", taking into account "static" factors, such as operator's training, experience, native ability, as well as "dynamic" factors, such as fatigue and arousal. For instance, evidence points to elevated levels of air traffic controller operational errors at both low and high-task-demand-levels (i.e., more of a Yerkes-Dodson non-monotonic response), as well as possibly on the downslope after a period of peak arousal. Thus, one might be needing to model the first and even the second time-derivatives of arousal of workload to fully capture all the important effects. Other, perhaps, less challenging tasks might include:
1) Testing to evaluate the effect of the fatigue state of the pilot on the effectiveness of his/her performance: there are cognitive test methodologies that can assess alertness;
2) Carrying out continuous MWL measurements using subjective and/or psycho-physiological measures;
3) Assessing the role of the aircraft type and the effectiveness of automation: more automation will make the pilot's job easier, in most cases, but might not be always available or affordable;
4) Evaluating the role of weather conditions that might affect the MWL, and might have an effect on the HCF as well;
5) Assessing the role of the "phase of flight." Since descent and landing are characterized by the highest level of MWL, the developed formulas should be applied and verified for these conditions. It is the authors' belief that it could be indeed applicable to such conditions, although we did not consider them specifically and directly in this paper. Particularly, complexity of the airport and air traffic situation might have an effect on the MWL: more complexity certainly means more MWL for the pilot to manage;
6) Categorizing the types of errors/outcomes (again, typical and possible errors, not mistakes or blunders: these are beyond any PRM analysis) that might occur. One should determine ahead of time which kind of deviations of normal conditions and what kind of errors/outcomes he/she is interested in. Catastrophic loss of an aircraft usually results from a series of failures - deviations from normal conditions that might lead to a casualty, an unrecoverable situation. There was probably no reported loss of a commercial aircraft because one of the pilots was incapacitated, and our analysis has indicated that. Indeed, such an outcome would be rather unlikely, unless the pilot-in-charge is very bad and the probability that he/she fails even in normal operation conditions is next-to-one. In this connection we would like to point out again that the addressed example is just an illustration of one of the possible applications of the basic relationship (1). This relationship might have many more applications in vehicular technology, and, as far as the aerospace industry is concerned, might be applicable, after appropriate modification and generalization, not only to address (less critical) en-route situations, but landing situations as well.
7) Use the model to compare the performance of different pilots (MCF) for different MWL levels. Of course, even a significant deviation from normal conditions does not necessarily lead to a casualty, and our models were able to quantify this circumstance. Additional insight is needed, however, to correctly design and adequately interpret the results of the tests in a flight simulator. In this connection it would be interesting to compare the accelerated life test (ALT) and highly accelerated life tests (HALTs) in hardware electronics with what could be expected from the flight simulation tests.
Summary
A DEPDF of the extreme value distribution (EVD) type is introduced to characterize and to quantify the likelihood of a human failure to perform his/her duties when operating a vehicle (a car, an aircraft, a boat, etc.). This function is applied to assess a mission success situation. We have shown how some methods of the classical probability theory could be employed to quantify the role of the human factor in the situation in question. We show that if highly reliable equipment is used, the mission could be still successful, even if the HCF is not very high. The suggested probabilistic risk management (PRM) approach complements the existing system-related and human-psychology-related efforts, and, most importantly, bridges the gap between the three critical areas responsible for the system performance - reliability engineering, vehicular technologies and human factor. Plenty of additional PRM analyses and human-psychology related effort will be needed, of course, to make the guidelines based on the suggested concept practical for particular applications. These applications might not be even necessarily in the vehicular technology domain, but in many other areas and systems (forensic, medical, etc.), where a human interacts with equipment and instrumentation, and operates in conditions of uncertainty. Although the approach is promising and fruitful, further research, refinement, and validation would be needed, of course, before the model could become practical. The suggested model, after appropriate sensitivity analysis is carried out, might be used when developing guidelines for personnel training and/or when there is a need to decide if the existing navigation instrumentation is adequate in extraordinary safety-in-air situations, or if additional and/or more advanced equipment should be developed and installed. The initial numerical data based on the suggested model make physical sense and are in satisfactory (qualitative) agreement with the existing practice. It is important to relate the model expressed by the basic DEPDF equation to the existing practice, on one hand, and to review the existing practice from the standpoint of this model on the other.
References
- D Donahoe, K Zhao, S Murray, et al. (2008) Accelerated life testing. Encyclopedia of Quantitative Risk Analysis and Assessment, John Wiley & Sons.
- R Sorensen (2015) Accelerated life testing. Sandia National Laboratories.
- PA Hancock, T Mihaly, M Rahimi, et al. (1988) A bibliographic listing of mental workload research. Advances in Psychology 52: 329-333.
- D Hamilton, C Bierbaum (1990) Task analysis/workload (TAWL)-A methodology for predicting operator workload. Proc. of the Human Factors and Ergonomics Society Annual Meeting 34.
- PA Hancock, JK Caird (1993) Experimental evaluation of a model of mental workload. Human Factors: The Journal of the Human Factors and Ergonomics Society 35.
- MR Endsley (1995) Toward a theory of situation awareness in dynamic systems. Human Factors: The Journal of the Human Factors and Ergonomics Society 37.
- KA Ericsson, W Kintsch (1995) Long term working memory. Psychological Review 102: 211-245.
- MR Endsley, DJ Garland (2000) Situation awareness analysis and measurement. Lawrence Erlbaum Associates, Mahwah, NJ.
- C Lebiere (2001) A theory based model of cognitive workload and its applications. Proc of the Interservice/Industry Training, Simulation and Education Conf, NDIA, Arlington, VA.
- A Kirlik (2003) Human factors distributes its workload. In: E Salas, Advances in human performance and cognitive engineering research. vol.1. Contemporary Psychology.
- DE Diller, KA Gluck, YJ Tenney, et al. (2005) Comparison, convergence, and divergence in models of multitasking and category learning, and in architectures used to create them. In: Gluck KA, Pew RW, Modeling human behavior with integrated cognitive architectures. Lawrence Erlbaum Associates, Mahwah, NJ.
- E Suhir (2020) The outcome of an engineering undertaking of importance must be quantified to assure its success and safety: Review. J Aerosp Eng Mech 4: 218-252.
- SN Zhurkov (1984) Kinetic concept of the strength of solids. Int J Fracture Mechanics 26: 295-307.
- E Suhir (1985) Linear and nonlinear vibrations caused by periodic impulses. AIAA/ASME/ASCE/AHS 26th Structures, Structural Dynamics and Materials Conference, Orlando, Florida.
- E Suhir, B Poborets (1990) Solder glass attachment in cerdip/cerquad packages: Thermally induced stresses and mechanical reliability. 40th Conference Proceedings on Electronic Components and Technology.
- E Suhir, RC Cammarata, DDL Chung, et al. (1991) Mechanical behavior of materials and structures in microelectronics. Materials Research Society, USA.
- E Suhir (1997) Probabilistic approach to evaluate improvements in the reliability of chip-substrate (Chip-Card) assembly. IEEE CPMT Transactions.
- E Suhir, M Fukuda, CR Kurkjian (1998) Reliability of photonic materials and structures. Materials Research Society Symposia Proceedings.
- E Suhir (1998) The future of microelectronics and photonics and the role of mechanics and materials. ASME J Electr Packaging (JEP).
- E Suhir (2005) Reliability and accelerated life testing. Semiconductor International.
- E Suhir (2008) Analytical thermal stress modeling in physical design for reliability of micro- and opto-electronic systems: Role, attributes, challenges, results. Micro- and Opto-Electronic Materials and Structures: Physics, Mechanics, Design, Packaging, Reliability.
- E Suhir (2008) How to make a device into a product: Accelerated life testing it's role, attributes, challenges, pitfalls, and interaction with qualification testing. Micro- and Opto-Electronic Materials and Structures: Physics, Mechanics, Design, Packaging, Reliability.
- E Suhir, CP Wong, YC Lee (2008) Micro- and opto-electronic materials and structures: Physics, mechanics, design, reliability, packaging. Springer.
- E Suhir (2009) Analytical thermal stress modeling in electronic and photonic systems. ASME App Mech Reviews invited paper 62.
- E Suhir (2010) Probabilistic design for reliability. Chip Scale Reviews 14.
- E Suhir, R Mahajan (2011) Are Current Qualification Practices Adequate? Circuit Assembly.
- E Suhir, DS Steinberg, TX Yu (2011) Structural dynamics of electronic and photonic systems. John Wiley, Hoboken, NJ.
- E Suhir (2011) Linear and nonlinear vibrations caused by periodic impulses. In: E Suhir, DS Steinberg, TX Yu, Structural dynamics of electronic and photonic systems, John Wiley, Hoboken, NJ.
- E Suhir (2011) Random vibrations of structural elements in electronic and photonic systems. In: E Suhir, DS Steinberg, TX Yu, Structural dynamics of electronic and photonic systems. John Wiley, Hoboken, NJ.
- E Suhir (2011) Dynamic response of micro-electronic systems to shocks and vibrations: Review and extension. In: E Suhir, DS Steinberg, TX Yu, Structural dynamics of electronic and photonic systems. John Wiley, Hoboken, NJ.
- E Suhir, D Steinberg, T Yi (2011) Dynamic response of electronic and photonic systems to shocks and vibrations. John Wiley.
- E Suhir (2011) Remaining useful lifetime (RUL): Probabilistic predictive model. Int J of PHM.
- E Suhir (2011) Thermal stress failures: Predictive modeling explains the reliability physics behind them. IMAPS Advanced Microelectronics 38.
- E Suhir (2011) Predictive modeling of the dynamic response of electronic systems to shocks and vibrations. ASME Appl Mech Reviews 63.
- E Suhir (2011) Analysis of the prestressed bi-material accelerated life test (ALT) specimen. ZAMM 91: 371-385.
- E Suhir, R Mahajan, A Lucero, et al. (2012) Probabilistic design for reliability (PDfR) and a novel approach to qualification testing (QT). 2012 IEEE/AIAA Aerospace Conf., Big Sky, Montana, USA.
- E Suhir (2012) When reliability is imperative, ability to quantify it is a must. IMAPS Advanced Microelectronics.
- E Suhir, L Bechou, A Bensoussan (2012) Technical diagnostics in electronics: Application of bayes formula and boltzmann-arrhenius-zhurkov model. Printed Circuit Design& Fab/Circuits Assembly 29: 25-28.
- E Suhir, S Kang (2013) Boltzmann-arrhenius-zhurkov (BAZ) model in physics-of-materials problems. Modern Physics Letters B 27.
- E Suhir (2013) How long could/should be the repair time for high availability? Modern Physics Letters B (MPLB) 27.
- E Suhir (2013) Could electronics reliability be predicted, quantified and assured? Microelectronics Reliab 53: 925-936.
- E Suhir (2013) Structural Dynamics of Electronics Systems. Modern Physics Letters B (MPLB) 27.
- E Suhir, L Bechou, A Bensoussan, et al. (2013) Photovoltaic reliability engineering: Qualification testing (QT) and probabilistic design-for-reliability (PDfR) concept. invited presentation, SPIE PV Reliability Conference, San Diego, CA.
- A Bensoussan, E Suhir (2013) Design-for-reliability (DfR) of aerospace electronics: Attributes and challenges. IEEE Aerospace Conference, Big Sky, Montana, USA.
- E Suhir (2013) Assuring aerospace electronics and photonics reliability: What could and should be done differently. IEEE Aerospace Conference, Big Sky, Montana, USA.
- E Suhir (2013) Predicted reliability of aerospace electronics: Application of two advanced probabilistic techniques. IEEE Aerospace Conference, Big Sky, Montana, USA.
- E Suhir, L Bechou (2013) Availability index and minimized reliability cost. Circuit Assemblies.
- E Suhir (2013) Failure-oriented-accelerated testing (FOAT), and its role in making a viable IC package into a reliable product. Circuit Assembly.
- E Suhir, A Bensoussan (2014) Quantified reliability of aerospace optoelectronics. SAE Int J Aerosp 7: 65-73.
- E Suhir (2014) Three-step concept in modeling reliability: Boltzmann-arrhenius-zhurkov physics-of-failure-based equation sandwiched between two statistical models. Microelectronics Reliability.
- E Suihir (2014) Fiber optics engineering: Physical design for reliability. Facta Universitatis: series Electronics and Energetics 27.
- E Suhir (2014) Statistics- and reliability-physics-related failure processes in electronics devices and products. Modern Physics Letters B (MPLB) 28.
- E Suhir (2014) Reliability physics and probabilistic design for reliability (PDfR): Role, attributes, challenges. EPTC, Singapore.
- E Suhir, A Bensoussan (2014) Quantified reliability of aerospace optoelectronics. SAE Aerospace Systems and Technology Conference, Cincinnati, OH, USA.
- E Suhir, A Bensoussan (2014) Application of multi-parametric BAZ model in aerospace optoelectronics. 2014 IEEE Aerospace Conference, Big Sky, Montana, USA.
- E Suhir, A Bensoussan, J Nicolics, et al. (2014) Highly accelerated life testing (HALT), failure oriented accelerated testing (FOAT), and their role in making a viable device into a reliable product. 2014 IEEE Aerospace Conference, Big Sky, Montana, USA.
- D Gucik-Derigny, A Zolghadri. L Bechou, et al. (2014) Prediction of remaining useful life (RUL) of ball-grid-array (BGA) interconnections during testing on the board level. 2014 IEEE Aerospace Conference, Big Sky, Montana, USA.
- E Suhir (2014) Failure-Oriented-Accelerated-Testing (FOAT) and its role in making a viable package into a reliable product. SEMI-TERM 2014, San Jose, CA.
- D Gucik-Derigny, A Zolghadri, E Suhir, et al. (2014) A model-based prognosis strategy for prediction of remaining useful life of ball-grid-array interconnections. IFAC Proceedings Volumes 47: 7354-7360.
- E Suhir (2014) Electronics reliability cannot be assured, if it is not quantified. Chip Scale Reviews.
- E Suhir (2015) Analytical bathtub curve with application to electron device reliability. Journal of Materials Science: Materials in Electronics.
- E Suhir (2015) Failure oriented accelerated testing (FOAT), and its role in making a viable vlsi device into a reliable product, 2015 IEEE VLSI Test Symp. Silverado Resort and Spa, Napa, CA.
- E Suhir, A Bensoussan, G Khatibi, et al. (2015) Probabilistic design for reliability in electronics and photonics: Role, significance, attributes, challenges. IRPS, Hyatt Regency Monterey Resort & Spa, Monterey, CA, USA.
- E Suhir, S Yi (2016) Probabilistic design for reliability of medical electronic devices: Role, significance, attributes, challenges. IEEE Medical Electronics Symp., Portland, OR, USA.
- E Suhir, J Nicolics, S Yi (2016) Probabilistic predictive modeling (PPM) of Aerospace Electronics (AE) reliability: Prognostic-and-health-monitoring (PHM) effort using bayes formula (BF), boltzmann-arrhenius-zhurkov (BAZ) equation and beta-distribution (BD). 2016 EuroSimE Conf., Montpelier, France.
- E Suhir, J Nicolics (2016) Aerospace electronics-and-photonics (AEP) reliability has to be quantified to be assured AIAA SciTech Conf, San Diego, CA, USA.
- E Suhir (2017) Probabilistic design for reliability of electronic materials, assemblies, packages and systems: Attributes, challenges, pitfalls. MMCTSE 2017, Cambridge, UK.
- E Suhir (2017) Aerospace electronics reliability prediction: Application of two advanced probabilistic techniques. Zeitschrift fur Angewandte Mathematik und Mechanik (ZAMM) 98: 824-839.
- E Suhir, R Ghaffarian (2017) Predictive modeling of the dynamic response of electronic systems to impact loading: Review. Zeitschrift fur Angewandte Mathematik und Mechanik (ZAMM) 97.
- E Suhir, S Yi (2017) Probabilistic design for reliability (PDfR) of medical electronic devices (MEDs): When reliability is imperative, ability to quantify it is a must. Journal of SMT 30.
- E Suhir (2017) Static fatigue lifetime of optical fibers assessed using boltzmann-arrhenius-zhurkov (BAZ) model", Journal of Materials Science: Materials in Electronics 28: 11689-11694.
- E Suhir, R Ghaffarian (2017) Solder material experiencing low temperature inelastic thermal stress and random vibration loading: Predicted remaining useful lifetime. Journal of Materials Science: Materials in Electronics 28: 3585-3597.
- E Suhir, R Ghaffarian (2017) Probabilistic palmgren-miner rule with application to solder materials experiencing elastic deformations. Journal of Materials Science: Materials in Electronics 28: 2680-2685.
- E Suhir, S Yi (2017) Accelerated testing and predicted useful lifetime of medical electronics. Handlery Hotel, San-Diego, IMAPS Conf. on Advanced Packaging for Medical Electronics.
- E Suhir, S Yi, J Nicolics, et al. (2017) How swiftly should be a product repaired, so that its availability is not compromised? EuroSimE, Dresden, Germany.
- E Suhir, S Yi (2017) Design-for-reliability and accelerated testing of aerospace electronics: What should be done differently. Special NDA Session at the AIAA SciTech Conf, Gaylord Texan Resort & Convention Center.
- E Suhir, S Yi, J Nicolics (2017) Statistics- and reliability physics related failure rates. IRPS, Monterey.
- E Suhir, S Yi, J Nicolics (2017) When equipment reliability and human performance contribute jointly to vehicular mission success and safety, ability to quantify its outcome is a imperative. IRPS, Monterey.
- E Suhir, R Ghaffarian (2018) Predicted effect of the underfill glass transition temperature on thermal stresses in a flip-chip or a fine-pitch BGA design. Journal of Electrical and Electronic Systems (JEES) 7.
- E Suhir (2018) Low-cycle-fatigue failures of solder material in electronics: Analytical modeling enables to predict and possibly prevent them-review. J Aerosp Eng Mech 2: 134-151.
- E Suhir, R Ghaffarian (2018) Constitutive equation for the prediction of an aerospace electron device performance-brief review. Aerospace 5.
- E Suhir, R Ghaffarian (2018) Flip-chip (FC) and fine-pitch-ball-grid-array (FPBGA) underfills for application in aerospace electronics packages – brief review. Aerospace 5.
- E Suhir (2018) Aerospace mission outcome: Predictive modeling. Aerospace 5.
- E Suhir (2018) What could and should be done differently: Failure-oriented-accelerated-testing (FOAT) and its role in making an aerospace electronics device into a product. Journal of Materials Science: Materials in Electronics 29: 2939-2948.
- E Suhir (2018) Solder joint interconnections in automotive electronics: Design-for-reliability and accelerated testing. Abstracts Proceedings, SIITME, Jassy, Romania.
- E Suhir (2018) Probabilistic design for reliability (PDfR) of aerospace instrumentation: Role, significance, attributes, challenges. 5th IEEE International Workshop on Metrology for Aerospace (MetroAeroSpace), Rome, Italy, Plenary Lecture.
- E Suhir (2019) Mechanical behavior of optical fibers and interconnects: Application of analytical mechanics. In: Altenbach H., Öchsner A. (eds) Encyclopedia of continuum mechanics. Springer, Berlin, Heidelberg.
- E Suhir (2019) Design for Reliability of Electronic Materials and Systems. In: Altenbach H., Öchsner A. (eds) Encyclopedia of Continuum Mechanics. Springer, Berlin, Heidelberg.
- E Suhir (2019) Making a viable medical electron device package into a reliable product. IMAPS Advancing Microelectronics 46.
- A Ponomarev, E Suhir (2019) Predicted useful lifetime of aerospace electronics experiencing ionizing radiation: Application of BAZ model. J Aerosp Eng Mech 3: 167-169.
- E Suhir (2019) Analytical thermal stress modeling in electronics and photonics engineering: Application of the concept of interfacial compliance. Journal of Thermal Stresses 42: 29-48.
- E Suhir (2019) Failure-oriented-accelerated-testing (FOAT), boltzmann-arrhenius-zhurkov equation (BAZ) and their application in microelectronics and photonics reliability engineering. Int J of Aeronautical Sci and Aerospace Research 6.
- E Suhir (2019) Failure-oriented-accelerated-testing and its possible application in ergonomics. Ergonomics International Journal 3.
- E Suhir (2019) To burn-in, or not to burn-in: That's the question. Aerospace 6.
- E Suhir, R Ghaffarian (2019) Electron device subjected to temperature cycling: Predicted time-to-failure. Journal of Electronic Materials 48: 778-779.
- E Suhir (2019) Probabilistic design for reliability in electronics and photonics: Role, attributes, challenges. Univ of Illinois, Urbana-Champaign.
- E Suhir (2019) Design-for-reliability and accelerated-testing of solder joint interconnections. Chip Scale Reviews.
- E Suhir (2019) Burn-in: When, for how long and at what level? Chip Scale Reviews.
- E Suhir, G Paul (2020) Automated driving (AD): Should the variability of the available-sight-distance (ASD) be considered? Theoretical Issues in Ergonomic Science.
- E Suhir, JM Salotti, J Nicolics (2020) Required repair time to assure the specified availability. Universal Journal of Lasers, Optics, Photonics and Sensors 1: 1-7.
- E Suhir (2020) Boltzmann-arrhenius-zhurkov equation and its applications in electronic-and-photonic aerospace materials reliability-physics problems. Int Journal of Aeronautical Science and Aerospace Research.
- E Suhir (2020) Is burn-in always needed? Int J of Advanced Research in Electrical, Electronics and Instrumentation Engineering (IJAREEIE) 9: 2751-2757.
- E Suhir (2020) For how long should burn-in testing last? J Electr Electron Syst 2.
- E Suhir, Z Stamenkovic (2020) Using yield to predict long-term reliability of integrated circuit (IC) devices: Application of boltzmann-arrhenius-zhurkov (BAZ) model. Solid-State Electronics.
- E Suhir (2000) Thermal stress modeling in microelectronics and photonics packaging, and the application of the probabilistic approach: Review and extension. IMAPS Int. J. Microcircuits and Electronic Packaging 23.
- E Suhir (2020) Avoiding inelastic strain in solder material of IC devices. CRC Press.
- N Vichare, M Pecht (2006) Prognostics and health management of electronics. IEEE Transactions on Components and Packaging Technologies 29.
- LV Kirkland, T Pombo, K Nelson, et al. (2004) Avionics health management: Searching for the prognostics grail. Proceedings of IEEE Aerospace Conference 5.
- PM Hall (1984) Forces, moments, and displacements during thermal chamber cycling of leadless ceramic chip carriers soldered to printed boards. IEEE CHMT Transactions 7.
- JT Reason (1990) Human error. Cambridge University Press, Cambridge, UK.
- AT Kern (2001) Controlling pilot error: Culture, environment, and CRM (Crew Resource Management). McGraw-Hill, USA.
- WA O'Neil (2001) The human element in shipping. Keynote Address, Biennial Symp. of the Seafarers International Research Center, Cardiff, Wales.
- DC Foyle, BL Hooey (2008) Human performance modeling in aviation. CRC Press.
- D Harris (2011) Human performance on the flight deck. Bookpoint Ltd., Ashgate Publishing, Oxon, UK.
- E Hollnagel (1993) Human reliability analysis: Context and control. Academic Press, London and San Diego.
- JT Reason (1997) Managing the risks of organizational accidents. Ashgate Publishing Company, USA.
- E Suhir, C Bey, S Lini, et al. (2014) Anticipation in aeronautics: Probabilistic assessments. Theoretical Issues in Ergonomics Science.
- E Suhir (2019) Mental workload (MWL) vs. human capacity factor (HCF): A way to quantify human performance. In: Gregory, Inna Bedny, Applied and Systemic-Structural Activity Theory. CRC Press.
- E Suhir (2019) Short note - assessment of the required human capacity factor using flight simulator as an appropriate accelerated test vehicle. IJHFMS 7.
- E Suhir (2019) Short note - adequate trust, human-capacity-factor, probability-distribution-function of human non-failure and its entropy. IJHFMS 7.
- E Suhir (2020) Driver Fatigue and Drowsiness: A Probabilistic Approach.
- E Suhir (2020) Quantifying the effect of astronaut's health on his/hers performance: Application of the double-exponential probability distribution function. HISI Journal.
- KA Hoff, M Bashir (2015) Trust in automation: Integrating empirical evidence on factors that influence trust. Human Factors 57.
- H Kaindl, D Svetinovic (2019) Avoiding undertrust and overtrust. In: Joint Proceedings of REFSQ-2019 Workshops, Doctoral Symp., Live Studies Track and Poster Track, co-located with the 25th Int. Conf. on Requirements Engineering: Foundation for Software Quality (REFSQ 2019). Essen, Germany.
- P Madhavan, DA Wiegmann (2007) Similarities and differences between human-human and human-automation trust: An integrative review. Theoretical Issues in Ergonomic Science 8.
- Rosenfeld, S Kraus (2018) Predicting human decision-making: From prediction to action. Morgan & Claypool.
- E Suhir (2009) Helicopter-landing-ship: Undercarriage strength and the role of the human factor. ASME OMAE Journal 132.
- E Suhir (2010) Probabilistic modeling of the role of the human factor in the helicopter landing ship (HLS) situation. International Journal of Human Factor Modeling and Simulation (IJHFMS).
- E Suhir, RH Mogford (2011) Two men in a cockpit: Probabilistic assessment of the likelihood of a casualty if one of the two navigators becomes incapacitated. 10th AIAA Aviation Technology, Integration, and Operations (ATIO) Conference.
- E Suhir (2011) Human-in-the-loop: Likelihood of a vehicular mission-success-and-safety, and the role of the human factor. IEEE/AIAA Aerospace Conference, Big Sky, Montana.
- E Suhir (2012) Human in the loop: Predicted likelihood of vehicular mission success and safety. J Aircraft 49.
- E Suhir (2013) Miracle-on-the-hudson: Quantified aftermath. Int J Human Factors Modeling and Simulation 4.
- E Suhir (2014) Human-in-the-loop (HITL): Probabilistic predictive modeling (PPM) of an aerospace mission/situation outcome. Aerospace 1.
- E Suhir (2014) Human-in-the-loop: Probabilistic predictive modeling, its role, attributes, challenges and applications. Theoretical Issues in Ergonomics Science (TIES).
- E Suhir (2015) Human-in-the-loop and aerospace navigation success and safety: Application of probabilistic predictive modeling. SAE Conf, Seattle, WA.
- E Suhir (2017) Human-in-the-loop: Application of the double exponential probability distribution function enables one to quantify the role of the human factor. Int J of Human Factor Modeling and Simulation 5.
- E Suhir (2018) Human-in-the-loop: Probabilistic modeling of an aerospace mission outcome. CRC Press.
- E Suhir (2018) Aerospace mission outcome: Predictive modeling. Aerospace 5.
- E Suhir (2018) Quantifying human factors: Towards analytical human-in-the-loop. Int J of Human Factor Modeling and Simulation 6.
- E Suhir (2019) Probabilistic reliability-physics models in aerospace human-in-the-Loop (HITL) problems. DHM and Posturography, Academic Press.
- E Suhir (2019) Probabilistic risk analysis in aerospace human-in-the-loop tasks: Review and extension. Human Systems Integration (HIS-2019) Conf., Biarritz, France.
- E Suhir (2020) Head-on railway obstruction: Probabilistic model. Theoretical Issues in Ergonomic Science.
- E Suhir G Paul (2020) Avoiding collision in an automated driving situation. Theoretical Issues in Ergonomics Science (TIES).
- E Suhir, G Paul, H Kaindl (2020) Towards probabilistic analysis of human-system integration in automated driving. In: Ahram T, Karwowski W, Vergnano A, Leali F, Taiar R, Intelligent Human Systems Integration. 2020. IHSI 2020. Advances in Intelligent Systems and Computing, vol. 1131. Springer.
- E Suhir (1997) Applied probability for engineers and scientists. McGraw-Yill, New York.
- E Suhir (2002) Analytical stress-strain modeling in photonics engineering: Its role, attributes and interaction with the finite-element method. Laser Focus World.
- E Suhir (2015) Analytical modeling enables explanation of paradoxical situations in the behavior and performance of electronic materials and products: Review. Journal of Physical Mathematics.
- E Suhir (2016) Analytical modeling occupies a special place in the modeling effort. J Phys Math 7.
- E Suhir (2019) Application of analytical modeling in the design for reliability of electronic packages and system. In: H Altenbach, A Oechsner, Encyclopedia of Continuum Mechanics. Springer.
- E Suhir, S Scaraglinil (2020) Extraordinary automated driving situations: Probabilistic analytical modeling of human-systems-integration(HSI) and the role of trust. 11-th Conf. on Applied Human Factors and Ergonomics (AHFE), Dan-Diego, CA.
- JM Salotti, R Hedmann, E Suhir (2014) Crew size impact on the design, risks and cost of a human mission to mars. 2014 IEEE Aerospace Conference, Big Sky, Montana.
- JM Salotti, E Suhir (2014) Some major guiding principles for making future manned missions to mars safe and reliable. 2014 IEEE Aerospace Conference, Big Sky, Montana.
- JM Salotti, E Suhir (2014) Manned missions to mars: Minimizing risks of failure. Acta Astronautica 93: 148-161.
- E Suhir (2020) Survivability of species in different habitats: Application of multi-parametric boltzmann-arrhenius-zhurkov equation., Acta Astronautica 175: 249-253.
Corresponding Author
E Suhir, Bell Laboratories, Physical Sciences and Engineering Research Division, Murray Hill, NJ; Departments of Mechanical and Material and Electronic and Computer Engineering, Portland State University, OR, USA; Department of Applied Electronic Materials, Institute of Sensors and Actuators, Technical University, Vienna, Austria; James Cook University, Mackay Institute of Research and Innovation, Townsville, Queensland, Australia; ERS Co., 727 Alvina Ct., Los Altos, CA 94024, USA, Tel: 650.969.1530; 408-410-0886
Copyright
© 2020 Suhir E. This is an open-access article distributed under the terms of the Creative Commons Attribution License, which permits unrestricted use, distribution, and reproduction in any medium, provided the original author and source are credited.