Scattering and Absorption Coefficients of Biological Chlorophyll Pigmented Grains in Aqueous Suspension
Abstract
Chlorophyll pigmented grains were extracted from leaves of palm trees and maintained in aqueous solutions containing an organic solvent. Their transmittance spectra were measured for visible wavelengths, from 400 to 700 nm. Four dissolutions were prepared to consider different pigment concentrations. The transmittance measurements show a somewhat spectrally structured band between 474 and 650 nm, limited by the light extinction (scattering + absorption) due to the pigments. A direct inversion of the transmittance spectra allows to obtain the extinction coefficient per unit length of the four samples considered. The spectral behavior of this set of coefficients suggests the validity of the independent scattering regime through long wavelengths and for the four concentrations being analyzed, not so at short wavelengths for the sample with the highest concentration. A spectral acceptance-probability-controlled simulated annealing method is used to invert the transmittance spectra, obtaining so the effective scattering and absorption coefficients per unit length characterizing the chlorophyll pigmented samples. In this way, the contributions of scattering and absorption to the extinction are spectrally decoupled.
Keywords
Chlorophyll pigments, Scattering coefficient, Absorption coefficient, Extinction coefficients, Simulated annealing
Introduction
Characterization of biological tissues in terms of how much they scatter and absorb electromagnetic radiation has been an issue of great relevance for many decades. In the case of human tissues, the knowledge of the spectral variation of their scattering and absorption coefficients has served as the basis for the development of medical technologies and therapies [1-3], with a similar situation in the veterinary field [4]. Regarding tissues for plants, those located in their leaves and participating in the photosynthesis process are of primary relevance [5]. Many theoretical approaches have been devised to describe the propagation of electromagnetic radiation through biological tissues, including those based on Monte Carlo simulations [6] and radiative transfer models [7,8].
There are certain biological tissues from which some of their components have been obtained since long time to be analyzed due to the key role they have in the photosynthesis process [9]. We are referring to chloroplasts and to the interconnected light absorbing thylakoid grains that they contain. In this work, we are interested in obtaining the scattering and absorption coefficients of chlorophyll pigmented grains in suspension. The samples have been obtained from leaves of palm trees following a standardized extraction process based on the use of an organic solvent. Visible relative transmittance spectra [Trl(λ) with λ as the wavelength of the incident light] are obtained using a standard spectrophotometer. From these measurements, a direct inversion based on Lambert law [10] allows to obtain the attenuation or extinction coefficient μext = μext(λ) from inversion of Trl(λ) = exp (-μextb) with b as the distance travelled by the light through the pigmented medium. If the pigments are in molecular form, this coefficient becomes the absorption coefficient (μext = μabs), the sample does not scatter light. If some of the pigments have conserved, after the extraction process, their granular form with submicron sized dimensions, the extinction coefficient is the sum of scattering plus absorption (μext = μsca + μabs). In this regime of extinction, if the scattering units act independently, the extinction coefficient is proportional to the volume fraction f occupied by the pigments in the solution, i.e. μext = f (Csca + Cabs)/V = f•Cext/V where Csca/V, Cabs/V, and Cext/V are the average volume scattering, absorption, and extinction cross sections of an individual pigmented particle, respectively, with V as its volume. This is the range of validity of Beer law [11], Trl(λ) = exp [-f •(Cext/V)•b] which is more frequently applied in those cases of non-scattering samples: Trl(λ) = exp[-f•(Cabs/V)•b]. These laws are referred in the literature as Beer-Lambert-Bouguer (BLB) law due to the previous work also carried out by the French scientist M. Bouguer in 1729 [12].
For non-scattering media, within the range of validity of the Beer law applied to absorbing molecules in suspension [13], the absorbance is usually written as A = μext•b = a•b•c where c is the concentration of the absorbing units, usually expressed in moles per unit volume, and a is referred as the molar absorptivity given in units of area per mol. The relation between absorptivity and molecular absorption cross section is given by Cabs = a/Na with Na as Avogadro's number. The relation between molar concentration and volume fraction becomes c = fρ/M where ρ is the mass density of the molecules and M is its molecular weight. When this law is applied to light scattering and absorbing colloidal or submicron sized pigmented particles in a (liquid or polymeric) matrix, a is given in units of area per number of particles, and c is the number of particles per unit volume. As consequence Cext = a and c = fρ/M with ρ as the average mass density of a particle whose mass is M. In these cases, it is not appropriate to denote a as an absorptivity and A as an absorbance because both have contributions from scattering and absorption [14,15].
In this work, four samples of submicron sized chlorophyll pigmented grains in a liquid matrix are considered. The method to prepare the samples is briefly described in Section 2, as well as the optical transmittance measurements carried out. Section 3 contains the direct inversion approach followed to obtain the extinction coefficient per unit length of the four samples. The formalism required to evaluate reflectance and transmittance spectra of the optical system usually considered in the standard spectrophotometers used by chemist and microbiologists (a quartz cuvette containing the medium under study, and normally illuminated with non-polarized light) is summarized in Section 4. This formalism accounts for the reflection and refraction of the light at the interfaces of the system. We refer in this section to the simulated annealing method applied to invert the measured transmittance spectra with the aim of obtaining the scattering and absorption coefficients per unit length of the samples. A pseudocode of the simulated annealing approach we use is in the Appendix B. The results of the inversion are reported and interpreted in Section 5. The method reported here can also be easily applied, both from experimental and computational points of view, to characterize by means of spectrophotometric measurements the interaction between biological tissues and external agents like venoms and antivenoms [16].
Sample Preparation and Transmittance Measurements
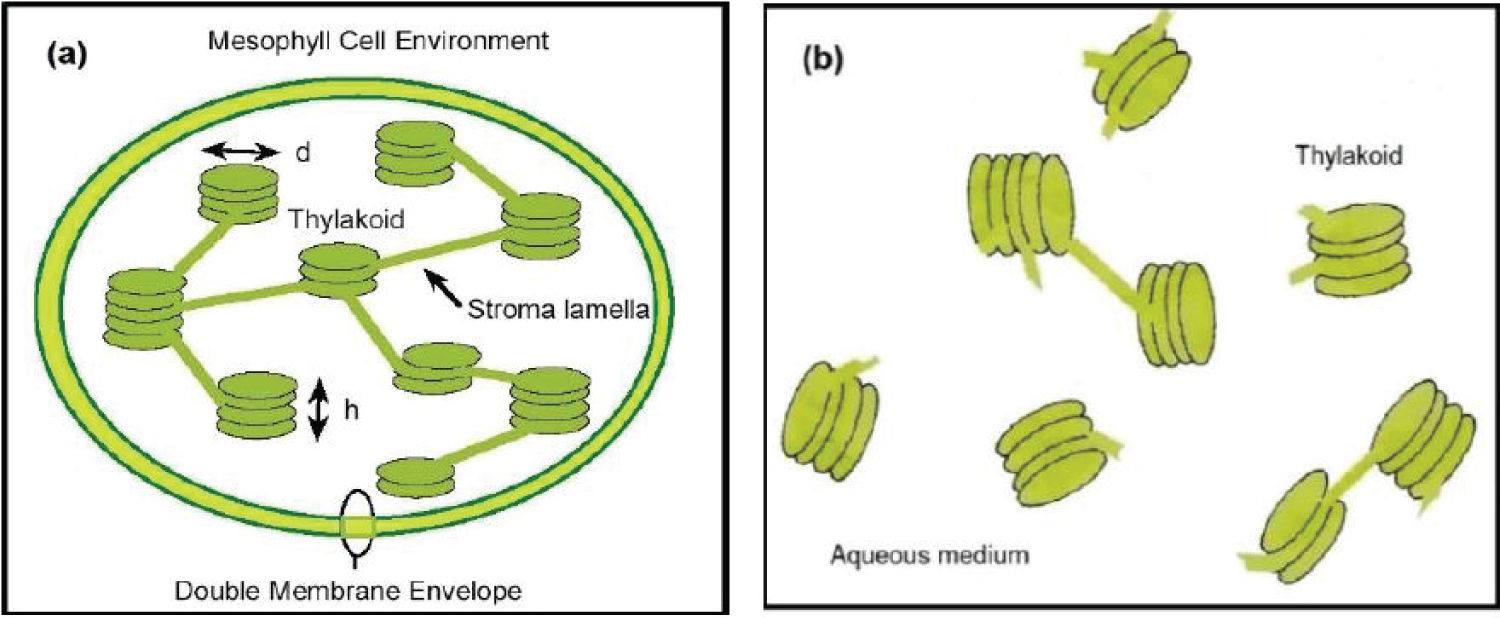
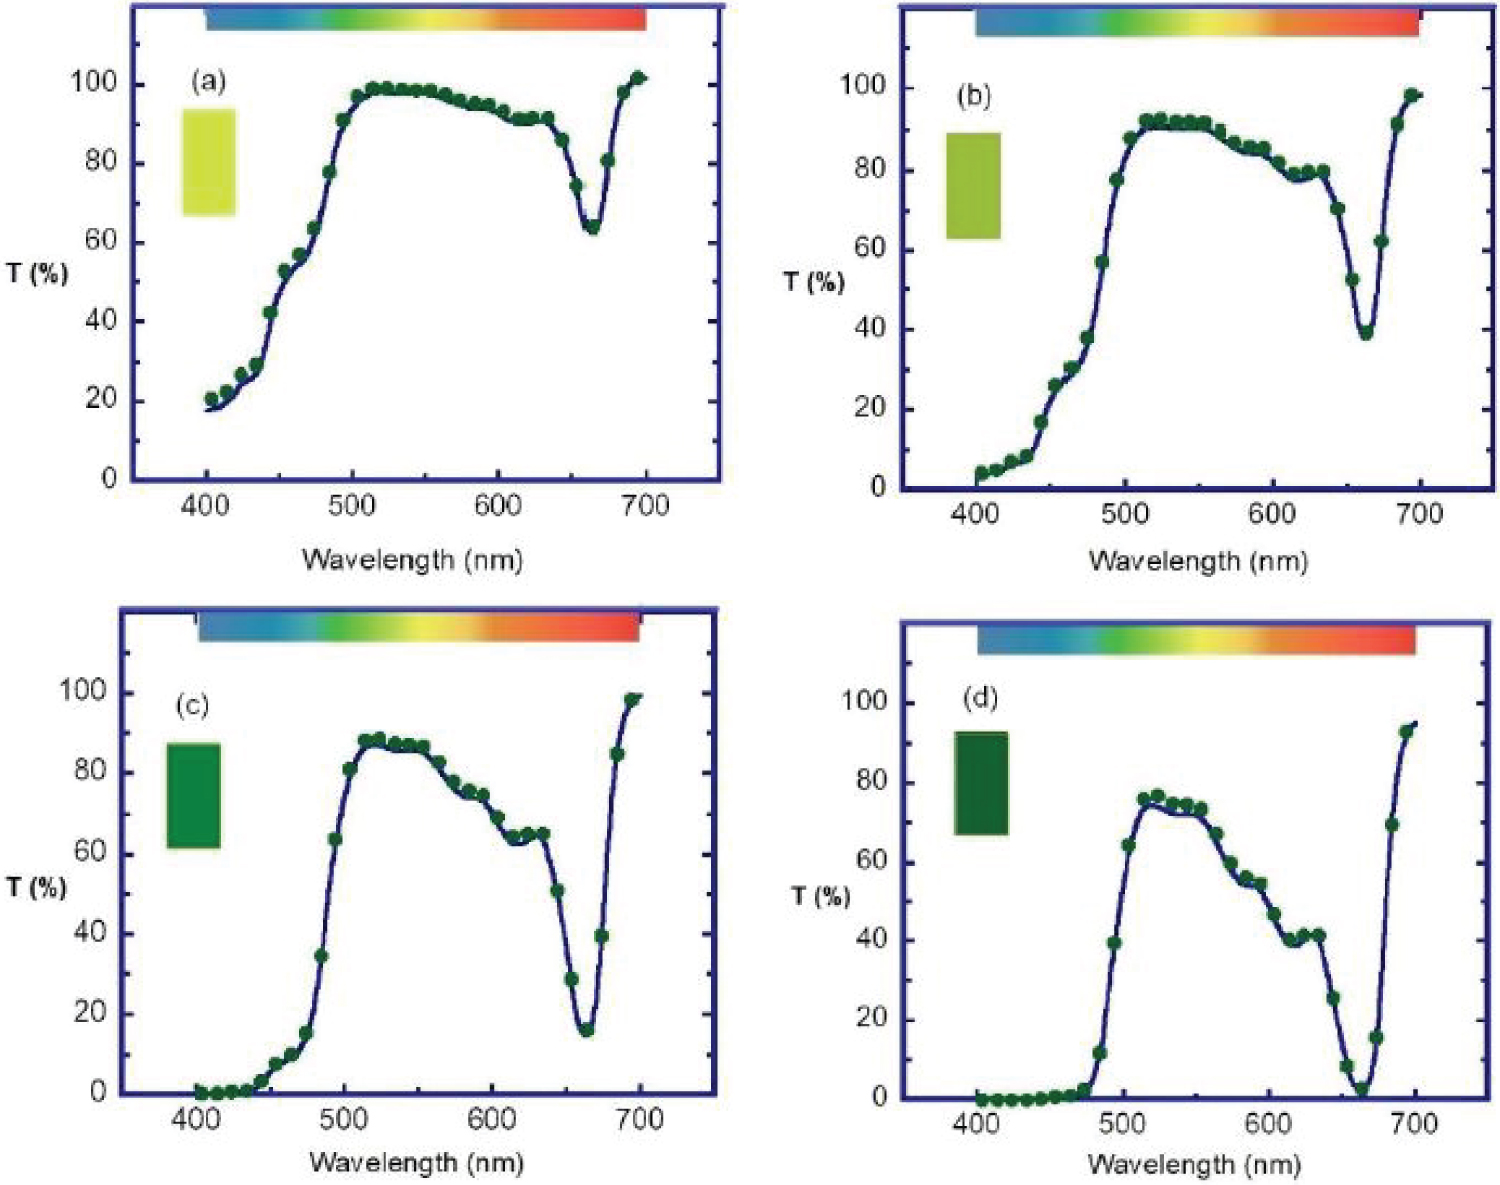
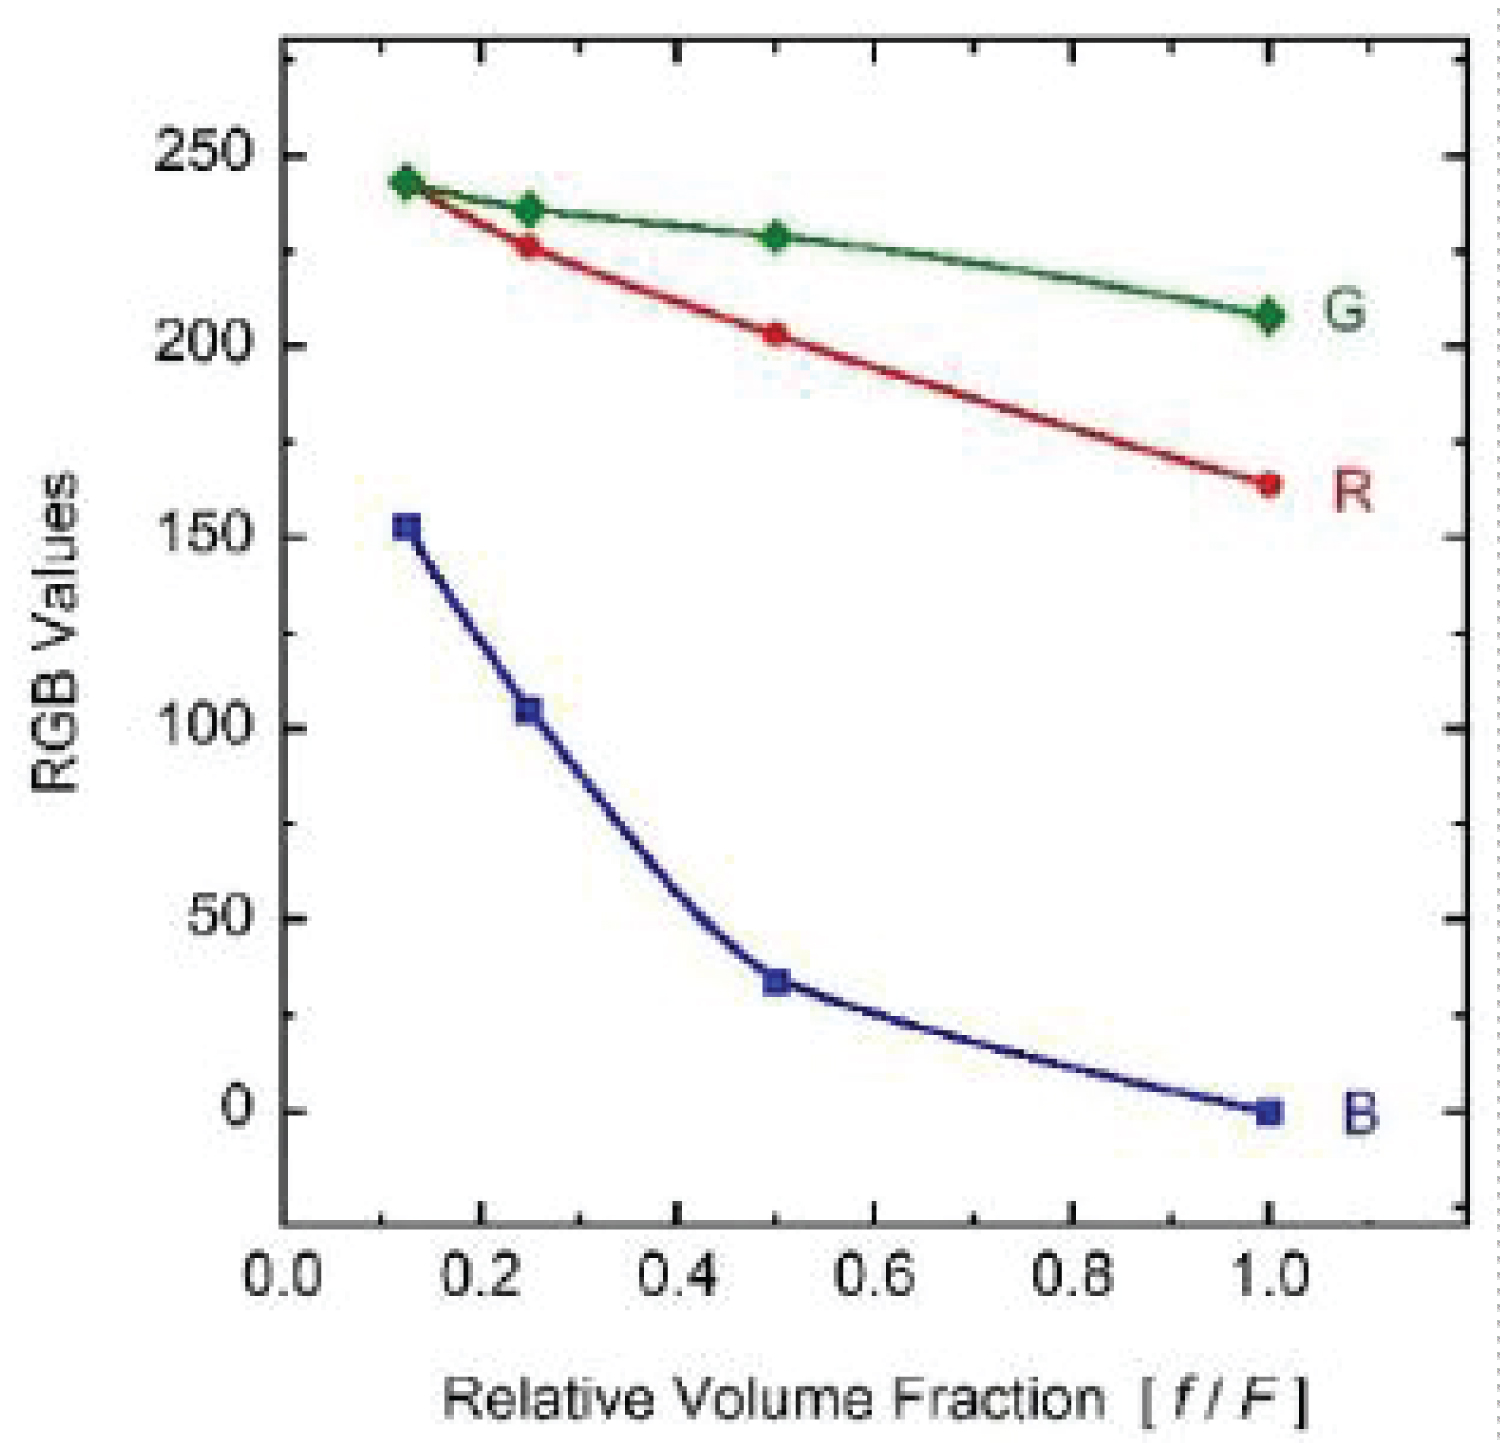
Several fresh palm leaves were cut to obtain from them small pieces that were then crushed in a mortar, to add water containing an organic solvent [17]. The function of this solvent is to penetrate the membrane of the cells, to dissolve the lipids, as well as the lipoproteins of the double membranes of the micron-sized chloroplasts, releasing in this way the submicron-sized thylakoids that contain the chlorophyll molecules in its lumen, together with some of their stroma lamellae connections [18]. The thylakoids consist of certain number of flattened vesicles which form several grana, as sketched in (Figure 1) [19]. The prepared composite was filtered to obtain a green aqueous solution at the highest pigment concentration achieved, F. The whole process was carried out at room temperature. From this sample, by dissolution with added water, three other samples were prepared, with corresponding nominal volume fractions close to F/2, F/4, and F/8. The extraction process was carried out in its basic approach, with no application of ultrasound or sonication to improve the extraction [20]. Our goal is to keep open the possibility of partial degradation of the quasi-cylindrical grana formed by thylakoids. Due to the sizes of these grana, with about 300 nm in diameter and 200-600 nm in height [18], those that retain their structures must contribute to light scattering in addition to absorption. Once prepared the four samples, their relative transmittance spectra were measured by using a standard UV-Visible Shimadzu spectrophotometer. (Figure 2) displays the set of measurements carried out when considering samples with increasing concentration of chlorophyll pigmented grains. The cuvette was normally illuminated with non-polarized light. The expected trend is observed: The larger the pigment concentration, the lower the transmittance is at each spectral point, and more accentuated is the green hue of the solution as shown in the Color Calculation Appendix A. The uncertainty of these transmittance measurements is between 2%, in the spectral regions of large extinction, and less than 0.05% where the extinction is small [21]. First, a set of measurements was carried out half an hour after extraction of the pigments from the leaves. Two and a half hours later, the measurements were repeated to see how much the pigments had degraded. The results indicate high stability of the pigments under ambient conditions. Measured transmittance spectra shown in (Figure 2) have been normalized respect to a reference transmittance spectrum, Trf(λ), of the fused quartz cuvette containing a sample with the non-pigmented transparent solvent.
In this way, the effect of light reflection and refraction at the boundaries of air-fused quartz and fused quartz-solvent is minimized. The almost null transmission of light when approaching the 400 nm for the two samples with the highest concentrations suggests that extinction has a significant contribution from scattering at short wavelengths. This amount of scattering would require of submicron-sized scattering units, being the presence of grana formed by thylakoids the more plausible explanation, as we have assumed in the sketch of (Figure 1b).
Direct Inversion of the Transmittance Spectra: Extinction Coefficients
The reported measurements of absorbance by chlorophyll pigments immersed in a proteinaceous medium show several absorption peaks [22]. Those peaks attributed to chlorophyll a pigments are located at 440 nm (the largest one), at 418 and 669 nm (two peaks with rather similar lower heights), and at 585 and 623 nm (two peaks with the lowest heights). The absorption peaks correlated with presence of chlorophyll b are spectrally located at 463 nm (the largest one), 439 and 651 nm (two peaks with lower heights), and the lowest peak at 603 nm. In plants, the content of chlorophyll a is significantly larger than that of chlorophyll b. The absorbance peaks spectrally close to 669 and 651 nm have been used as reference to quantify the concentrations of chlorophyll a and chlorophyll b in specific samples [23]. When absorbance measurements by chlorophyll pigments in an organic solvent are carried out, their absorption peaks show blue shifts typically between 1 and 10 nm, depending on the specific organic solvent used.
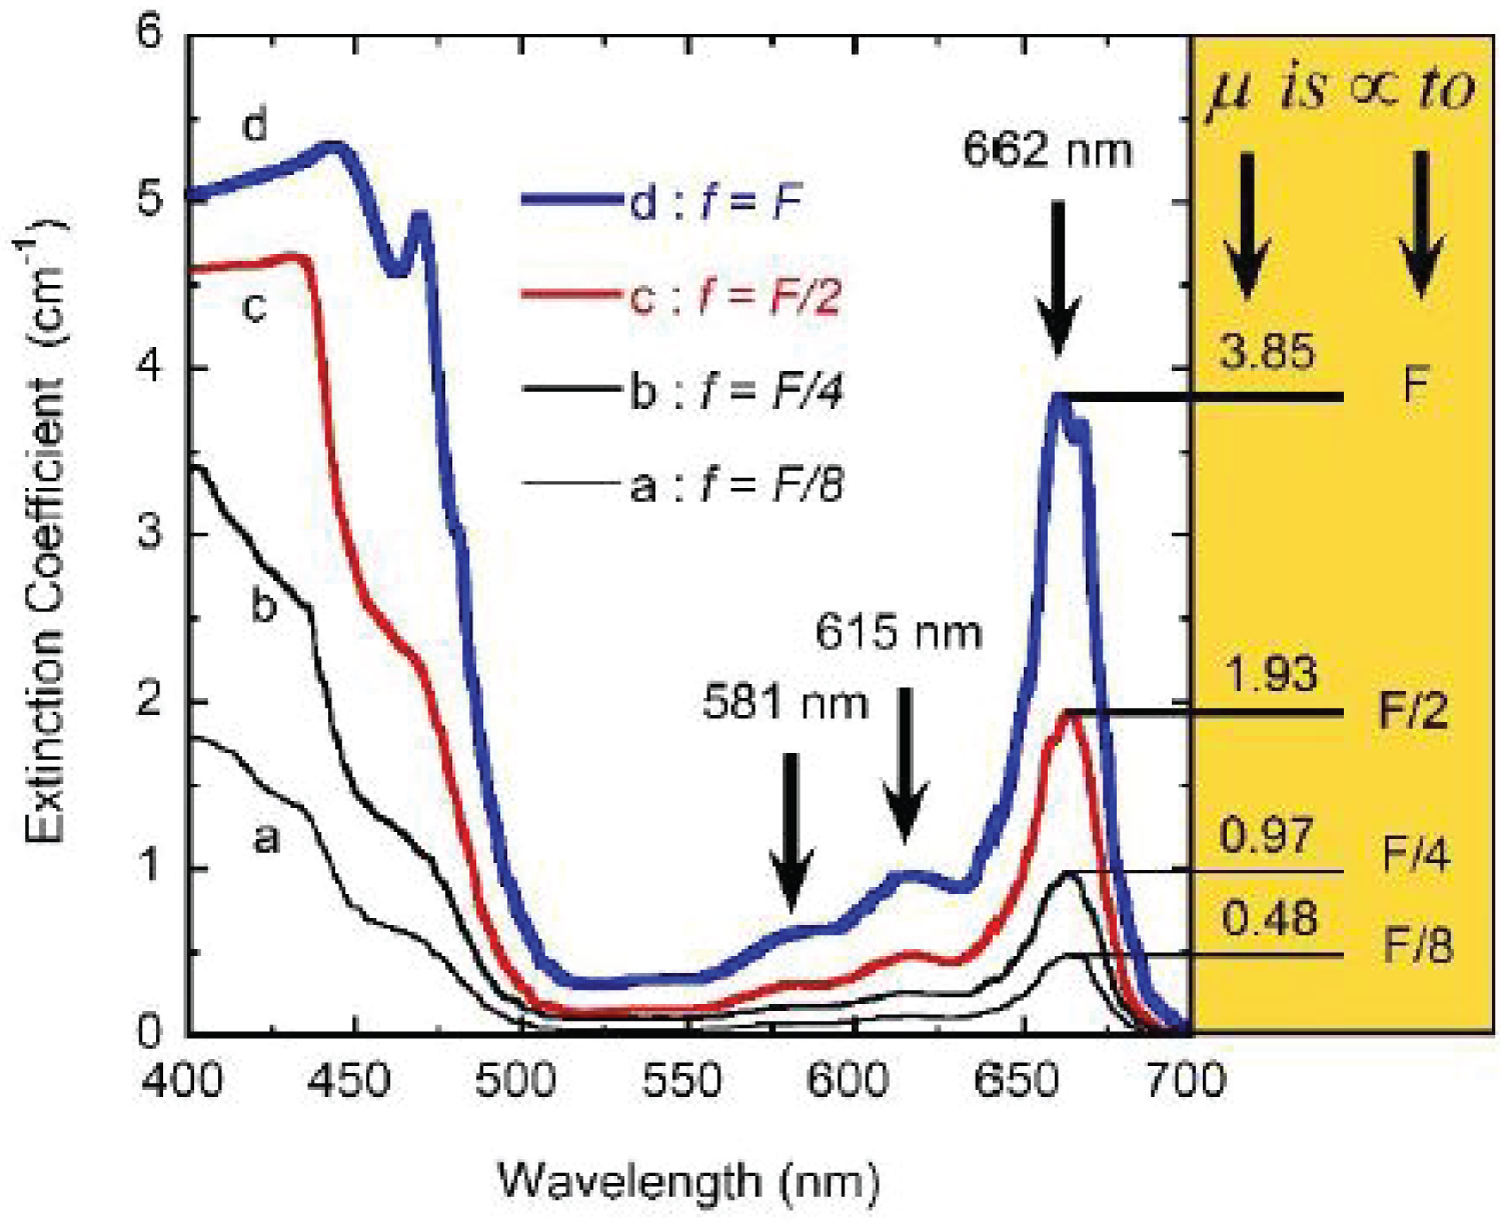
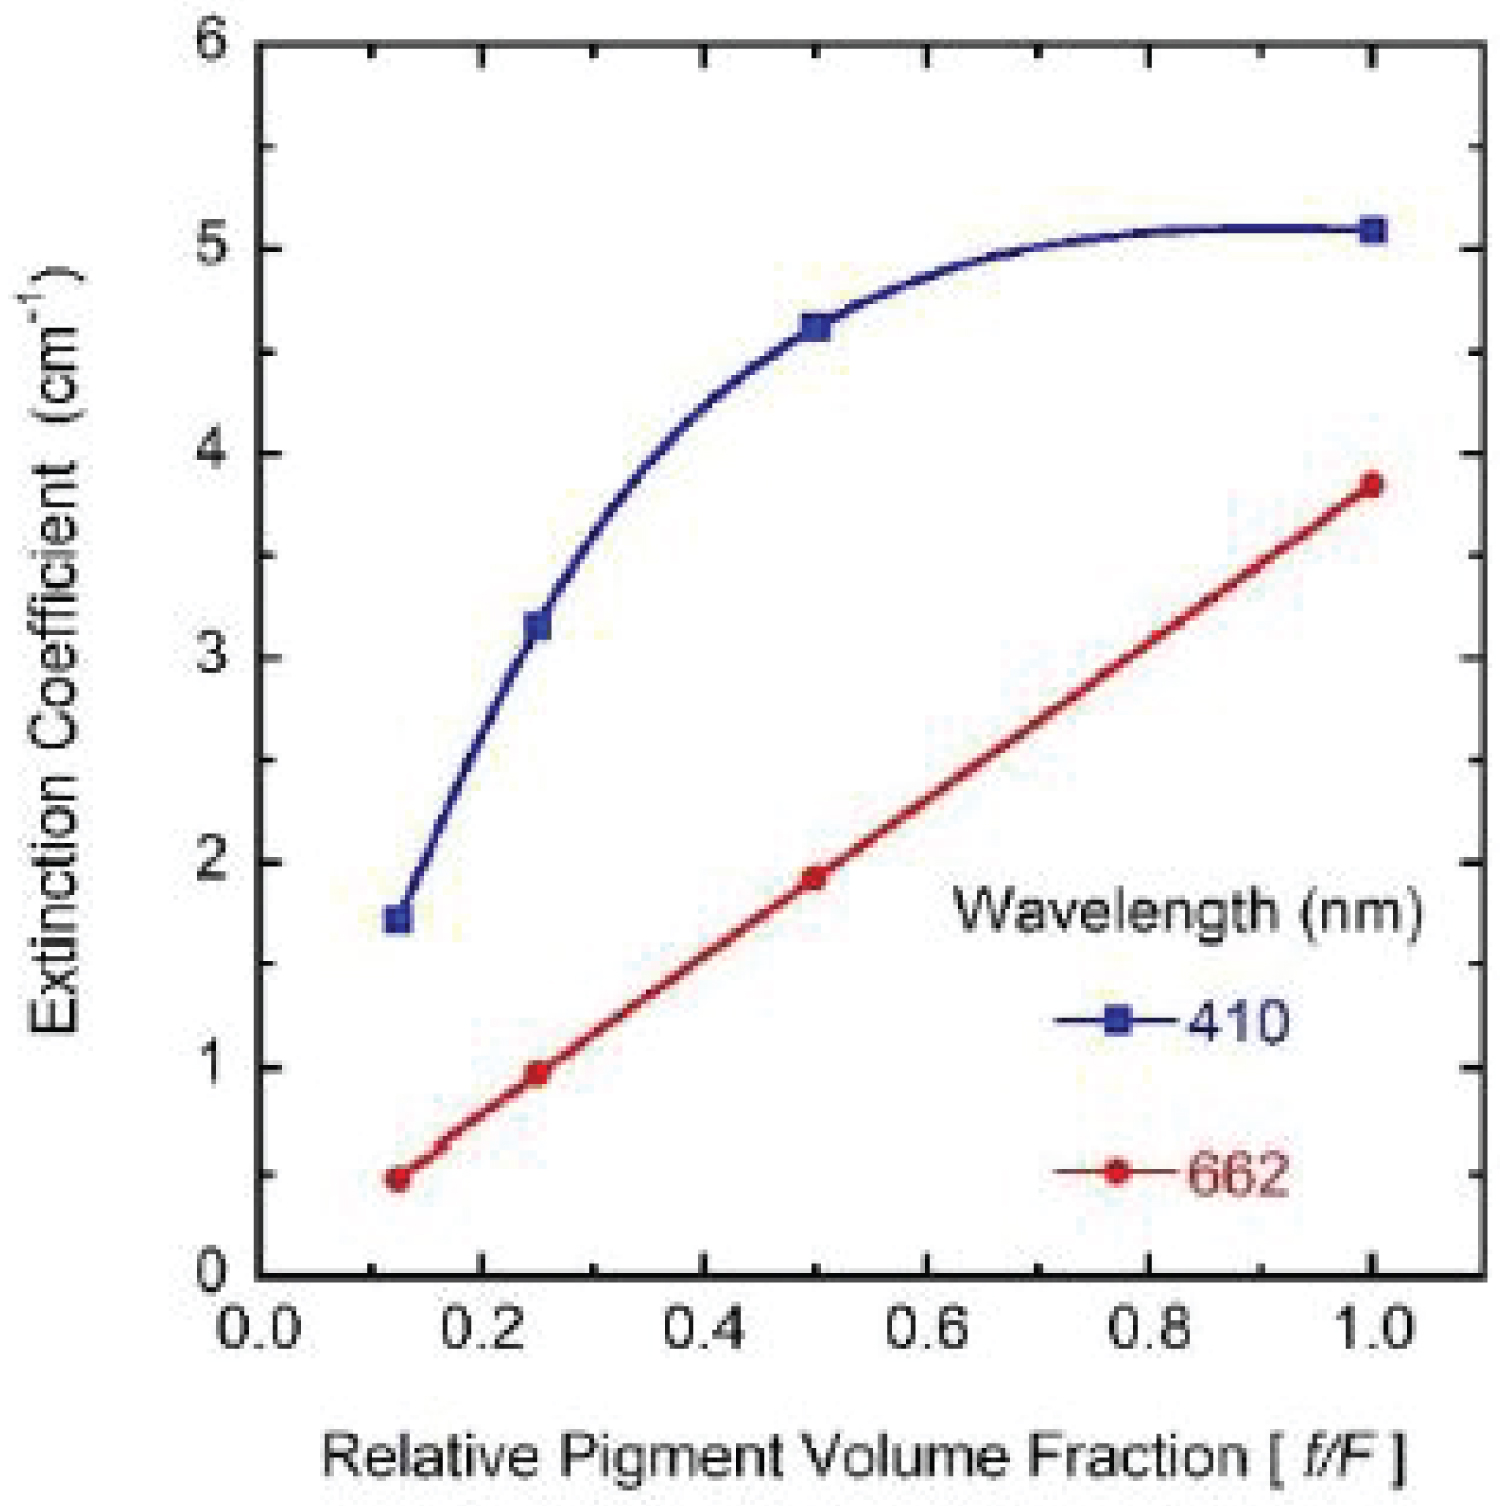
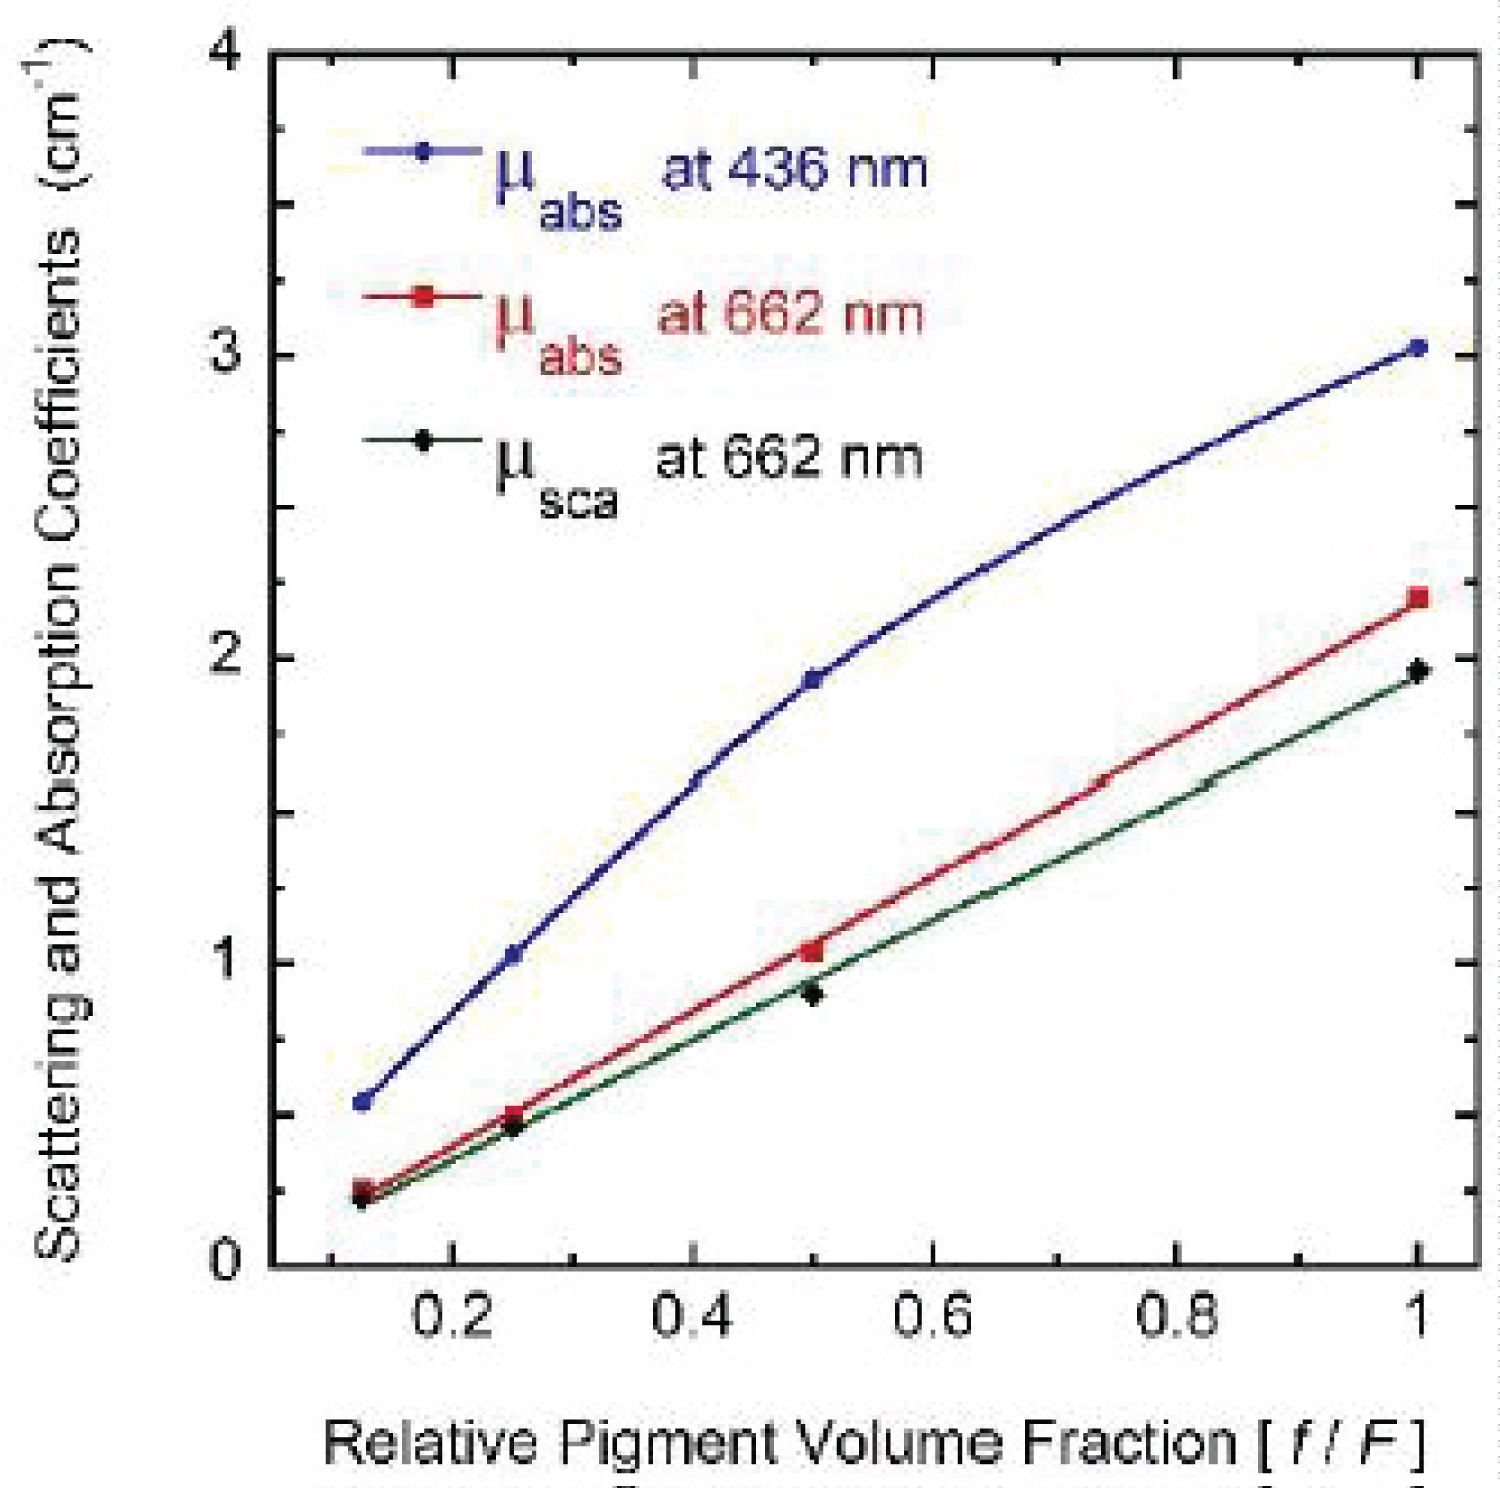
For the pigmented samples, the intensity of the propagating radiation exponentially decays with the distance travelled through both sides of the cuvette (b = 1.0 cm), i.e. the intensity obeys BLB law [24]. As consequence, Trl = exp(-μextb) with μext as the extinction coefficient per unit length of the pigmented medium as indicated before. From each transmittance spectrum, the corresponding extinction coefficient per unit length, μext(λ) = -ln [Trl(λ)]/b with λ as the wavelength of the incident radiation, has been obtained and displayed in (Figure 3). Three of the attenuation peaks correlated with the presence of chlorophyll a are well identified at spectral positions 581, 615 and 662 nm (see the black arrows in the figure). The expected peak at short wavelengths is not well resolved probably due to superposition with significant scattering. At the right side of the figure, the values of the extinction coefficients at the spectral position of the peak at long wavelengths, 662 nm, have been indicated. This absorption peak has been attributed to the chlorophyll a pigment [22]. As indicated more clearly by the heights of the peaks, they are linearly proportional to the volume fraction occupied by the pigments in the corresponding solution. This means that the independent extinction approximation is valid at long wavelengths, i.e. the scattering and absorption of light by any of the pigments is not influenced by those pigments in its neighborhood. Clearly, this linear proportionality does not hold at short wavelengths, as shown in (Figure 4) where a linear relationship is shown at one of the long wavelengths, while a saturation is manifested in extinction at one of the short wavelengths. The spectral behavior of the extinction coefficients obtained from our transmittance measurements shows peaks through long wavelengths at 662, 615, and 581 nm which can correspond to the peaks located at 669, 623, and 585 nm for samples containing chlorophyll a pigments in a proteinaceous medium. As aforementioned, a similar correlation between peaks is more difficult to carry out at short wavelengths probably due to the more significant contribution of the scattering by the chlorophyll pigmented particles to extinction.
Formalism to Evaluate Reflectance and Transmittance Spectra
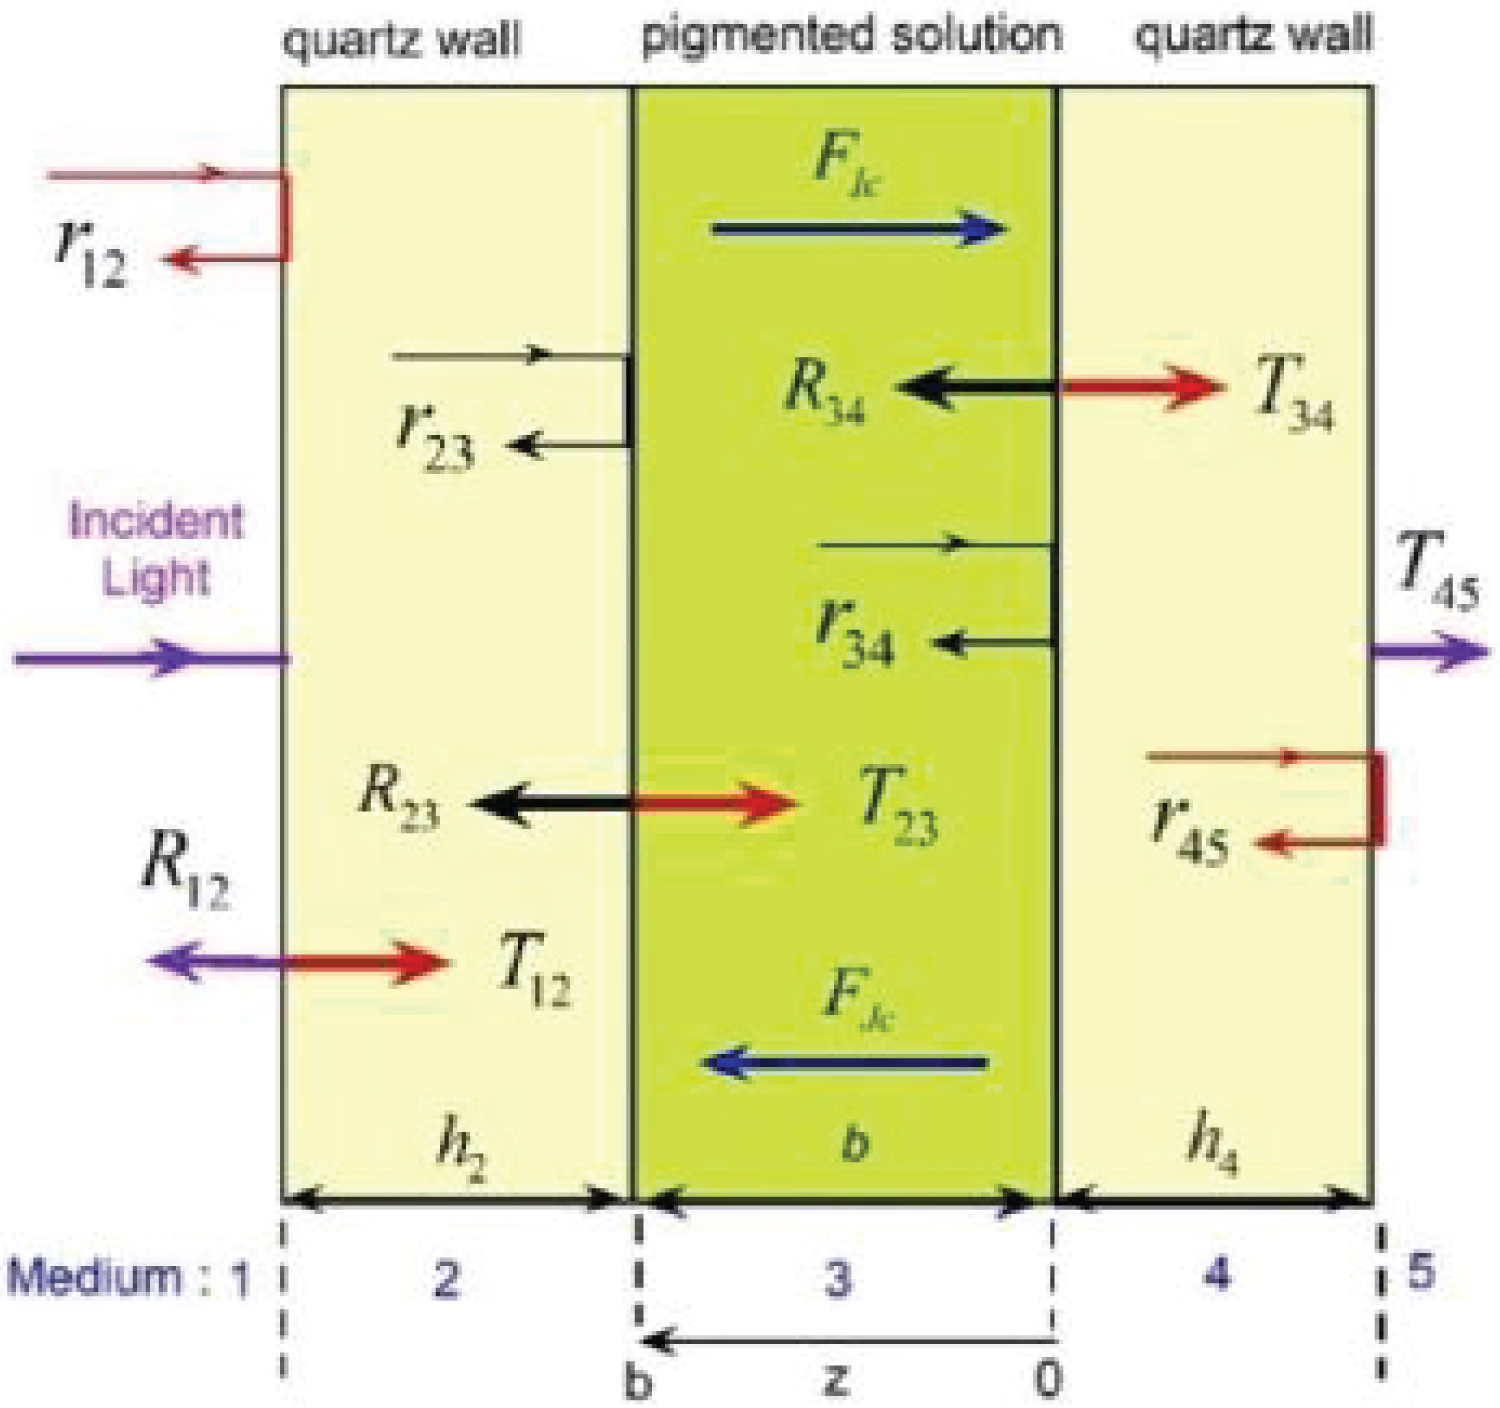
We are going to consider samples with light scattering and absorbing chlorophyll pigmented grains in suspension. Our aim is to decouple the contribution of scattering and of absorption to the extinction. This cannot be done within the context of the standard application of BLB law which allows to obtain only the extinction coefficient from inversion of transmittance or absorbance measurements. To carry out this task, we will apply the formalism devised by Vargas, Wang, and Niklasson who consider the directional propagation of collimated components through light scattering and absorbing media, perpendicularly illuminated with non-polarized radiation [25]. The decay of the light intensities and corresponding fluxes of forward (FIc) and backward (FJc) radiation is according to Lambert law, with inclusion of reflection and refraction at the different interfaces between the involved media. (Figure 5) shows the scheme of the optical system to be considered: media 1 and 5 are air or vacuum, media 2 and 4 are the thick walls of the fused quartz cuvette containing the active medium. Medium 3 consists of a predominantly aqueous solution where the chlorophyll pigmented grains have been dissolved. The thickness of the fused quartz walls is about 0.125 cm, and the pathlength of the collimated radiation through the pigmented solution is b = 1.0 cm. Through the visible wavelength range, the light absorption by the quartz walls is negligible and that of the aqueous solution is small. The effective transmittance of the whole system is given by [26].
where rij is the reflection coefficient at the interface between media i and j, the optical depth of the medium contained in the cuvette is τ3 = (μsca + μabs + αw) b where αw is the absorption coefficient of water. Rij is an effective reflection coefficient at the same interface (relative intensity of the light propagating in the backward direction at the interface between media i and j, i.e. the interface i/j), accounting for the multiple reflections involving the interfaces j and j + 1. It is given by [26].
with i=j-1, k=j+1, and τj being the optical depth of the jth medium (with τ2 = τ4 = 0 for the optically homogenous and non-absorbing fused quartz). Rij contains the effect of all layers and interfaces to the right of and including the interface i/j. Based on the Fresnel formalism in terms of intensities, the reflection coefficients are given as the squared modulus of the corresponding reflection amplitudes [27]:
where ni and ki are the refractive index and extinction coefficient of the ith medium. For the media 2 and 4, k2 = k4 = 0. For a similar system with no pigmented particles in the aqueous solution, the transmittance is given by
where the reflection coefficients and the effective reflection coefficients (with i or j equal to 3) would be evaluated using the refractive index of the non-pigmented solution ( and ). The optical thickness of the medium between the fused quartz wall is with . Due to the predominantly aqueous nature of the solvent substance and the translucent appearance of the pigmented samples, it is expected to have that and , and consequently and . The approximate relative transmittance is then given by
In the numerator of this previous expression, r32R34 is of the order of 5 × 10⁻⁵, which is at least one order of magnitudes lower than the uncertainty in the transmittance measurements, for the typical values of the fused quartz and water refractive indices through visible wavelengths. In the denominator, the term r32R34•exp(-2τ3) is even slightly lower. Consequently, it has been a good approximation to work with the equation Trl = exp(-τ3) to make a direct inversion of the extinction coefficient, which is in fact Lambert law.
In principle, the light scattering chlorophyll pigmented particle solutions would have an effective refractive index somewhat different to that of the non-pigmented aqueous solution, and that refractive index should enter in the Fresnel formulae to evaluate the reflection coefficients. This method has given better results as compared with evaluations based on the use of the refractive index of the aqueous medium with no light scattering particles [28]. The largest differences between these two ways of evaluation and corresponding optical measurements are displayed for angles of incidence approaching the critical angle [29]. The differences decrease as the size of the scattering units and volume fraction also decreases, and as the angle of incidence tends to zero, which is the illumination condition we are using. We will use the refractive index and extinction coefficient of water (n3 and k3 respectively) to calculate those reflection coefficients where the 2/3 and 3/4 interfaces are involved, with values taken from the literature [30,31]. The refractive index of fused quartz is evaluated from the Sellmeier dispersion formula:
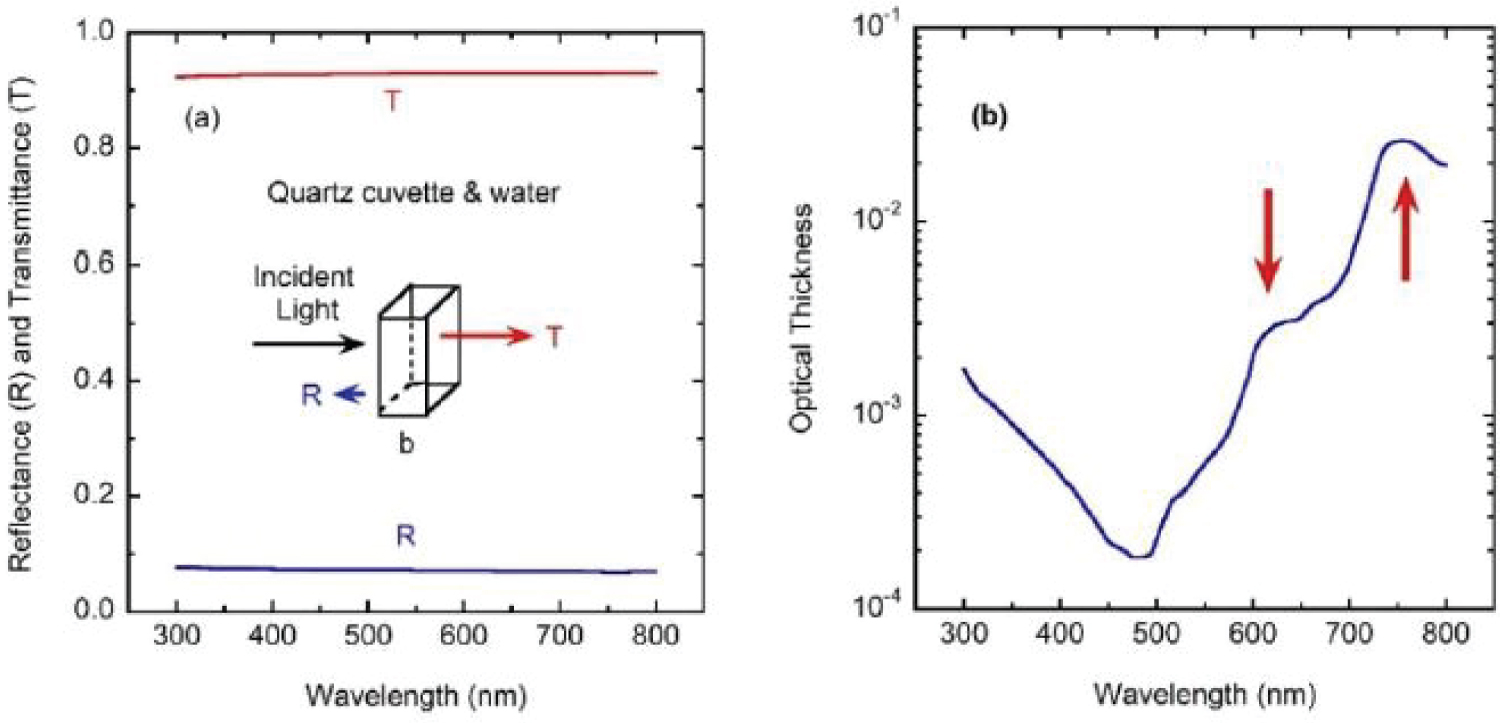
with A1 = 0.6961663, A2 = 0.4079426, A3 = 0.8974794, B1 = 0.0684043 μm2, B2 = 0.1162414 μm2, and B3 = 9.896161 μm2 [32]. This Equation (6) is valid in the spectral range from 0.21 to 3.7 μm, with λ in μm, and n4 = n2. With the previous formalism, we have calculated the reflectance and transmittance spectra of a cuvette containing water (see Figure 6(a)). In particular, the transmittance spectrum will be considered as the reference one (Trf = T) to recalculate the transmittance spectra of the samples containing chlorophyll pigmented grains: Ts = TrfTrl. Figure 6(b) displays the optical thickness of the 1.0 cm thick layer of water contained in the cuvette, whose values are between 1.8 × 10⁻⁴ and 2.6 × 10⁻² for the spectral range considered. The weak absorption bands indicated by arrows are due to absorption by some of the overtones associated with infrared vibrational transitions of the hydrogen atoms [33].
Numerical Inversion of the Transmittance Spectra: Scattering and Absorption Coefficients
Simulated annealing (SA) methods are based on making random changes of the unknown parameter values involved in the model used to build a merit function. This merit function is to be minimized by the SA procedure and its value is analogous to energy in the context of SA methods. Variations giving decreased values of the merit function in comparison to its previous value are accepted, and those giving increased values can be either accepted or rejected; the choice is made through the application of the Metropolis algorithm [34,35]. The acceptance of variations giving positive changes to the merit function, allows these optimization schemes to get out of the neighborhood of local minima of the merit function, and to move towards solutions in the vicinity of the global minimum. As the global minimum is approached, the effective temperature of the system decreases according to the specific scheme that characterizes the SA method being used. Temperature in the context of the present SA method is a measure of the dispersion of the accepted merit function (energy) values corresponding to random variations of the parameters being optimized. These considerations, together with the large initial value of the merit function (which corresponds to a large energy value of the system due to an initial annealing) has led to the use of the word annealing to be associated with this type of optimization methods.
A spectral version of an accepted-probability-controlled simulated annealing (APCSA) method is used to invert the recalculated transmittance spectra [25,36-38]. A pseudocode of our improved non-spectral APCSA method has been given in [39]. A P-vector of Np components is defined to make random variations on its components, as mentioned before. The spectral version of the APCSA approach requires of a NP × N P-matrix instead of a P-vector, where N is the number of spectral points being considered. The Appendix B contains a pseudocode of the spectral APCSA method we are using. The aim is to obtain the spectral variation of those scattering and absorption coefficients per unit length (μsca and μabs) that minimize the difference between measured and calculated transmittance spectra. The merit function is given by
with H = 1/[N-(Np+1)], N = 301, and Np = 2 is the number of parameters being optimized per wavelength. At each spectral point, the values of μsca and μabs are optimized according to the scheme of the SA approach. Tcal(λi) values are given by Equation (1), and corresponding experimental values are those obtained from the product, at each spectral point, of the spectra displayed in (Figure 2) with the fused quartz transmittance spectra shown in (Figure 6).
The APCSA optimization requires a first evaluation of the initially unknown parameters (μsca and μabs). We will obtain them from the corresponding volume cross sections (Csca/V and Cabs/V) evaluated by the Lorenz-Mie (LM) theory [40], by assuming the independent scattering and equal volume approximations. For the quasi-cylindrical shape of the grana [18] (with diameter d~300 nm and height h~400 nm), the diameter of the equivalent spherical particles is D = (3d2h/2)1/3 = 380 nm (see Figure 1(a)). As aforementioned, the height of the grana is between 200 and 600 nm, which means that the equivalent diameter would be between D1 = 300 nm and D2 = 433 nm. We assume a log-normal size distribution around D, with a dimensionless standard deviation Σo = 0.15 which gives diameters between Dmin = D•exp(-Σo) = 327 nm and Dmax = D•exp(Σo) = 441 nm. The LM evaluations require the refractive indices of the particles and of the matrix surrounding them. For the predominantly aqueous embedding matrix, we assume the refractive index of water. For that of the chlorophyll pigmented grains, we will use the model devised by Duniec and Thorne [41]. They obtain the complex refractive index of the assumed spherical particles, ms=ns+iks, from the corresponding dielectric function εs (ms = εs½), where εs is an average obtained by weighting the dielectric functions of the chlorophyll a pigments and of the proteinaceous medium where they are embedded, εc and εp respectively. Namely, εs = fp• εp + (1-fp)• εc. The values fp=0.65 and εp=2.4 are used [41], and the chlorophyll a dielectric function is modeled by a Lorentz model [42] with two resonance absorption bands spectrally located at λ1 = 440 nm (E1 = 2.82 eV) and 2 = 669 nm (E2 = 1.85 eV):
with εo = 1.6, C1 = C2 = 0.3, and γ1 = γ2 = 0.10 eV. Both the Ei and γi parameters have been approached from spectrophotometric measurements. The relations C1 = C2 and γ1 = γ2 have been estimated from the height and width of the absorption peaks displayed in absorbance measurements. The value of high frequency dielectric constant εo, was obtained to fit a value of 2.2 of the dielectric function at microwave frequencies where E/Ei << 1, i.e. εo+C1+C2 = 2.2.
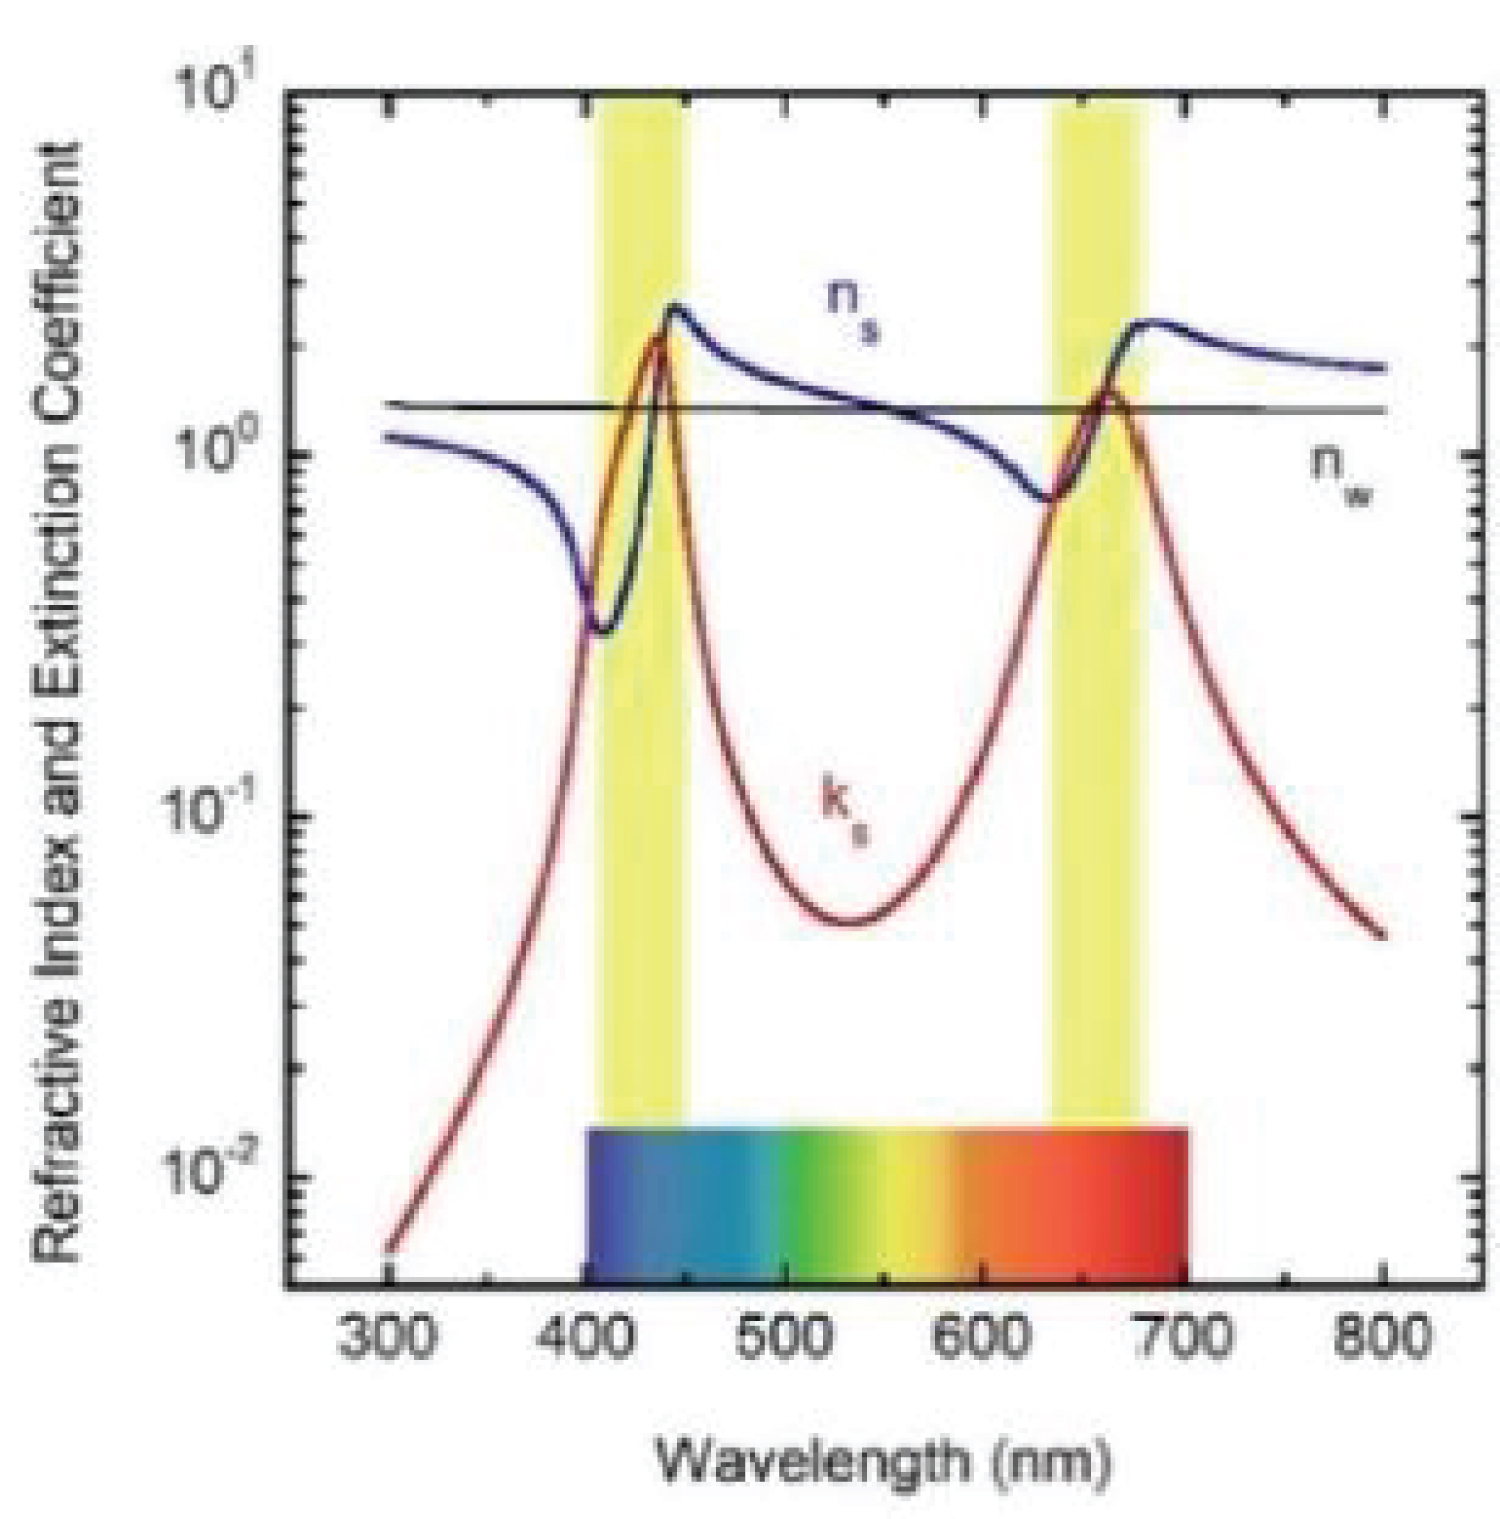
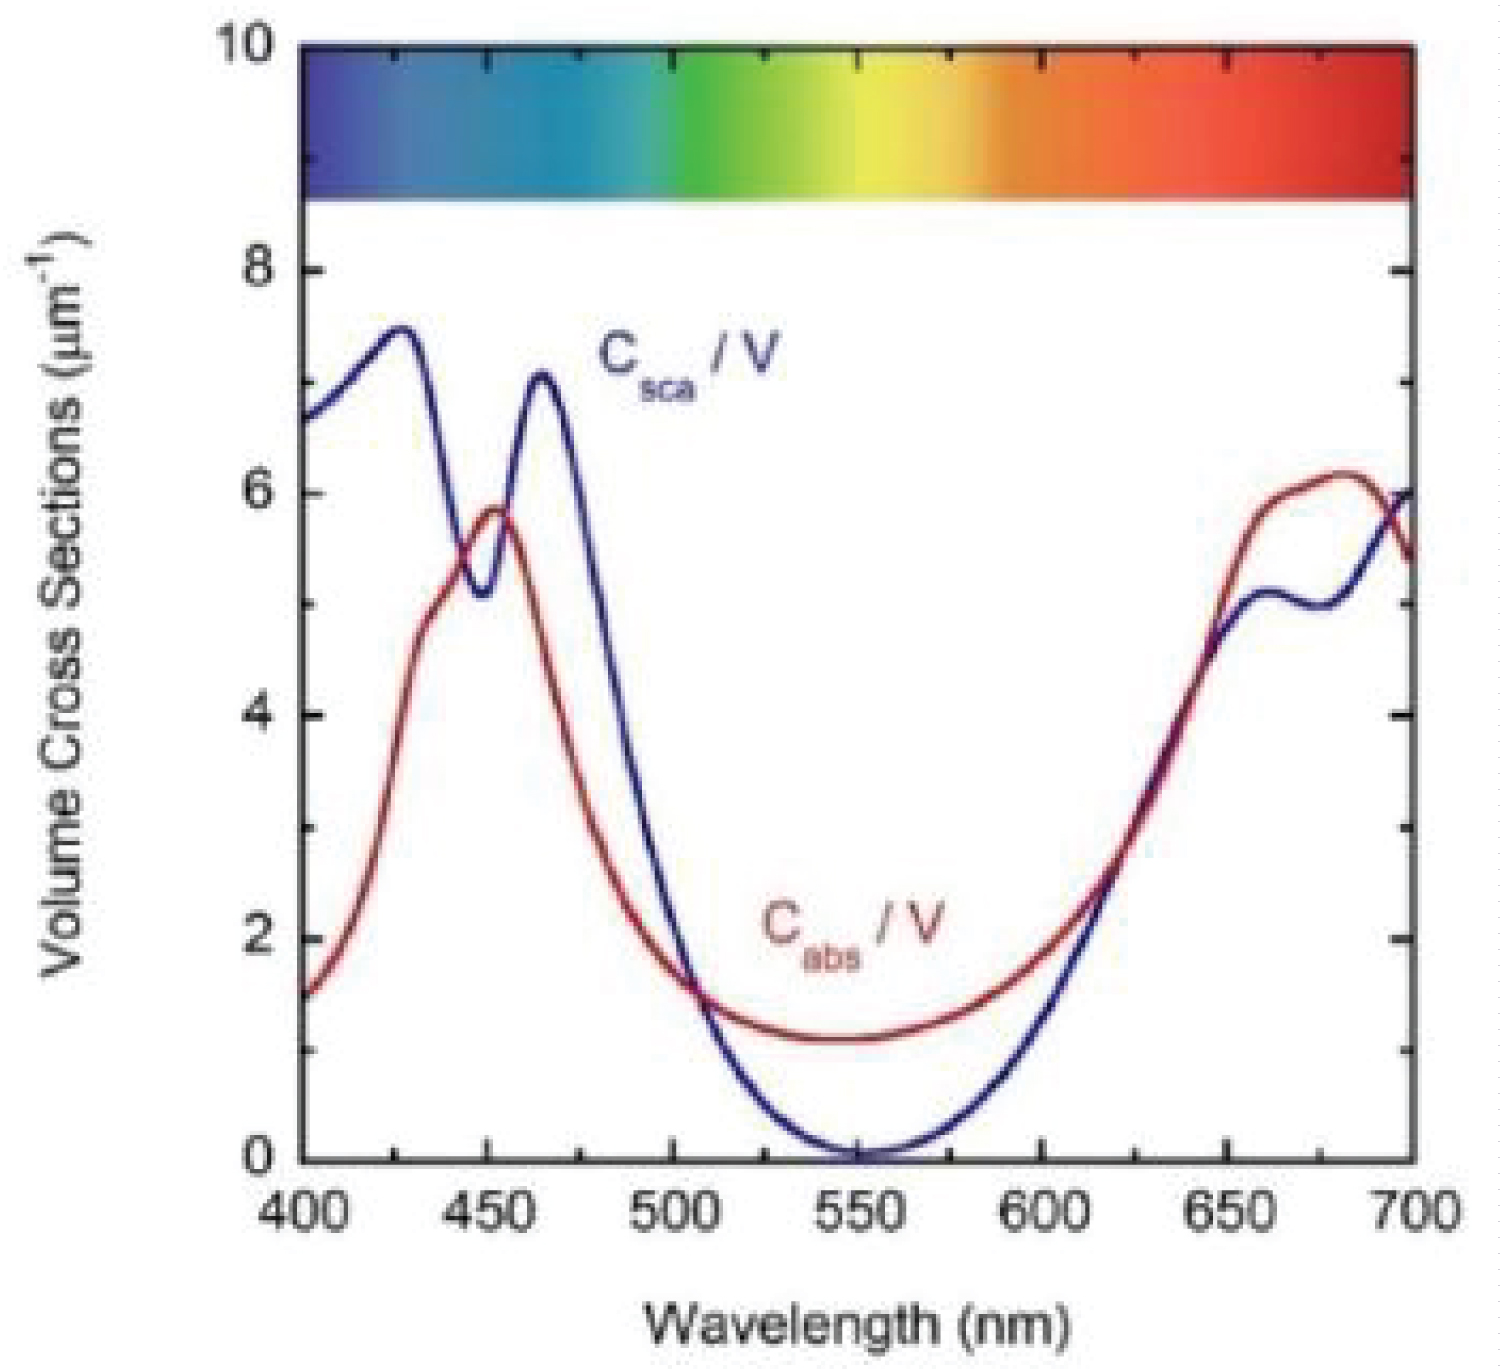
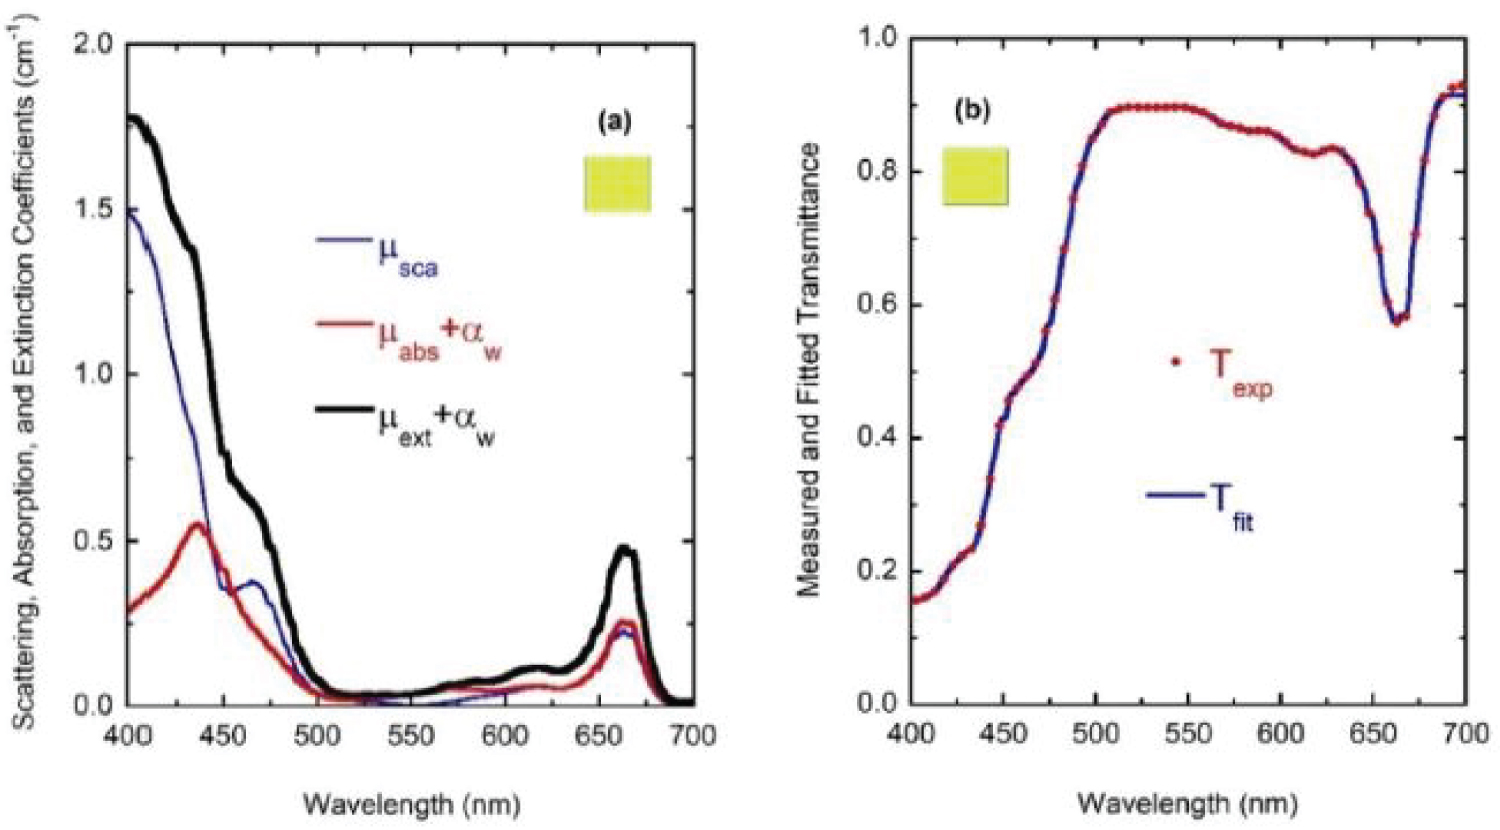
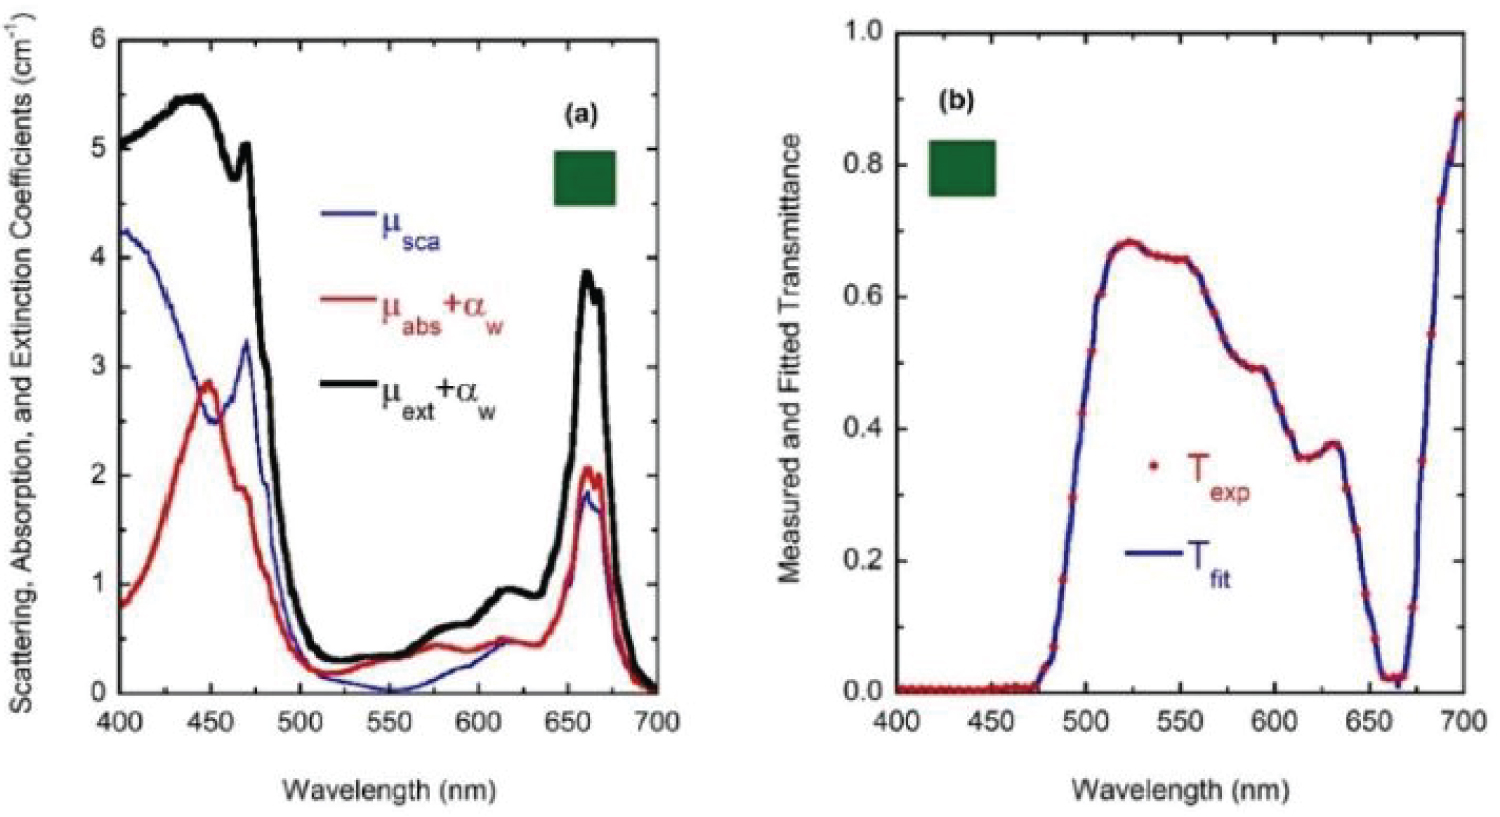
(Figure 7) shows the optical constants of a chlorophyll a pigmented grain evaluated from Equation (8) for energies corresponding mainly to the visible range: From 1.55 to 4.13 eV, with the photon energy given by E = hc/λ where hc = 1240 eV nm with h as Planck's constant and c the speed of light in vacuum. The refractive index of the water (nw) has been included in the figure. The regions of anomalous dispersion, where the refractive index increases with increasing wavelengths and the light absorption reaches its maximum values, have been indicated by yellow bars. Within these anomalous regions, the refractive index of water is equal to that of the pigments at wavelengths of 435 and 655 nm. A third equality is displayed at the middle of the visible (550 nm), where the absorption by the pigmented particles shows minimum values between the two absorption peaks. At 550 nm the scattering is null which means that in terms of the scattering efficiency of the pigmented grains, they are almost invisible for the incoming radiation. From the refractive index of water, the complex refractive index of the pigmented particles, and the size distribution mentioned above, the average-sized volume cross sections of the particles in water have been calculated. (Figure 8) depicts the results. As expected, near the spectral positions where the refractive indices of water and pigments are equal, the volume scattering cross section shows minima, the most significant being that in which absorption of pigments is minimum between the absorption peaks. At long wavelengths, the order of magnitude of Cext/V = (Csca+Cabs)/V is about 10 µm-1, at 660 nm its value is close to 11.0 µm-1. That of the extinction coefficient displayed in Figure 3 for the sample with the largest pigment concentration is 3.85 cm-1. This means that the nominal F-value can be estimated as F 3.5 × 10⁻⁵. We will use this F-value to evaluate the first approximation (within the independent scattering approximation) of µsca and µabs required by the APCSA method, i.e. the two components of the matrix of parameters to be optimized: Po(1,i) = µsca(λi) and Po(2,i) = µabs(λi) with i = 1,2,...,N (see the pseudocode of the APCSA method in [39] and that of Appendix B). We follow a similar optimization process to that applied to obtain the average volume scattering and absorption cross sections of submicron sized anatase (TiO2) particles immersed in a matrix of water containing a dissolved polymer, between two glass slides [25]. The random variations are initially restricted between 2Po/3 and 3Po/2, with mobile boundaries throughout the whole optimization process. The APCSA average volume scattering and absorption coefficients were obtained from averaging 33 runs carried out with different sequences of pseudo-random numbers. Each run consists of 33 solutions which reached the predefined numerical tolerance. From this set of solutions, an average value is calculated for each parameter to have a unique value contributing to the set of 33 average values. Each run was carried out until obtaining merit function values somewhat lower than 5 × 10⁻⁶. (Figure 9) shows the results of the optimization for the sample with the lowest pigment concentration, with µext = µsca + µabs + αw calculated from the optimized values. The largest standard deviations are displayed at the vicinities of the spectral positions of the absorption peaks, being as much as 0.025 cm-1 at short wavelengths and 0.015 cm-1 at long ones. We have added to µabs and µext the small absorption by the water, with αw = (1-f)4πkw/λ, where f = F/8, and kw is the extinction coefficient of water (see (Figure 6b) where αw is proportional to τw). The fitting of the transmittance spectrum, using the average values of µsca and µabs obtained from the set of APCSA solutions, is very satisfactory. The spectral variation of the extinction coefficient per unit length approaches very well that initially obtained from the relative transmittance spectrum (see line a in (Figure 3). The absorption coefficient spectrum contains the characteristic four peaks of chlorophyll a pigments (the largest ones at 436 and 663 nm, and the lowest peaks at 581 and 615 nm).
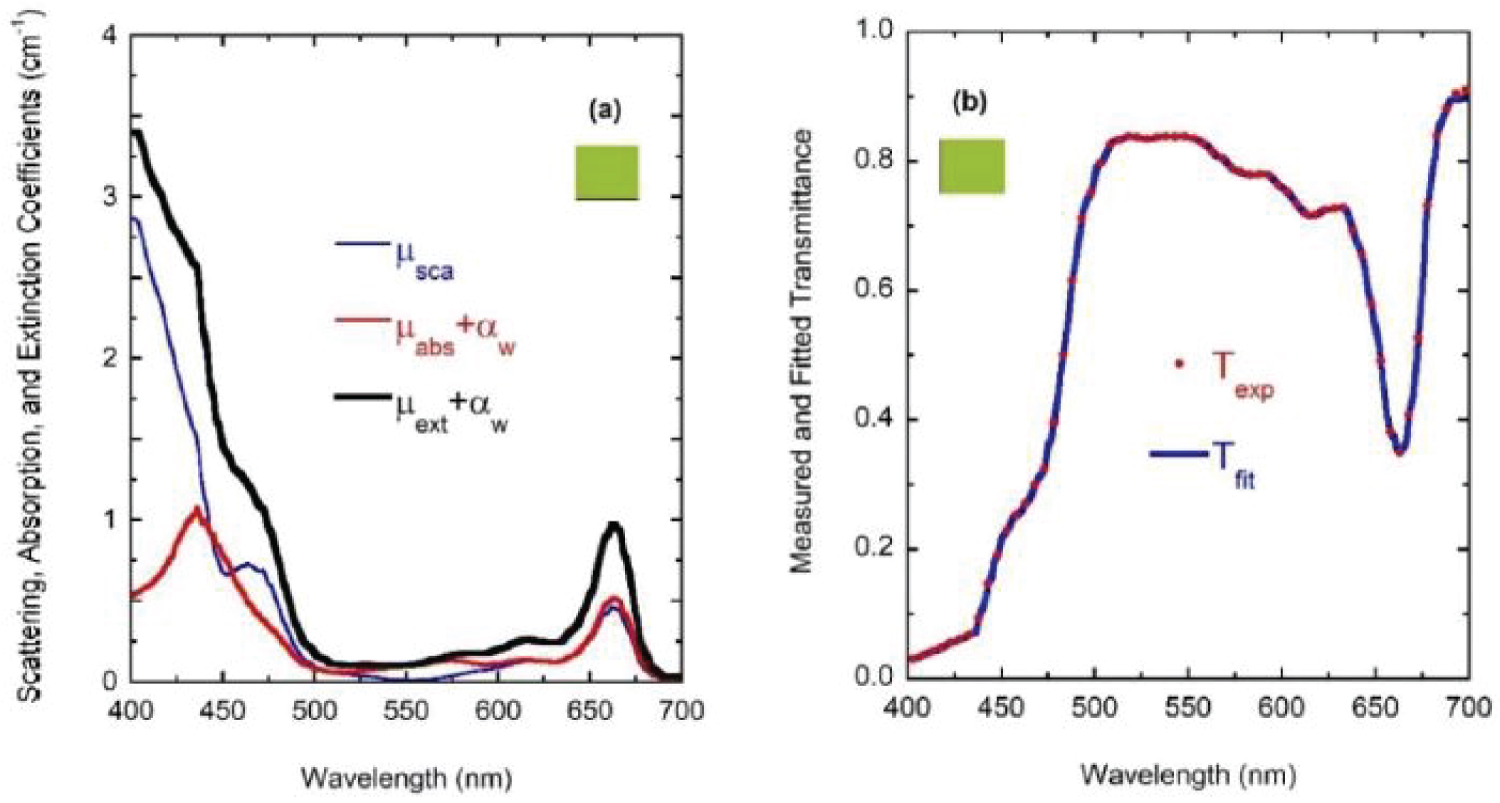
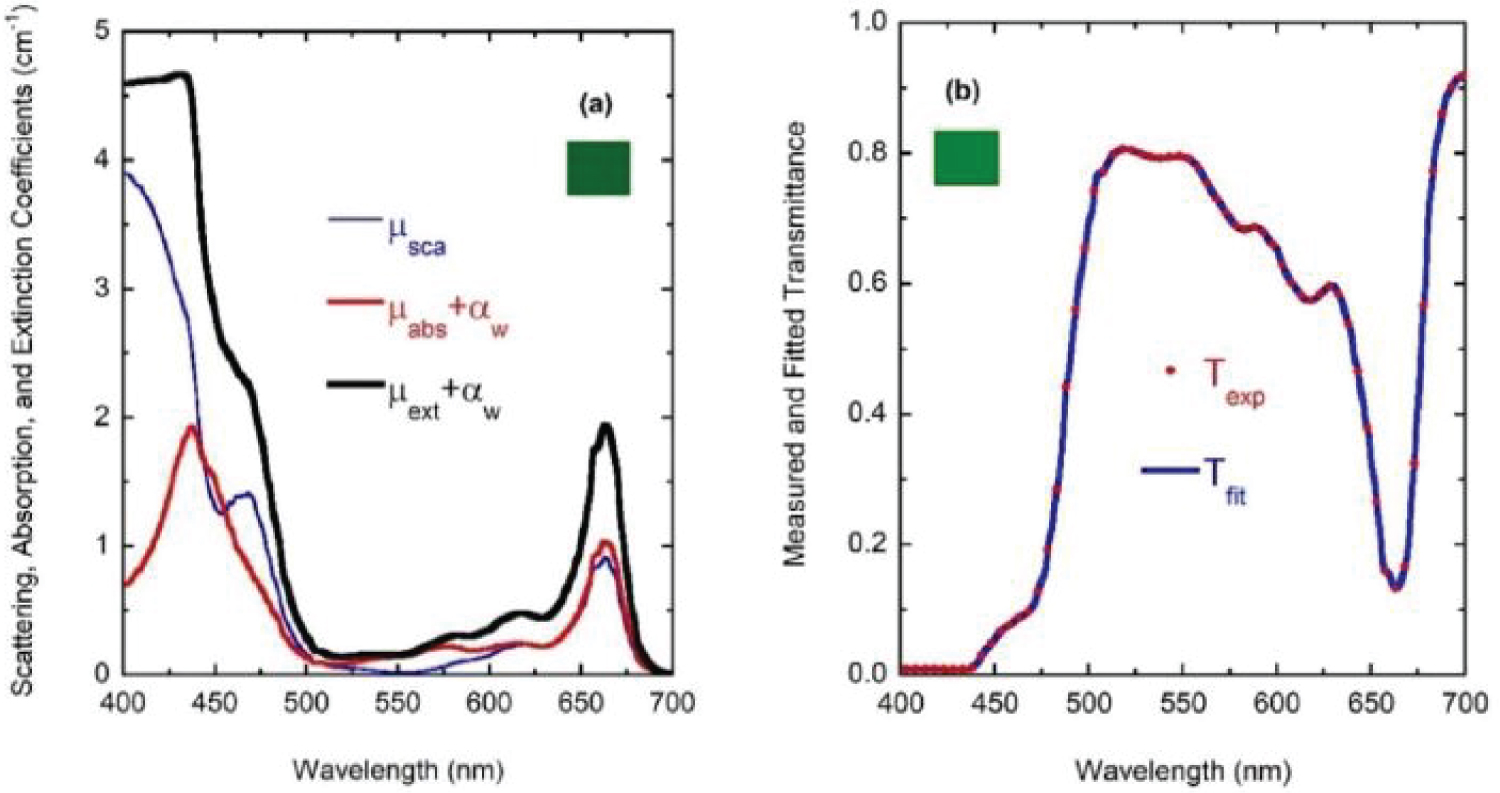
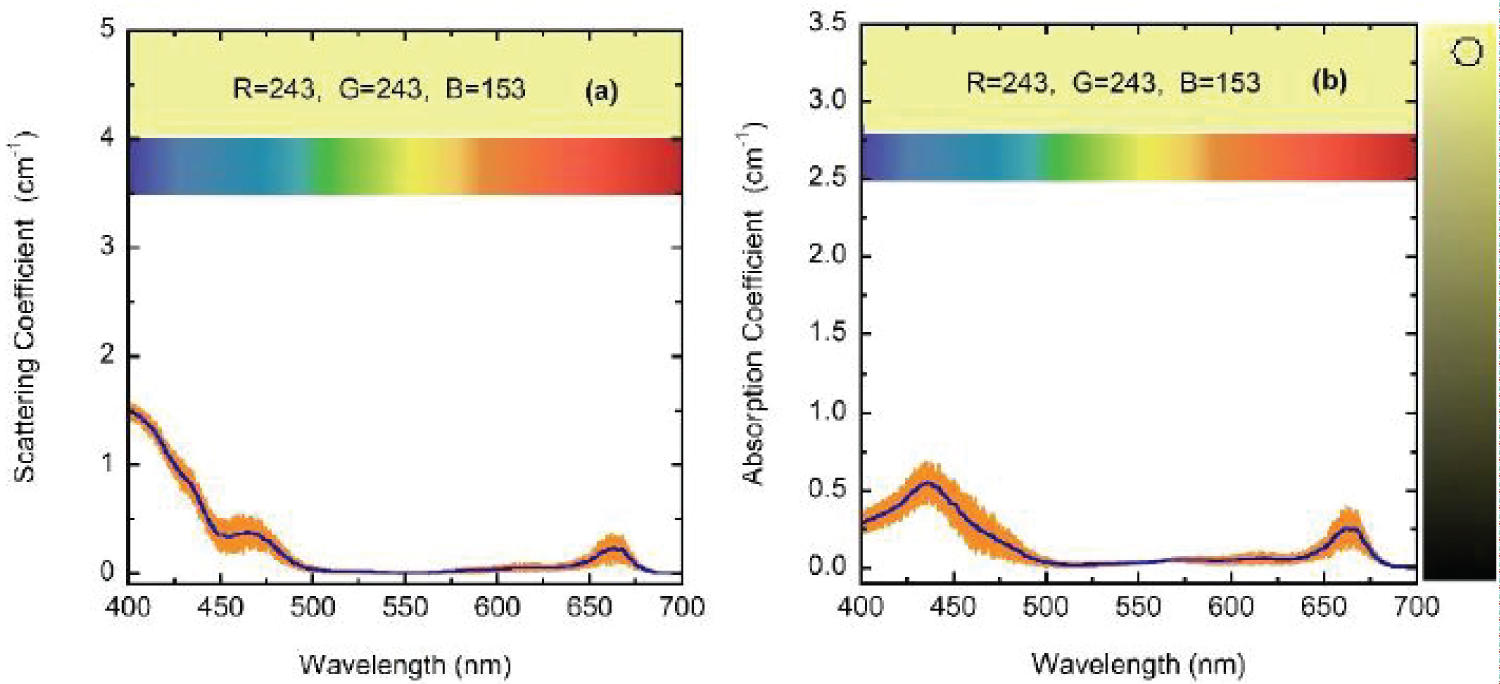
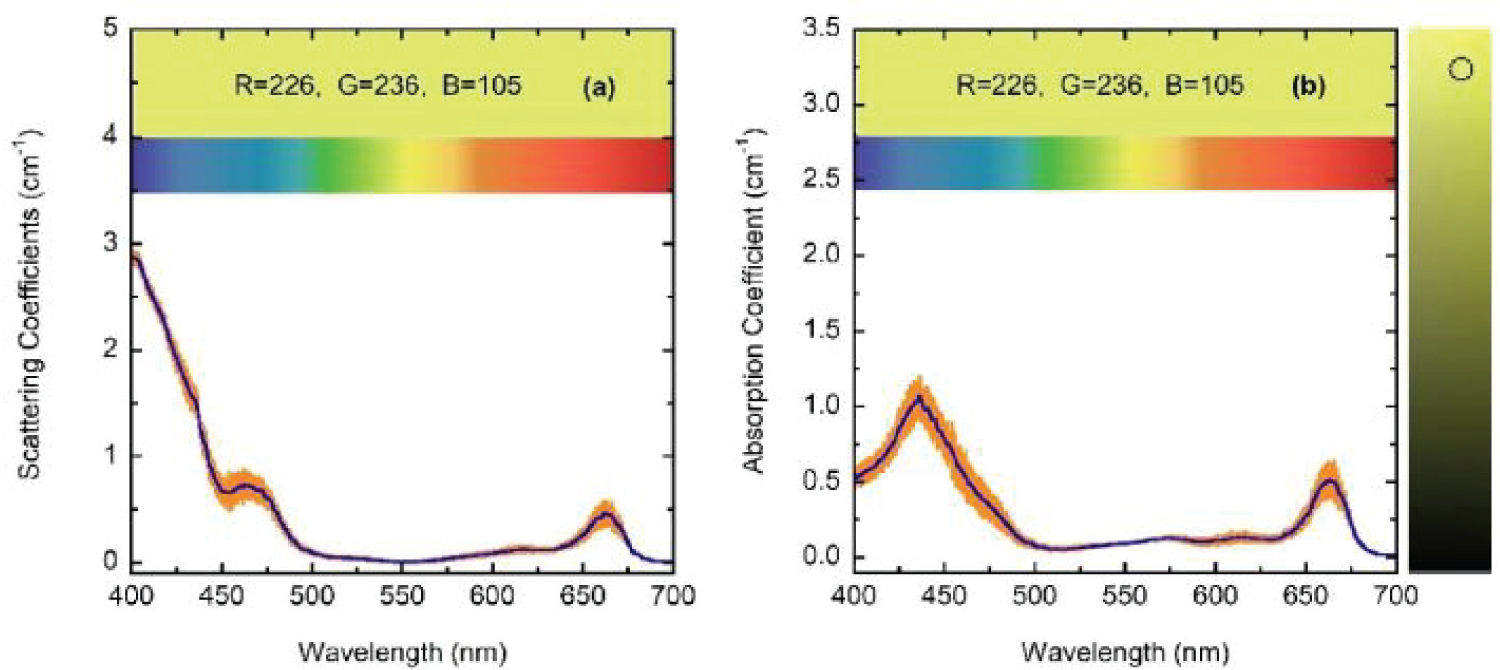
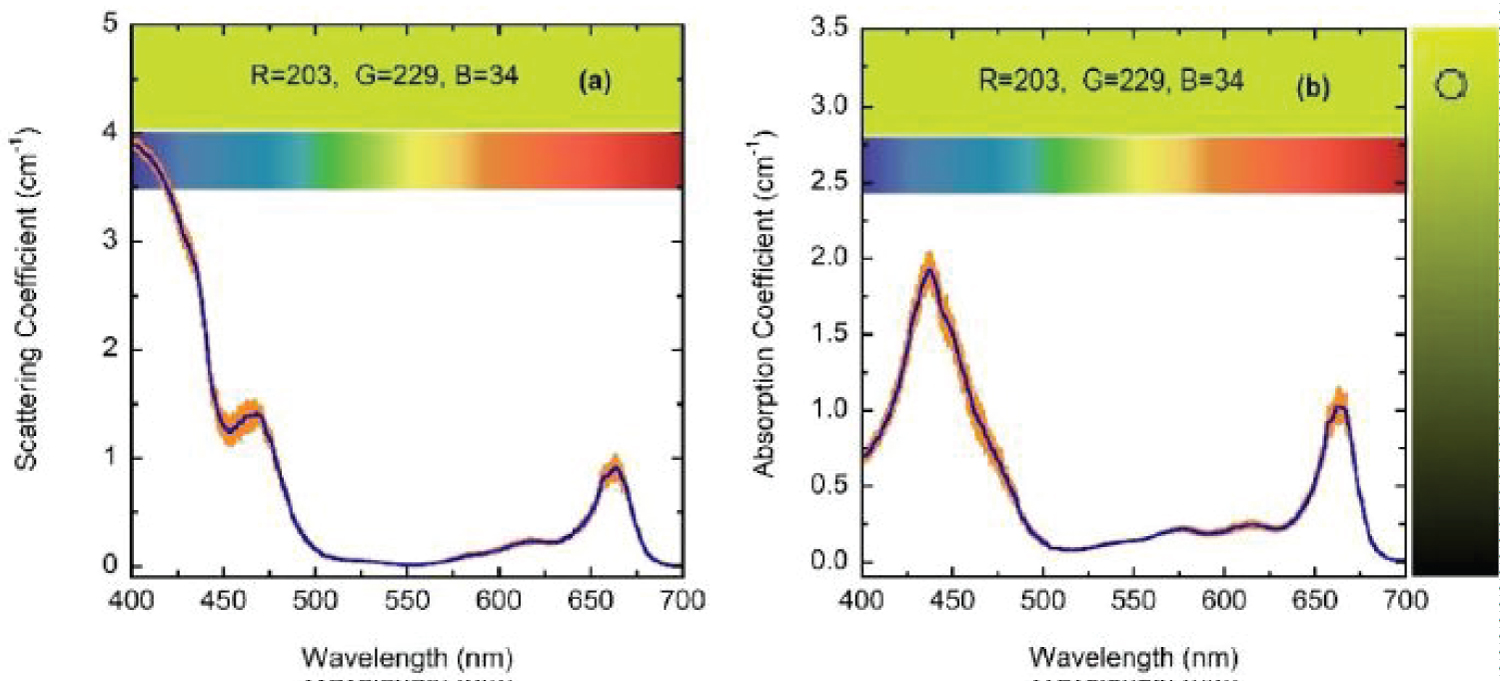
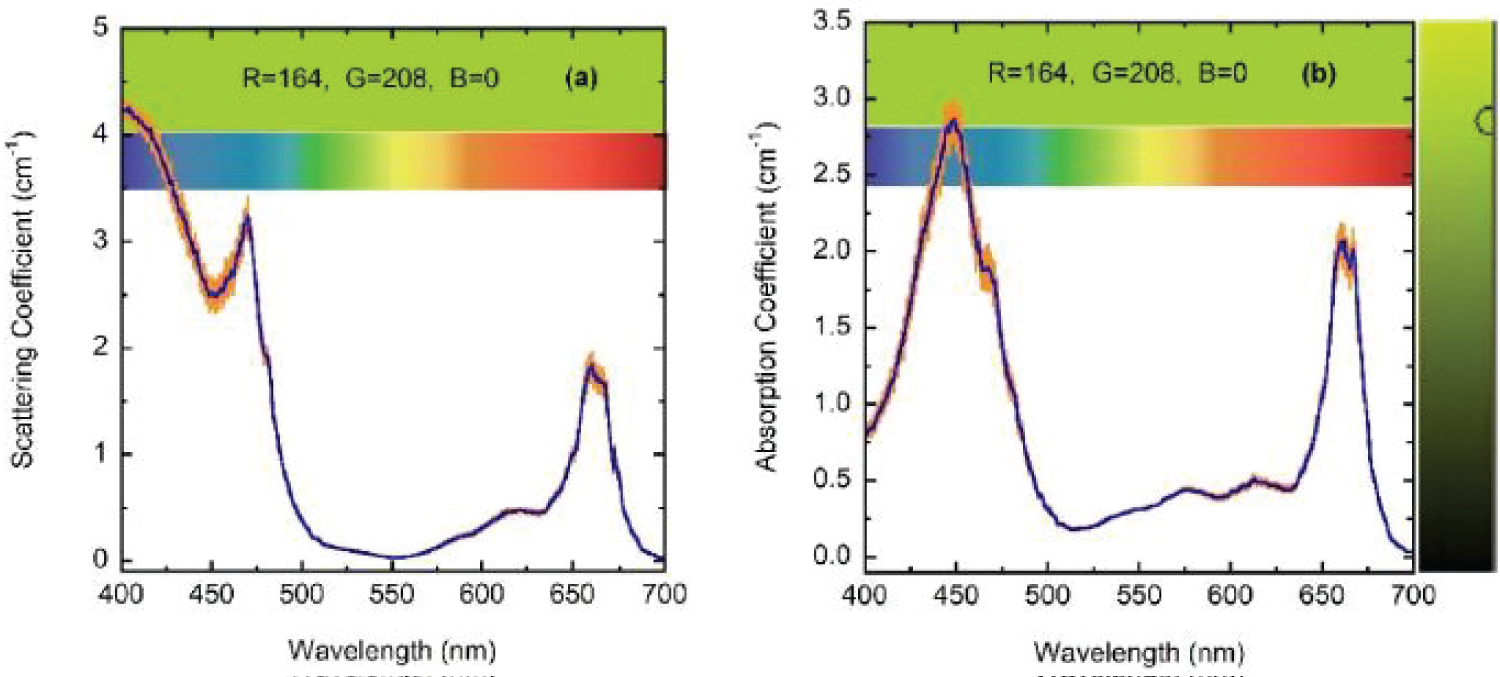
For wavelengths larger than 436 nm, rather similar values of µabs and µsca are displayed. For short wavelengths, at the spectral left side of the highest absorption peak, the extinction by scattering is significantly larger than that by absorption. This finding opens the possibility that some of the results of light absorption by chlorophyll a pigments could have been overestimated, assigning as absorption a fraction really corresponding to scattering due to the presence of submicron-sized thylakoidal structures (see for example Figure 1 in [43]). The shoulder observed at 450 nm of wavelength can be attributed to a spectral point where the refractive index of water is equal to the refractive index of the chlorophyll a pigmented grains. In terms of scattering, in the middle of the visible (at 550 nm) the particles are invisible for the propagating radiation. The solutions for the next higher concentrations, with f = F/4, f = F/2, and f = F also show extinction coefficients which agree very well with those obtained from the direct inversion method (see (Figure 10) and curve b in (Figure 3), and (Figure 11) and curve c in (Figure 3), respectively). For the APCSA solution for the sample with the highest concentration, f = F, the absorption peak at short wavelengths displays a redshift respect to the previous solutions, from 436 to 450 nm. This fact can be attributed to interparticle interactions between neighboring chlorophyll a pigmented grains.
Due to electromagnetic screening, the absorption decreases from what is expected under the independent scattering condition, i.e. the absorption peak should be close to 4 cm-1 instead of about 3 cm-1. On the other hand, the scattering efficiency of the chlorophyll a pigmented grains increases. This variation from the independent extinction regime, at the lower volume fractions considered and through long waves, to dependent extinction at the largest volume fractions and through short wavelengths is displayed in (Figure 12 and Figure 13). The absorption peak at 662 nm shows a linear dependence with the volume fraction occupied by the pigmented grains, while that at 436 nm displays some deviation from the linear behavior. The scattering peak at long wavelength (664 nm) also shows a linear relationship with the concentration of the scattering units. Regarding the standard deviations corresponding to µsca and µabs for the four samples (σsca and σabs, respectively), the Appendix A displays their spectral behavior.
Summary and Conclusions
The spectral variation of the scattering and absorption coefficients per unit length of chlorophyll pigmented grains in an aqueous solution have been obtained, from inversion of transmittance spectra measured for visible wavelengths, when the samples were normally illuminated with non-polarized light. These spectra are correlated with the incidence of collimated radiation and the transmission of collimated light whose intensity is attenuated by scattering and absorption due to the presence of chlorophyll pigmented particles. A first direct inversion allows to obtain the attenuation or extinction coefficients for each one of the four samples considered. A second numerical inversion allows to decouple the contributions of scattering and absorption to the extinction. This task was carried out by means of a simulated annealing method. The absorption coefficient obtained from the optimization process displays its characteristic absorption peaks correlated with the presence of chlorophyll a pigmented grains in the samples. The four samples show independent light scattering through long wavelengths. This is consistent with the variation of the heights of the absorption peaks at the red side of the visible spectrum (at 662 nm). At short wavelengths, the independent scattering regime holds only for those three samples with the lower pigment concentrations, according with the behavior of the absorption peak at 436 nm. The sample with the highest concentration of pigmented grains shows less absorption than that expected under the condition of independent scattering, together with the largest values of the scattering efficiency by the pigmented particles. The inversion formalism reported here has proven to be versatile enough to consider encapsulated samples of biological origin. This approach, which was successfully used in the inversion of reflectance and transmittance spectra through particles of anatase titanium dioxide immersed in an aqueous-polymeric matrix and contained between two glass slides [25], allows to obtain the scattering and absorption coefficients of media containing components of synthetic or biological origin, from light transmittance measurements through quartz cuvettes containing this kind of active media, an experimental setup commonly used in biological, chemical, and microbiological studies as well as in multiple interdisciplinary fields connected with the area of health sciences.
Acknowledgements
The authors thank the support given by the University of Costa Rica to carry out this research work.
References
- Gavdush AA, Chernomyrdin NV, Komandin GA, et al. (2021) Terahertz dielectric spectroscopy of human brain gliomas and intact tissues ex vivo: Double-debye and double-overdamped-oscillator models of dielectric response. Biomedical Optics 12: 69-83.
- Ana Sanchez Cano, Saldaña Díaz JE, Perdices L, et al. (2020) Measurement method of optical properties of ex vivo biological tissues of rats in the near-infrared range. Appl Opt 59: 111-117.
- Touchin V (2007) Tissue optics: Light scattering methods and instruments for medical diagnosis. (3rd edn), SPIE Press, Washington.
- Filatova SA, Shcherbakov IA, Tsvetkov VB (2017) Optical properties of animal tissues in the wavelength range from 350 to 2600 nm. J Biomedical Optics 22: 35009.
- Vogelmann TC (1994) Light within the plant. In: Kendrick RE, Kronenberg GHM, Photomorphogenesis in plants. Springer, Dordrecht, 491-535.
- Eddowes MH, Mills TN, Delpy DT (1995) Monte Carlo simulations of coherent backscatter for identification of the optical coefficients of biological tissues in vivo. Appl Opt 34: 2261-2267.
- Fukshansky L, Fukshansky Kazarinova N, Martinez Remisowsky A (1991) Estimation of optical parameters in a living tissue by solving the inverse problem of the multiflux radiative transfer. Appl Opt 30: 3145-3153.
- Berdnik VV, Mukhamed'yarov RD (2001) Radiation transfer in plant leaves. Optics & Spectroscopy 90: 580-591.
- Pompelli MF, Franca SC, Tigre RC, et al. (2013) Spectrophotometric determinations of chloroplastidic pigments in acetone, ethanol, and dimethylsulphoxide. Brazilian Journal of Biosciences 11: 52-58.
- Lambert JH (1760) Photometria sive de mensvra et gradibvs lvminis, colorvm et vmbrae. Augsburg, Eberhard Klett.
- Beer A (1852) Bestimmung der absorption des rothen lichts in farbigen flüssigkeiten. Annal Physik Un Chem 86: 78-88.
- Bouguer M (1729) Essai d'optique sur la gradation de la lumiere. Paris, Claude Jombert.
- Wood RW (1988) Wood Physical Optics, Optical society of America, Washington.
- Solomon SD, Bahadory M, Jeyarajasingam AV, et al. (2007) Synthesis and study of silver nanoparticles. J Chem Ed 84: 322-325.
- Gaigalas K, He HJ, Wang L (2009) Measurement of absorption and scattering with an integrating sphere detector: Application to microalgae. J Res Natl Inst Stand Technol 114: 69-81.
- Quirós S, Gené JA, Gutiérrez JM, et al. (1992) Effect of bothrops asper (Fer-de-Lance) snake venom on erythrocyte membrane: A comparative study. Comp Biochem Physiol 101C: 433-436.
- Hosikian A, Lim S, Halim R, et al. (2010) Chlorophyll extraction from microalgae: A review on the process engineering aspects. Int J Chem Eng 2010: 391632.
- Shimoni E, Rav Hon O, Ohad I, et al. (2005) Three-dimensional organization of higher-plant chloroplast thylakoid membranes revealed by electron tomography. The Plant Cell 17: 2580-2586.
- Alberts B, Bray D, Lewis J, et al. (1989) Watson molecular biology of the cell. (3rd edn), Garland Publishing, London.
- Sartory DP, Grobbelaar JU (1984) Extraction of chlorophyll a from freshwater phytoplankton for spectrophotometric analysis. Hydrobiologia 114: 177-187.
- Galbán J, De Marcos S, Sanz I, et al. (2007) Uncertainty in modern spectrophotometers. Analytical Chemistry 79: 4763-4767.
- Kume A, Akitsu T, Nishida Nasahara K (2018) Why is chlorophyll b only used in light-harvesting systems? J Plant Res 131: 1-2.
- Li Y, He N, Hou J, et al. (2018) Factors influencing leaf chlorophyll content in natural forests at the biome scale. Frontiers in Ecology and Evolution 6: 64.
- Di Capua R, Offi F, Fontana F (2014) Check the lambert-beer-bouguer law: A simple trick to boost the confidence of students toward both exponential laws and the discrete approach to experimental physics. European Journal of Physics 35: 045025.
- Vargas WE, Wang J, Niklasson GA (2020) Scattering and absorption cross sections of light diffusing materials retrieved from reflectance and transmittance spectra of collimated radiation. J Mod Opt 67: 974-991.
- Rubin M (1982) Solar optical properties of windows. Energy Research 6: 123-133.
- Heavens OS (1991) Optical properties of thin solid films. Dover, London.
- García-Valenzuela A, Sánchez Pérez C, Reyes Coronado A, et al. (2005) Optical characterization of a turbid colloid by light reflection around the critical angle. In: Hernández Pozos JL, Olayo González R, Material Science and Applied Physics: Second Mexican Meeting on Mathematical and Experimental Physics. American Institute of Physics, 62-75.
- García-Valenzuela A, Barrera RG, Sánchez Pérez C, et al. (2005) Coherent reflection of light from a turbid suspension of particles in an internal-reflection configuration: Theory versus experiment. Opt Express 13: 6723-6737.
- Segelstein D, David J (1981) The complex refractive index of water. MSc. thesis, University of Missouri.
- Hale GM, Querry MR (1973) Optical constants of water in the 200 nm to 200 mm wavelength regions. Appl Opt. 12: 555-563.
- Malitson IH (1965) Interspecimen comparison of the refractive index of fused silica. J Opt Soc Am 55: 1205-1209.
- Braun CL, Smirnov SN (1993) Why is water blue? J Chem Ed 70: 612-614.
- Kirkpatrick S, Gelatt CD, Vecchi MP (1983) Optimization by simulated annealing. Science 220: 671-680.
- Metropolis N, Rosenbluth AW, Rosenbluth MN, et al. (1953) Equation of state calculations by bast computing machines. J Chem Phys 21: 1087-1092.
- Rakic AD, Elazar JM, Djurisic AB (1995) Acceptance-probability-controlled simulated annealing: A method for modeling the optical constants of solids. Phys Rev E 52: 6862-6867.
- Djurisic AB, Rakic AD, Elazar JM (1997) Modeling the optical constants of solids using acceptance-probability-controlled simulated annealing with an adaptive move generation procedure. Phys Rev E 55: 4797-4803.
- Rakic AD, Djurisic AB, Elazar JM, et al. (1998) Optical properties of metallic films for vertical-cavity optoelectronic devices. Appl Opt 37: 5271-5283.
- Vargas WE (2017) Dielectric functions of Pd and Zr transition metals: An application of drude-lorentz models with simulated annealing optimization. Appl Opt 56: 1266-1275.
- Bohren CF, Huffman DR (1998) Absorption and scattering of light by small particles. Wiley, New York.
- Duniec JT, Thorne SW (1977) The relation of light-induced slow absorbancy and scattering changes about 520 nm and structure of chloroplast thylakoids - A theoretical investigation. J Bioenergetics & Biomembranes 9: 223-235.
- Oughstun KE, Cartwright NA (2003) On the lorentz-lorenz formula and the lorentz model of dielectric dispersion. Opt Express 11: 1541-1546.
- Jacquemoud S, Bacour C, Poilvé H, et al. (2000) Comparison of four radiative transfer models to simulate plant canopies reflectance: Direct and inverse mode. Remote Sensing of Environment 74: 471-481.
- Bird RE, Hulstrom RL, Lewis LJ (1983) Terrestrial solar spectra data sets. Solar Energy 30: 563-573.
- Hunter RWG, Pointer MR (2011) Measuring Color. Wiley, Malaysia.
- Castellón E, Martínez M, Madrigal Carballo S, et al. (2013) Scattering of light by colloidal aluminosilicate particles produces the unusual sky-blue color of Río Celeste (Tenorio Volcano Complex, Costa Rica). PLoS One 8: e75165.
Corresponding Author
William E Vargas Castro, Centro de Investigación En Ciencia E Ingeniería de Materiales, Universidad de Costa Rica; Academia Nacional de Ciencias de Costa Rica, Costa Rica.
Copyright
© 2021 Quirós Achí S, et al. This is an open-access article distributed under the terms of the Creative Commons Attribution License, which permits unrestricted use, distribution, and reproduction in any medium, provided the original author and source are credited.

