Seasonal and N Supply Effects on 13C Discrimination Isotope Ratio in Wheat Grown Under No-Till
Abstract
Management practices such as no-till (NT) and nitrogen supply affect soil water and nutrient use, thereby affecting wheat grain yields. The 13C/12C ratio or δ13C, expressed as Δ13C discrimination in photosynthesis and wheat dry matter accumulation and yield may also be affected under different N supply and management practices. We utilised the Δ13C values of wheat dry matter at anthesis and grain sampled at harvest grown under conventional till (CT) and NT, applied with 0 and 75 kg N ha-1, over a 5-year period, to assess the water use and water use efficiency (WUE) under variable seasonal conditions and N supply in a semi-arid rain-fed conditions. There were significant seasonal differences in Δ13C (%) values in wheat dry matter at anthesis and wheat grain at harvest, with highest Δ13C discrimination under high water and nitrogen supply. Grain Δ13C values showed greater Δ13C discrimination in the NT than in the CT treatment (NT, 14.57; CT, 14.28; LSD, P < 0.05, 0.16) but no significant effect on anthesis dry matter Δ13C. Application of 75 kg N ha-1 per year resulted in lower grain Δ13C than without N application (0 kg N ha-1, 14.66; 75 kg N ha-1, 14.19; LSD, P < 0.05, 0.16). Grain Δ13C values increased with increase in crop water use only when N was applied. Similarly, Grain Δ13C and grain yields were positively correlated under either high soil N and / or fertiliser N supply. Grain WUE varied from 6 kg ha-1 mm-1 to 18 kg ha-1 mm-1. Similar to grain yield, grain Δ13C values and WUE were positively correlated when N was applied. It is suggested that Δ13C in wheat grain can be used to assess the tillage and fertiliser N treatment effects on WUE in wheat under sufficient N supply but not under limited N supply.
Keywords
Wheat, Grain yield, Water use efficiency, δ13C, Δ13C discrimination, Nitrogen supply, No-till, Conventional till
Abbreviations
CT: Conventional Till; NT: No Till; Δ13C: 13C Discrimination; LSD: Least Significant Difference; WUE: Water Use Efficiency
Introduction
In rain-fed crop production systems, where water supply to crop is limited such as in semi-arid and arid regions under no irrigation, crop yield is a function of water use (WU), water use efficiency (WUE) and harvest index (HI) [1]. It has been shown that C3 plants discriminate against the carbon isotope 13C during C assimilation, resulting in different 13C/12C ratio (δ13C), and hence the C isotope discrimination (Δ13C). The Δ13C has been found to be significantly correlated with grain yield and dry matter production [2-6] and WUE [7] in field-grown wheat.
In fact, Δ13C has been proposed as an indirect selection criterion for improving wheat grain yields [3,8]. However, [9] observed that the correlation between Δ13C and grain yield was either positive or negative depending on the type of environmental conditions. For example, [10] and [4] found poor relationship between Δ13C and wheat grain yield in the Mediterranean environment, possibly due to water stress during the grain filling stage, negative relationship under water stress conditions [9] or even positive relationship with grain yields in non-water stress conditions [2,8,11]. Zhang, et al. [12] found positive relationship between Δ13C discrimination and grain yields under moderate water stress, which frequently occurs in semi-arid rain-fed regions. These inconsistent findings may be due to: (1) analysis of different plant organs (leaf, stem, grain) for Δ13C discrimination, (2) growth cycles (tillering, anthesis, maturity) may be different when plant organs were sampled, (3) water supply ( stored soil water, in-crop rainfall, irrigation) may be different at different stages of plant growth, (4) nitrogen supply or available nitrogen including fertiliser N to plants may be different, and (4) different levels of interaction between water supply and nitrogen supply [13,14].
Management practices such as conventional till (CT) and no-till (NT) affect the amount of water stored in soil and nitrogen mineralised during the clean-fallow period [14]. The NT practice may result in storing 20-30 mm more water than CT practice, especially in the deeper soil layers [15]. Under rain-fed conditions in the semi-arid environments with relatively high rainfall variability, the relationship between Δ13C and WUE and Δ13C and grain yield needs be evaluated over a number of seasons, and different management practices such as tillage and nitrogen supply including that from nitrogen fertilisation. Such investigations should assist us to practise appropriate tillage and N management practices to optimise water use and grain yield in semi-arid rain-fed regions. Therefore, the objectives of our study were to: (i) evaluate the relationship between Δ13C and grain yield and Δ13C and WUE; (ii) assess the effect of tillage practice on Δ13C, WUE and grain yield; and (iii) assess the effect of N fertiliser application on Δ13C, WUE and grain yield over a 5-year period.
Materials and Methods
Site description
A long-term field experiment was established in 1986 at Warra (26 °47'S, 150 °53'E), Queensland, Australia. The soil type is Typic Chromustert or Vertisol and contains 55% clay, 0.7% organic C, 0.07% total N and pH 8.5 in the top 0.1 m depth. Mean maximum temperature in January is 27 °C and mean minimum temperature in July is 12 °C, with a mean annual temperature of 20.7 °C. Long-term annual rainfall at Warra is 600 mm and for the 5-year period, it was 612 mm (485 mm in 1992, 597 mm in 1993, 584 mm in 1994, 725 mm in 1995, and 767 mm in 1996). Sowing to anthesis rainfall during this study varied more than the annual rainfall, 76 mm in 1992, 48 mm in 1993, 11 mm in 1994, 48 mm in 1995, and 61 mm in 1996. Sowing to harvest rainfall values were, 108, 178, 97, 178, and 189 mm in 1992, 1993, 1994, 1995 and 1996, respectively. Plant available water (0-150 cm depth) in soil (0-1.5 m) under NT was 5-25 mm more than that under CT practice [14].
The soil at the experimental site is a Vertisol, Typic Chromusert. The soil analysis was done following the procedures described by [16]. Bulk density was measured using 50 mm diameter core (soil dry weight at 105 °C divided by core volume), soil pH was measured in 1:5, soil: deionised water, clay content was determined by dispersion - sedimentation method, organic C was determined by Walkley-Black chromic acid digestion method, and total N by Kjeldahl method. The properties of the 0-0.1 m soil layer were: bulk density, 1.24 Mg m-3; pH, 8.6; clay content, 560 g kg-1; organic C, 7.4 g kg-1; and total N, 0.72 g kg-1 soil [17]. At the 0-0.1 m depth, soil organic C and total N were not significantly different between CT and NT treatments (Dalal, et al. 1995 reported until 1994; R C Dalal, unpublished data for 1995-1996 period).
Experimental design, treatments and field operations
Dalal, et al. (1995) [17] provided the detailed description of the field experiment. The experiment was established in 1986 in a randomised block design with 4 replications, and continued until 1998. The field experiment consisted of 17 treatments grouped in to five farming systems: legume ley-wheat rotation (4 years - 4 years), legume ley-wheat rotation (1 year - 1 year), grain legume - wheat rotation (1 year - 1 year), continuous conventional tillage wheat + fertiliser N, and continuous no-till + fertiliser N. For this study, the treatments included a combination of tillage practice (CT or NT) and fertiliser N application (0 or 75 kg N ha-1). Wheat (Triticum aestivum L. cv. Hartog) was sown in 0.25 m rows in 6.75 m wide and 25 m long plots at 40 kg ha-1. Urea was applied as N fertiliser at sowing and placed at about 0.05 m depth in alternate mid-rows. During the fallow period (December-April), 2 to 4 tillage operations were carried out in the CT treatment with tined implements to a depth of about 0.1 m for weed control.
Except for the sowing operation, the soil in the NT treatment was not tilled and weeds were controlled by herbicide spray (1.2 L/ha of glyphosate and 1.2 L/ha of 2.4 D-amine), 2 to 4 times during the fallow period.
Sampling and analysis
At anthesis, wheat plants were collected from 0.5 m wide (2 rows) and 1 m long quadrat, dried at 70 °C for 5 days, and weighed. At maturity, wheat was harvested from 1.75 m wide and 22 m long plot by a combine harvester and wheat yield was adjusted at 12% water content. Wheat grain was analysed for N concentration using the Kjeldahl method and the acid digest analysed using automated ammonium analysis [18].
The anthesis plant samples and grain samples were ground to pass 1-mm sieve. The carbon isotopes (12C and 13C) composition, and C concentrations of plant and grain samples were determined using an Isoprime isotope ratio mass spectrometer (GV Instruments GB, IAEA Laboratories, Seibersdorf, Austria). Carbon isotope ratio δ13C (%) in grain samples was calculated as
Where the standard is PDB limestone for 13C (IAEA Laboratories, Vienna, Austria). Carbon isotope discrimination (Δ13C) was calculated as
Where δa and δp are δ13C (%) of air and plant sample, respectively, and δa is taken as - 8% [2].
Soil water was measured gravimetrically from soil samples collected to 1.5 m depth before sowing and after harvest of the wheat crop [19]. WUE (kg grain ha-1 mm-1) of the wheat crop was calculated from grain yield (kg ha-1) divided by WU (mm), where WU by the wheat crop was the difference in soil water (mm) at sowing and harvest, plus in-crop rainfall. Runoff and leaching below the root zone was negligible.
Analysis of Variance (ANOVA) was performed on the data using tillage and N fertiliser as the fixed effects, year as the split plot and replications as random effects [20]. The relationships between different variables were explored by simple linear regression analysis.
Results
Anthesis dry matter and grain yields
Anthesis dry matter yields were 5790, 3400, 2750, 2180 and 4160 kg ha-1 in 1992, 1993, 1994, 1995 and 1996, respectively, in the CT treatment, without N fertiliser application (Table 1). Dry matter yield was increased by N fertiliser application. Overall, dry matter increased by 16.5% in the Ct treatment and 27.5% in the NT treatment from 75 kg N ha-1 application. Tillage practice had no significant effect on anthesis dry matter yields.
Wheat grain yields varied from 1023 kg ha-1 without N application in the CT treatment in 1994 to 4652 t ha-1 with 75 kg N ha-1 application in the NT treatment in 1992. For the 5-year period, mean grain yields were 3948, 1991, 1242, 1137, and 2834 kg ha-1 in 1992, 1993, 1994, 1995 and 1996, respectively. The seasonal conditions (different years), tillage and N treatments affected the wheat grain yields. Consistent responses to N fertiliser application to increasing grain yields (by 30%) were obtained in all years except in 1992, which followed a long fallow for 18 months due to insufficient sowing rainfall received in 1991. Moreover, overall grain yield response to N was higher (30%) in NT than the CT practice (19%) although in 1995 season there was no yield response to N fertiliser application due to growing season dry conditions.
Water use efficiency
Water use efficiency of anthesis dry matter was highest in 1992 (41.9 kg ha-1 mm-1) and lowest in 1995 (15.4 kg ha-1 mm-1). There was no significant effect of tillage practice; however, N fertiliser application increased WUE from 29 kg ha-1 mm-1 without N application to 36 kg ha-1 mm-1 with 75 kg N application, an increase in WUE of 24% due to N application. There were no treatment interaction effects on WUE of anthesis dry matter.
Grain WUE was highest in 1992 in NT with 75 kg N ha-1 application (19.35 kg ha-1 mm-1) and lowest in 1995 in CT with 75 kg N ha-1 application (4.29 kg ha-1 mm-1) (Table 2). Overall, fertiliser N application increased WUE by more than 20% over the 5-year period. However, there was an increase of more than 60% in 1996 from fertiliser N application (7.93 kg ha-1 mm-1 in 0 kg N ha-1 and 12.86 kg ha-1 mm-1 in 75 kg N ha-1 treatment) (Table 2), and a significant year × N interaction. Over the 5-year period, tillage practice had no significant effect on WUE although it tended to be higher in NT than the CT treatment. Also, there was no significant tillage and N interaction and year × tillage × N interaction.
Anthesis dry matter Δ13C
Anthesis dry matter Δ13C values significantly differed among seasons. Highest anthesis dry matter Δ13C values were found in 1996 and lowest in 1995 (16.99% in 1996 and 15.5% in 1995) (Table 3). Over the 5-year period, anthesis dry matter Δ13C values were higher in the NT treatment than the CT treatment. There was significant year × tillage interaction. There was also significant year × N interaction on anthesis dry matter Δ13C values, which were significantly lower in the N fertiliser treatment than without N treatment in 1994, 1995 and 1996 but not in the 1992 season.
Grain Δ13C
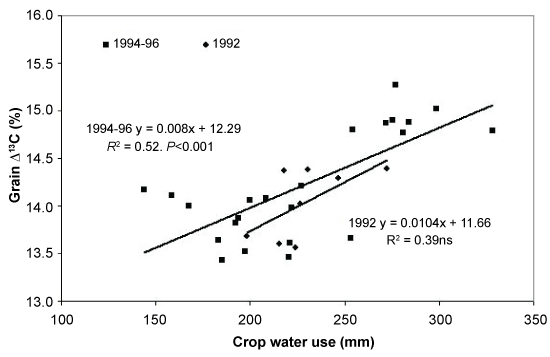
The grain Δ13C values were highest in the high rainfall season in 1996 and lowest in 1995 (15.00% in 1996 and 14.06% in 1995) (Table 4). In fact, grain Δ13C values were significantly correlated with crop water use for the 1994-96 period when N was applied (Figure 1). However, in the absence of N application, grain Δ13C values were not related to crop water use.
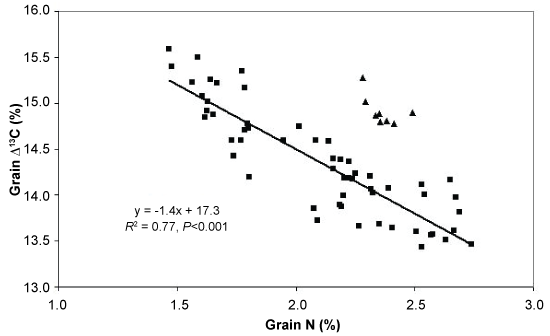
NT practice had higher grain Δ13C than CT practice but N application had lower grain Δ13C than without N application. Significant interaction was found only between year × N treatments. While there was a general trend towards lower grain Δ13C in the N fertiliser than without N treatments, significant lower grain Δ13C values were obtained in 1992 and 1994 only. Overall, however, grain Δ13C values were negatively correlated with grain N concentration (R2 = 0.77, P < 0.001), possibly a reflection of N supply to the crop (Figure 2).
Grain Δ13C and grain yield
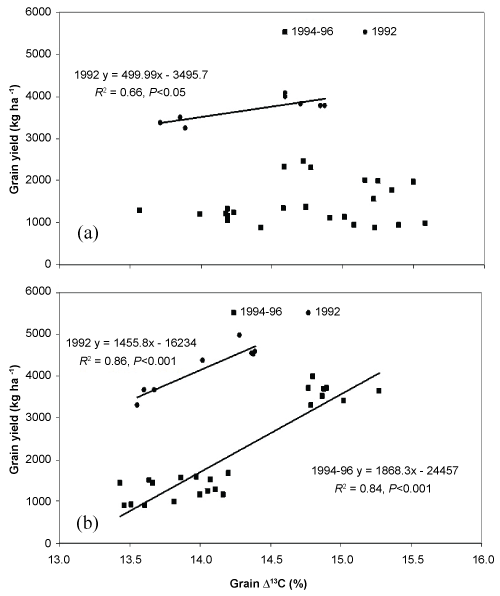
Wheat grain yield was significantly correlated with grain Δ13C in all years under high N supply from soil and /or N application but not when N supply was limited (Figure 3). Thus, high soil N supply coupled with water supply significantly affected grain Δ13C values in wheat (Figure 1 and Figure 3). Under N limited conditions when N was applied (1994-96 period), grain yield increased from 765 kg ha-1 when grain Δ13C was 13.5% to 4500 kg ha-1 when grain Δ13C was 15.5%.
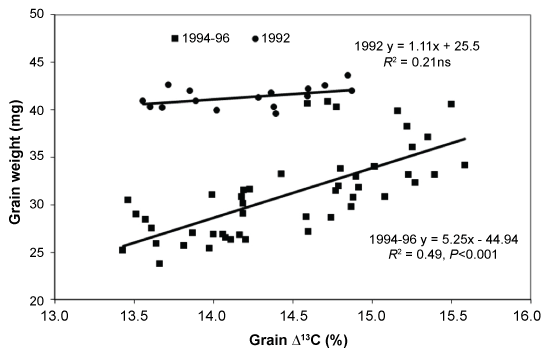
Grain weight was positively correlated with grain Δ13C value (R2 = 0.49, P < 0.001 for all years except 1992 (Figure 4). For example, grain weight increased by almost 40 percent as grain Δ13C value increased from 13.5% to 15.5%.
Grain Δ13C and water use efficiency
Grain Δ13C generally increased with increasing crop water use (Figure 1). Without N application, however, there was no significant relationship between water use and grain Δ13C. Significant relationship between grain Δ13C and water use was found when N was applied, especially when N supply from soil was low (1994-96 period). On the other hand, in 1992 season following drought-forced long clean fallow, when soil N supply was high, no significant relationship between grain Δ13C and water use was found (Figure 1).
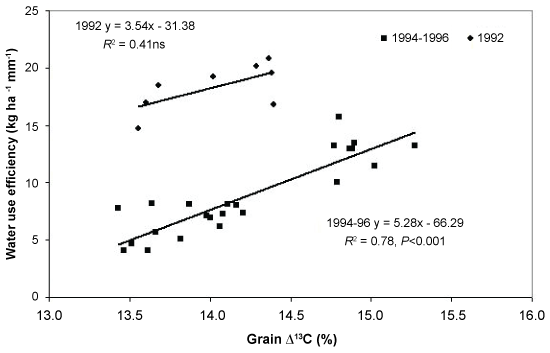
Similarly, WUE and Δ13C values were significantly and positively correlated only when N was applied in initially low N supply seasons (Figure 5). For example, for the 1994-96 period, application of N to soil with limited N supply had significant relationship between grain Δ13C and WUE. Water use efficiency increased from 7.1 kg ha-1 mm-1 at grain Δ13C value of 13.5% to 15.5 kg ha-1 mm-1 at 15.5% Δ13C value. Thus, grain Δ13C values were positively correlated with crop water use, grain yield and WUE when N fertiliser was applied to 1994-96 crops (Figure1, Figure 3 and Figure 5).
Discussion
We found that wheat grain yields were higher under NT practice than the CT practice in moderate seasons (1992, 1995) but had little impact on dry (1994) or wet seasons (1996); however, response to N fertiliser application was more consistent over this period. This was reflected in significant year × N interaction on WUE whereas tillage practice had no effect on WUE. Walley, et al. [21] also found no difference in WUE between NT and CT practices over the 9-year period. We found that WUE varied from as low as 5 kg ha-1 mm-1 (1994-1995 period) to as high as 19 kg ha-1 mm-1 (NT and N75 treatment in 1992). Sadras and Angus (2006) [22] estimated maximum WUE of 22 kg ha-1 mm-1, which is only slightly higher than the highest WUE value in this study. From simulation studies, [23] estimated WUE of 5.8 kg ha-1 mm-1 without fertiliser N application to an average value of 9.7 kg ha-1 mm-1 with N fertilisation in the Mediterranean climate. Our WUE values from subtropical semi-arid region fall within this range, with an identical average value (10.0 ± 1.4 kg ha-1 mm-1 over the 5-year-period). Sadras and Angus (2006) [22] reported an average WUE value of 9.9 kg ha-1 mm-1 for wheat for south-eastern Australia.
Both anthesis dry matter Δ13C and grain Δ13C were affected by tillage practices and fertiliser N application in this study, possibly due to their effects on water and N supply to crop. It may be due to greater carbon isotope discrimination or higher Δ13C values from higher stomatal conductance, that is, higher ratio of intercellular to atmospheric partial pressure of CO2 in the photosynthetic organ [7,24]. Higher stomatal conductance leads to higher photosynthetic rate, and thus to higher dry matter and grain yields [24-27]. However, both stomatal conductance and photosynthetic capacity of the crop are affected by water supply (or vapour pressure deficit) and nutrient supply, especially N supply [2,9,10,24,26,28]. For example, [9] found that the relationship between grain Δ13C and yield varied considerably depending on total rainfall and its distribution. This is because grain Δ13C integrates the effect of stomatal conductance, vapour-pressure deficit, CO2 concentration gradient, and photosynthetic capacity as affected by the nutritional status and the rate of water extraction by the crop. These in turn are affected by the total rainfall and its seasonal distribution, quantity of plant available water in soil at sowing, evapotranspiration rates, and nutritional status [10,26].
In this study, we found positive relationship between grain Δ13C and grain yield of wheat when N fertiliser was applied to soil with relatively limited plant available N supply. These results are similar to those obtained by [3] and [4], who found a positive relationship between grain Δ13C and grain yield, especially under post-anthesis and residual water stress. Zhang, et al. [12] and [6] also reported a positive relationship between wheat grain Δ13C and grain yield under moderate water stress. This is not unexpected since wheat grown in this region frequently experiences post-anthesis water stress. However, when the photosynthetic capacity is limited by N supply to the crop, the relationship between grain Δ13C and grain yield becomes weak, as we found in this study. Furthermore, [12] also found that grain Δ13C values and grain protein were negatively correlated, as we observed in this study between the grain Δ13C and grain N concentration (R2 = 0.77, P < 0.001) (Figure 2).
Similar to our findings, [13] found that wheat grown under N-deficient conditions had little impact on grain Δ13C values and related poorly to grain yield. They further observed that when wheat was grown under high water stress but N application increased yield, similar to 1994-96 period in our study, then applying fertiliser N to N-deficient crop reduced grain Δ13C value, a situation similar to that presented in figure 2. Our observations for the 1992 season in this study are similar to those of [13], that is, under relatively low water stress (long fallowing, full soil water profile) and high plant available N supply, then applying N fertiliser has low impact on grain Δ13C value. Thus, wheat grain Δ13C value can be used to identify both water stress and N responsiveness to wheat grown under rain-fed conditions.
Conclusions
The main conclusions of this study are summarised as follows: (i) Δ13C discrimination showed seasonal differences at both anthesis and harvest; (ii) greatest Δ13C discrimination occurred with high soil water and nitrogen supply, (iii) Grain Δ13C discrimination was greater in no-till than CT; (iv) grain Δ13C discrimination was reduced with nitrogen fertiliser application; (v) grain Δ13C discrimination was increased with water use and water use efficiency only when nitrogen was applied; and (vi) grain Δ13C discrimination and yields were positively correlated with either nitrogen fertiliser application or high soil nitrate-N at sowing.
Acknowledgments
We thank Grains Research and Development Corporation and the Department of Primary Industries, Queensland for funding the field study, and International Atomic Energy Agency, Vienna, Austria, for 13C analysis of plant samples. We thank Peter Bock and Tim Reid for providing the land for the field study, Christine Holmes for field assistance and Judy Glasby and A Pumfrey for analytical assistance.
References
- Passioura JB (1977) Grain yield, harvest index, and water use of wheat. J Aust Inst Agric Sci 43: 117-120.
- Condon AG, Richards RA, Farquhar GD (1987) Carbon isotope discrimination is positively correlated with grain yield and biomass production in field-grown wheat. Crop Sci 27: 996-1001.
- Merah O, Deleens E, Souyris I, et al. (2001) Stability of carbon isotope discrimination and grain yield in durum wheat. Crop Sci 41: 677-681.
- Monneveux P, Reynolds MP, Trethowan R, et al. (2005) Relationship between grain yield and carbon isotope discrimination in bread wheat under four water regimes. Eur J Agron 22: 231-242.
- Misra SC, Shinde S, Geerts S, et al. (2010) Can carbon isotope discrimination and ash content predict grain yield and water use efficiency in wheat? Agric Water Manage 97: 57-65.
- Wang YZ, Zhang XY, Zhang XY, et al. (2016) Soil water regime affecting correlation of carbon isotope discrimination with yield and water use efficiency of winter wheat. Crop Sci 56: 760-772.
- Farquhar GD, Richards RA (1984) Isotopic composition of plant correlates with water-use efficiency of wheat genotypes. Aust J Plant Physiol 11: 539-552.
- Sayre KD, Acevedo E, Austin RB (1995) Carbon isotope discrimination and grain yield for three bread wheat germplasm groups grown at different levels of water stress. Field Crops Res 41: 45-54.
- Condon AG, Richards RA, Rebetzke GJ, et al. (2002) Improving intrinsic water-use efficiency and crop yield. Crop Sci 42: 122-131.
- Tokatlidis IS, Tsialtas JT, Xynias IN, et al. (2004) Variation within a bread wheat cultivar for grain yield, protein content, carbon isotope discrimination and ash content. Field Crops Res 86: 33-42.
- Yasir T A, Min D, Chen X, et al. (2013) The association of carbon isotope discrimination (∆) with gas exchange parameters and yield traits in Chinese bread wheat cultivars under two water regimes. Agric Water Manage 119: 111-120.
- Zhang G, Aiken R, Martin TJ (2015) Relationship between carbon isotope discrimination and grain yield of winter wheat in a semi-arid region. Euphytica 204: 39-48.
- Clay DE, Engel RE, Long DS, et al. (2001) Nitrogen and water stress interact to influence carbon-13 discrimination in wheat. Soil Sci Soc Am J 65: 1823-1828.
- Dalal RC, Strong WM, Cooper JE, et al. (2013) Relationship between water use and nitrogen use efficiency discerned by 13C discrimination and 15N isotope ratio in bread wheat grown under no-till. Soil Tillage Res 128: 110-118.
- Thomas GA, Dalal RC, Weston EJ, et al. (2007) Zero tillage and nitrogen fertiliser application in wheat and barley on a Vertosol in a marginal cropping area of south-west Queensland. Aust J Exp Agric 47: 965-975.
- Rayment GE, Higginson FR (1992) Australian Laboratory Handbook of Soil and Water Chemical Methods. Inkata Press, Melbourne, Victoria.
- Dalal RC, Strong WM, Weston EJ, et al. (1995) Sustaining productivity of a Vertisol at Warra, Queensland, with fertilisers, no-till or legumes 1. Organic matter status. Aust J Exp Agric 37: 903-913.
- Crooke WM, Simpson WE (1971) Determination of ammonium in Kjeldahl digests of crops by an automated procedure. J Sci Food Agric 22: 9-10.
- Strong WM, Dalal RC, Weston EJ, et al. (1996) Sustaining productivity of a Vertisol at Warra, Queensland, with fertilisers, no-till or legumes 2. Long term fertiliser N needs to enhance wheat yields and grain protein. Aust J Exp Agric 36: 665-674.
- Snedecor GW, Cochrane WG (1980) Statistical Methods. In: (7th edn), Iowa State University Press, Ames, Iowa.
- Walley FL, Lafond GP, Matus A, et al. (1999) Water-use efficiency and carbon isotope composition in reduced tillage systems. Soil Sci Soc Am J 63: 356-361.
- Sadras VO, Angus JF (2006) Benchmarking water-use efficiency of rainfed wheat in dry environments. Aust J Agric Res 57: 847-856.
- Asseng S, Turner NC, Keating BA (2001) Analysis of water- and nitrogen-use efficiency of wheat in a Mediterranean climate. Plant Soil 233: 127-143.
- Condon AG, Richards RA (1992) Broad sense heritability and genotype x environment interaction for carbon isotope discrimination in field-grown wheat. Aust J Agric Res 4: 921-934.
- Fischer RA, Rees D, Sayre KD, et al. (1998) Wheat yield progress associated with stomatal conductance and photosynthetic rates, and cooler canopies. Crop Sci 38: 1467-1475.
- Merah OE, Deleens I, Monneveux P (1999) Grain yield, carbon isotope discrimination, mineral and silicon content in durum wheat under different precipitation regimes. Physiol Plant 107: 387-394.
- Araus JL, Villegas D, Aparicio N, et al. (2003) Environmental factors determining carbon isotope discrimination and yield in durum wheat under Mediterranean conditions. Crop Sci 43: 170-180.
- Xu X, Yuan H, Li S, et al. (2007) Relationship between carbon isotope discrimination and grain yield in spring wheat cultivated under different water regimes. J Integ Plant Biol 49: 1497-1507.
Corresponding Author
Ram C Dalal, School of Agriculture and Food Sciences, The University of Queensland, St Lucia Qld 4072, Postal address: DSITI, Science Division, PO Box 5078, Brisbane, Qld 4001, Australia, Tel: +61-7-3170-5766, Fax: +61-7-3170-5801.
Copyright
© 2017 Dalal RC, et al. This is an open-access article distributed under the terms of the Creative Commons Attribution License, which permits unrestricted use, distribution, and reproduction in any medium, provided the original author and source are credited.

