Nitrogen Fertilizer Application Timing Effects on Nitrous Oxide Emissions from Simulated Furrow-Irrigated Rice on a Silt-Loam Soil in the Greenhouse
Abstract
Furrow-irrigation represents a growing alternative water management strategy for rice (Oryza sativa) production. However, optimal nitrogen (N) fertilization rates and timing for furrow-irrigated rice are still in question. Though methane emissions may be minimized without a prolonged flood, concern exists that furrow-irrigated rice may increase nitrous oxide (N2O) production and release from frequent alternating wet and dry soil conditions. This study evaluated the effects of N-fertilization amount and timing [i.e., 100% of the early season optimum N rate plus one split application (OPOS), 50% of the early season optimum N rate plus two split applications (HOPTS), 100% of the early season plus two split applications (OPTS), and an unamended control (UC)] on N2O fluxes and season-long emissions in a greenhouse trial simulating a furrow-irrigated rice production system. Gas sampling occurred approximately weekly throughout the 2020 growing season using the closed-chamber approach. Nitrous oxide fluxes differed among fertilizer-N treatments over time (P < 0.01), yet there was no consistent relationship between mid-season fertilizer-N application timing and the timing of peak N2O fluxes. Nitrous oxide emissions numerically ranged from 0.42 kg N2O ha-1 season-1 from the UC to 0.65 kg N2O ha-1 season-1 from the OPOS treatment, but, in contrast to N2O fluxes, did not differ (P = 0.60) among fertilizer-N treatments. Results indicated that the timing of fertilizer-N application did not influence season-long N2O emissions. This study contributes to the continuing research into the environmental sustainability of rice production.
Keywords
Arkansas, Furrow-irrigated rice, Greenhouse gas emissions, Nitrogen fertilization
Introduction
Rice (Oryza sativa) is a staple food for the largest number of people on Earth, including those countries with the greatest populations, such as India and China [1] and demand for rice is expected to increase [2]. Rice production is the largest, single use of land for producing food world-wide [1,3]. Globally, China cultivates the largest amount of rice [4]. In the United States (US), Arkansas is the largest rice-producing state, where rice production also occurs in California, Louisiana, Missouri, Texas, and Mississippi [5].
Rice is a semi-aquatic grass that is traditionally grown under flooded-soil conditions. Consequently, flood-irrigated rice requires a large amount of water each growing season and surface water or groundwater are the main water sources. In some cases, such as in Arkansas, groundwater needed for irrigation is not being renewed at an equal rate as withdrawals, resulting in aquifer levels declining. Arkansas is a large user of groundwater in the US and withdrawals from the Mississippi River Valley Alluvial Aquifer have caused cones of depression up to 30-m deep [6].
In addition to using large quantities of water, flood-irrigated rice is a primary agricultural source of methane (CH4) emissions. While ebullition and diffusion through the water column can be mechanisms of CH4 release from the soil to the atmosphere, more than 90% of CH4 emissions from a rice field occur through the rice plants themselves by transport through the aerenchyma tissue of the rice stems [7-9]. The plant-mediated transport has caused rice to be the leading CH4-producing cereal crop. Paddy rice cultivation accounts for 9 to 11% of agricultural CH4 production globally and CH4 emissions from rice cultivation are predicted to increase 2% by 2030 [10-11].
The unsustainable nature of current water management practices for rice production in many areas, such as in eastern Arkansas, coupled with the potential environmental implications of CH4 emissions, have caused a need for alternative water management schemes to be developed for rice production to potentially replace the traditional, full-season-flood approach. Furrow-irrigation is one such relatively new, alternative water management practice being used [12-13]. In furrow-irrigated rice, water flows down furrows by gravity next to raised beds where the rice is planted and overlaps the top of the beds to water the rice [12]. Furrow-irrigation avoids purposeful flooding. However, the downslope end of a field will often pond water after some time and behave as if it was flood-irrigated, including stimulating CH4 production and release from prolonged saturated and/or flooded-soil conditions [12].
The development and testing of new production systems will bring a new set of challenges. The main environmental goals for the future of rice production include increasing water-use efficiency, while maintaining yields and decreasing CH4 and nitrous oxide (N2O) emissions, thus decreasing the overall global warming potential (GWP) of rice production systems. In the case of the alternative production methods, less water is applied during the growing season, such that the rice is not under a continuous flood. Research has shown decreased CH4 emissions from rice grown in unsaturated field conditions [14], verifying the fact that the methanogenic process is favored by anaerobic environments and disfavored by oxidizing conditions [8]. However, the relationships among soil water content and production of CH4 and N2O are complex. While tackling the goal of better water-use efficiency and reducing CH4 emissions, studies have also shown that introducing aeration to the soil, by means of periodic wet and dry cycles from implementing furrow-irrigation, may stimulate N2O production [15]. If greater N2O is produced with furrow-irrigation, there is potential for increased N2O emissions over what is produced and emitted from a full-season-flood system. Consequently, the implications of amount and timing of fertilizer-N additions to rice, which are essential for maximum production [13], will be critical to understanding how best to manage furrow-irrigated rice for optimal production as well as minimal greenhouse gas (GHG) emissions.
Urea is the most common fertilizer-N source used in Arkansas due to the large N concentration (46%) and lower cost compared to the other N fertilizers [16]. However, a drawback to urea is the potential for large ammonia (NH3) volatilization losses if not properly managed [16]. If urea is not incorporated into the soil via tillage or irrigation, urease, an enzyme present in the soil, will break down the urea too quickly for plant uptake and/or soil complexation and enhance NH3 production and release [17]. Urea is commonly used in flooded production systems, as urea is highly soluble, but urea is also readily volatilizable, thus should be applied to a dry soil surface. Following urea application, the field is then irrigated with a pulse of water (i.e., flushed) to allow the urea to dissolve and be incorporated into the soil through infiltration, thus controlling volatilization losses [17]. For alternative rice production systems like furrow-irrigation, N-(n-butyl) thiophosphoric triamide (NBPT)-coated urea is preferred [16], where the coating is a urease inhibitor. Although more costly compared to uncoated urea, NBPT-coated urea is able to retard the breakdown of urea until the fertilizer can be incorporated into the soil, while still being able to provide the same N concentration as uncoated urea [16]. In addition to fertilizer-N source, the relationship between fertilizer-N application timing on N2O emissions in rice has also been evaluated, but the results are still unclear, especially with respect to furrow-irrigation [18].
Considering the potential for increased N2O emissions from furrow-irrigated compared to flood-irrigated rice from the greater frequency of wet-dry cycles, varying the amount and/or timing of fertilizer-N additions may provide a means to minimize N2O emissions from furrow-irrigated rice. Alternative water management practices, such as furrow-irrigation, use less water [19] and emit less CH4 than flood-irrigation [19], but the environmental impact with respect to N2O emissions from furrow-irrigated rice is not fully known. Therefore, the objective of this study was to evaluate the effects of N-fertilization amount and timing [i.e., 100% of the early season optimum N rate plus one split application (optimum plus one split, OPOS), 50% of the early season optimum N rate plus two split applications (half optimum plus two splits, HOPTS), 100% of the early season plus two split applications (optimum plus two splits, OPTS), and an unamended control (UC)] on N2O fluxes and season-long emissions and plant response from a silt-loam soil in a greenhouse trial simulating a furrow-irrigated rice production system. It was hypothesized that i) treatments receiving 100% of the early season optimum application (OPOS and OPTS) will have earlier peak N2O fluxes than when half of the early season optimum is applied (HOPTS), ii) greater N2O emissions will come from the two-split treatments (HOPTS and OPTS) due to the greater frequency of N substrate input to induce nitrification followed by denitrification, and iii) plants under the two-split treatments will have greater total N uptake in the plant tissue due to the greater frequency of N substrate during the vegetative phase, but plants under OPOS and HOPTS will have greater total N grain uptake due to the greater amount of N added during the last fertilizer application.
Materials and Methods
Soil collection, processing, and analyses
Soil was collected from the top 10 cm of Dewitt silt loam (fine, smectitic, thermic Typic Albaqualfs) [20] in a field managed for at least the previous five years in a furrow-irrigated rice production system at the Rice Research and Extension Center near Stuttgart, AR. The soil was moist-sieved through a 5-mm mesh screen to simulate conventional tillage (CT), cleaned of any residual vegetation (i.e., roots and crop residue), and air-dried for seven days. Five random sub-samples of the soil were collected for physical and chemical analyses. Air-dried soil was then placed back into buckets until the soil was ready to be placed in the tubs to prepare for the greenhouse experiment.
Soil sub-samples were oven-dried at 70 ℃ for 48 hours, crushed, and sieved through a 2-mm mesh screen. Particle-size analysis was conducted using a modified 12-hr hydrometer method [21]. Soil was prepared in a 1:2 soil mass:water volume suspension for potentiometric measurements of pH and electrical conductivity (EC). Weight-loss-on-ignition after combustion for 2 hr at 360 ℃ was used to determine soil organic matter (SOM) concentration. High-temperature combustion in a VarioMax CN analyzer (Elementar Americas Inc., Mt. Laurel, NJ) [22] was used to determine total carbon (TC) and total N (TN) concentrations. All measured soil C was considered to be organic, as soil did not effervesce upon treatment with dilute hydrochloric acid. Extractable soil nutrients (i.e., P, K, Ca, Mg, Fe, Mn, Na, S, Cu, and Zn) were determined by inductively coupled, argon-plasma spectrophotometry after extraction with Mehlich-3 extraction solution in a 1:10 soil mass:solution volume suspension [23]. Measured TC and TN concentrations were used to calculate the soil C:N ratio. Measured soil nutrient, SOM, TC, and TN concentrations were converted to contents (kg or Mg ha-1) using a 10-cm soil depth and an estimated soil bulk density of 1.11 g cm-3 (described below). Initial soil properties are summarized in Table 1.
Treatments and experimental design
Four fertilizer-N amount and timing treatments were evaluated, including: i) 100% of the total optimum N recommendation (146 kg N ha-1) [24] applied at the 4- to 5-leaf stage, followed by 100% of the recommended mid-season N rate (112 kg N ha-1) applied three weeks after the first application (optimum plus one split, OPOS), ii) 50% of the total optimum N recommendation (78 kg N ha-1) applied at the 4- to 5-leaf stage, followed by 50% two weeks after the first application, followed by 100% of the recommended mid-season N rate applied three weeks after the first application (half optimum plus two splits, HOPTS), iii) 100% of the total optimum N recommendation applied at the 4- to 5-leaf stage, followed by 50% of the recommended mid-season N rate (56 kg N ha-1) two weeks after the first application, followed by 50% of the recommended mid-season N rate applied three weeks after the first application (optimum plus two splits, OPTS), and iv) an unamended control (UC) that received no fertilizer-N addition at any time (Table 2). Each fertilized treatment received a total N application of 258 kg N ha-1 according to current recommendations at the time this study was conducted. Recommendations were based on recent results from field and greenhouse trials conducted in Arkansas [25]. However, because plants were in containers and restricted to an approximate 10-cm soil depth, fertilizer amounts added per tub at each timing were increased by 20% [26-27] for an equivalent total-N application of 310 kg N ha-1 in order to avoid nutrient deficiencies observed in greenhouse trials with shallow soils (< 15 cm). In addition, since the beginning of this study, recommended fertilizer-N rates for furrow-irrigated rice production on a silt-loam soil in Arkansas have decreased as more field research data have been obtained [25]. Consequently, the fertilizer-N rated used in this study do not reflect the current fertilizer-N recommendations for furrow-irrigated rice production on a silt-loam soil in Arkansas.
Three soil tubs (i.e., replications) of each of the four treatments were prepared, for a total of 12 tubs. Tubs were arranged on a single greenhouse bench in a randomized complete block design, where each block contained one replication of each of the four treatments.
Soil tub preparation
On May 16, 2020, air-dried, sieved soil (~ 23,260 g) was evenly distributed, by weight, to a depth of ~ 10 cm into 12 plastic tubs 61.0-cm long by 42.7-cm wide by 19.8-cm tall. Soil in the tubs was then wetted and left to settle for 24 hours. The initial soil bulk density was estimated using the approximate mass of soil in each tub dividing by the approximate volume the soil occupied in the tub (21,000 cm3), which resulted in approximately 1.11 g cm-3.
On May 18, 2020, tubs were manually seeded at a depth of 0.64 cm with the hybrid rice variety 'RT7311CL' (RiceTec, Inc., Alvin, TX). Using the recommended seeding rate for furrow-irrigated, hybrid rice [16], a total of 30 seeds were evenly planted in each tub. Within each tub, three rows of 10 seeds were planted along the length of the tub with 3-cm spacing from the long border of the tub, 8-cm spacing from the short border of the tub, 17-cm spacing between rows, and 4.3-cm spacing between seeds within a row.
Tubs were arranged in a randomized complete block design on a metal bench in the middle of a greenhouse. The greenhouse air temperature was set to be maintained at 30.5 ℃. Neither lights nor heat lamps were used for this greenhouse study.
At 12 days after planting (DAP; May 30, 2020), all tubs were fertilized with triple superphosphate (TSP) at a rate of 19.5 kg TSP ha-1 (2.68 g TSP tub-1) based on the recommended fertilizer-phosphorus (P) rate for hybrid rice grown in a silt-loam soil and using the measured soil-test P concentration (UADA-CES, 2019). At 14 DAP (June 1, 2020), when the plants were at the ~ 3- to 4-leaf stage, one 30-cm-diameter by 30-cm-tall polyvinyl chloride (PVC) base collar was manually installed in each soil tub to a depth of 10 cm, which was roughly the bottom of the soil layer in the tub. Base collars were beveled at the bottom to facilitate installation. Base collars were set in the tubs to contain three rice rows with approximately seven rice plants total in each collar.
At 26 DAP (June 14, 2020), the first fertilizer-N application was made when the rice was at the 4- to 5-leaf stage, approximately 27 days after planting (DAP; Table 2). At 29 DAP (June 17, 2020), potassium (K) was added as muriate of potash [i.e., potassium chloride (KCl)] at a rate of 72.4 kg KCl ha-1 (1.94 g KCl tub-1) based on the recommended fertilizer-K rate for hybrid rice grown in a silt-loam soil and using the measured soil-test K concentration [16]. At 40 DAP (June 28, 2020), the first split application was added to the HOPTS and OPTS treatments (Table 2). At 43 DAP (July 1, 2020), zinc sulfate (ZnSO4) was applied to the plants via a hand-held, spray bottle with a 1:15 (ZnSO4 mass to water volume) solution. Each tub received five sprays, for a total application of approximately 2 mLs of fertilizer solution per tub. Weeds were manually removed as needed throughout the duration of the greenhouse experiment. At 47 DAP (July 5, 2020), the single split application was added to the OPOS treatment, while the HOPTS and OPTS treatments received their second split application (Table 2). Due to the presence of the base collar for gas emissions measurements in each tub, separate fertilizer amounts were prepared for application inside and outside the base collar based on surface area. All applied fertilizers were manually spread as uniformly across the surface area as possible. No fertilizer N was applied throughout the duration of the experiment for the unamended control.
Water content measurements and irrigation
The soil volumetric water content (VWC) within the tubs and base collars was measured daily using a Theta Probe (SM 150, Delta-T Devices Ltd, Cambridge, UK). Two measurements were made within the collar and one was made outside the collar. Based on recent previous reports that soil water contents and redox potential had a greater effect on N2O production than other environmental variables (i.e., soil temperature) [15], an optimal VWC of 0.56 cm3 cm-3 was used as the target VWC for each tub, which was just below saturation of the silt-loam soil used in this study. This nearly saturated water content was specifically used to minimize N2O emissions by keeping the soil redox potential above the point where nitrate-N would be reduced (~ - 200 mV) [15]. However, the soil water content that could be maintained in a furrow-irrigated field would be more variable. The three VWC measurements were averaged and the resulting VWC was converted to a gravimetric water content using the estimated initial soil bulk density (1.11 g cm-3). If the measured water content was lower than optimum, the difference between the target and measured water content was converted to a water volume, which was then applied to the tub to simulate a furrow-irrigated event, hereafter referred to as simply furrow-irrigation, that would affect the up- and mid-slope positions in a production-scale furrow-irrigated rice field.
N2O sampling and analyses
Gas sampling began on June 9, 2020 and occurred approximately weekly throughout the growing season (i.e., 22, 29, 36, 43, 50, 57, 63, 69, 78, 85, 92, 99, 106, 113, and 120 DAP). Gas sampling occurred between 0800 and 0900 hours on a given sample date. A 30 cm-diameter, 10-cm tall PVC cap with a rubber flap at the bottom was placed on top of each base collar and the seam covered with the rubber flap to create a sealed, closed-headspace chamber. Two sets of PVC collar extensions, 40- and 60-cm tall, were used as needed during the growing season to facilitate containment of the rice plants once they began growing taller than the base collar. The extensions were attached using the same method as the PVC cap. The underside of the cap had a 2.5-cm2 fan (MagLev GM1202PFV2-8, Sunon Inc., Brea, CA) to circulate the air in the headspace chamber. A 9-V battery was installed on the top of the cap and connected to the fan by battery straps and wires that passed through the cap without compromising the sealed chamber. Each cap had a 15-cm long, 0.63-cm-inner-diameter copper refrigerator tube mounted horizontally within and on the side of the cap to equilibrate pressure between the headspace chamber and the ambient air. Caps were also equipped with a septum (part #73828A-RB, Voigt Global, Lawrence, KS) inserted into a 12.5-mm-diameter, drilled hole on top of the cap. One cap had an additional septum where a thermometer was used to document the temperature inside the sealed chamber during sampling. Collars, caps, and extenders were covered with reflective aluminum tape (Mylar metallized tape, CS Hyde, Lake Villa, IL) to reduce temperature fluctuations inside the chamber during sampling.
On each sampling day, gas samples were collected at the 0-, 30-, and 60-minute points over the course of 1 hour [28] while the caps sealed the sampling chambers. A 20-mL syringe, equipped with a 0.5-mm-diameter, 25-mm long needle [Beckton Dickson and Co (B-D), Franklin Lakes, NJ], was inserted into the septa to collect 20 mL of headspace gas at each time interval. To allow for an even distribution of gas within the syringe, the syringe was held open for five seconds and then transferred to a pre-capped (20-mm headspace crimp cap; part #5183-4479, Agilent Technologies, Santa Clara, CA), pre-evacuated, 10-mL glass vial (part #5182-0838, Agilent Technologies).
At the beginning of each time interval, the air temperature, relative humidity, and barometric pressure were measured with a portable meteorological station (S/N: 182090284, Control Company, Webster, TX). The height of each chamber (collar plus cap) was also measured from the soil surface or from the top of any temporarily ponded water, if present, to determine the volume of the chamber. After each sampling, the caps, extenders, and rubber stoppers were removed from the base collars until the next gas sampling date.
Vials with collected gas samples were stored at room temperature and analyzed within 48 hours of gas collection. The gas samples were analyzed with a Shimadzu GC-2014 ATFSPL 115V gas chromatograph (GC; Shimadzu North America/Shimadzu Scientific Instruments Inc., Columbia, MD). One set of gas standards was collected in the greenhouse and analyzed for quality control. Each set of standards included concentrations of 0.1, 0.5, 1, 5, and 20 mg N2O L-1. Nitrous oxide concentrations were measured with an electron capture detector (ECD). Argon gas was used as the reference gas for the ECD and helium gas was used as the carrier gas for sample analysis.
Nitrous oxide fluxes (mg m-2 hr-1) for each gas chamber were determined using the change in gas concentrations over the three, 30-min gas sampling intervals (0, 30, and 60 min) as had been done in recent, previous rice studies conducted in Arkansas [15,17,29-33]. To calculate the flux for each chamber, the volume of the chamber was multiplied by the slope of the linear regression best-fit line between the gas concentrations and time intervals and then divided by the surface area of the chamber. Using linear interpolation between fluxes, seasonal emissions (kg ha-1 season-1) were calculated on a chamber-by-chamber basis.
Plant sampling and analyses
At the end of the growing season, all rice plants within the base collar were cut within 2 cm of the soil surface and bagged. The plant roots from each tub were manually separated by washing soil from the roots. All plant matter samples were dried at 55 ℃ for five days and weighed to determine above- and belowground dry matter. The grain from each aboveground dry matter sample was manually separated and weighed to determine oven-dry yield. A subsample of the grain was pulverized to a powder and analyzed for TN concentration by high-temperature combustion using a VarioMax CN analyzer (Elementar Americas Inc., Mt. Laurel, NJ). Once rice grains were removed, a subsample of the remaining aboveground dry matter sample as well as a subsample of the belowground dry matter sample were ground and sieved through a 1-mm mesh screen and analyzed for TN concentration by high-temperature combustion using a VarioMax CN analyzer (Elementar Americas Inc., Mt. Laurel, NJ). Nitrogen uptake was calculated separately for the above- and belowground plant and oven-dried grain tissue as the product of the dry matter times the measured tissue N concentration on a chamber-by-chamber basis. Total plant dry matter was calculated as the sum of the dry matter from the above- and belowground plant material plus the grain. Total plant N uptake was calculated as the sum of the N uptake from the above- and belowground plant material plus the grain. Grain yield was corrected to a moisture content of 12% for reporting. Nitrous oxide emissions intensity was also calculated by dividing the season-long N2O emissions by the moisture-adjusted grain yield on a chamber-by-chamber basis and was expressed as kg N2O Mg seed yield-1.
Statistical analyses
Based on a randomized complete block design, a two-factor analysis of variance (ANOVA) was conducted using the PROC GLIMMIX procedure in SAS (version 9.4, SAS Institute, Inc., Cary, NC) to evaluate the effects of fertilizer-N treatment, sample date, and their interaction on N2O fluxes over the growing season. A one-factor ANOVA was conducted using the PROC GLIMMIX procedure in SAS to evaluate the effects of fertilizer-N treatment on season-long N2O emissions, above- and belowground dry matter, N concentration, and N uptake, moisture-adjusted grain yield, grain N concentration, grain N uptake, total plant dry matter and N uptake, and emissions intensity. A beta distribution was used for above- and belowground and grain N concentrations, while all other parameters were analyzed with a gamma distribution. Significance was judged at P < 0.05, thus, when appropriate, treatment means were separated by least significant difference at the 0.05 level.
Results and Discussion
N2O fluxes
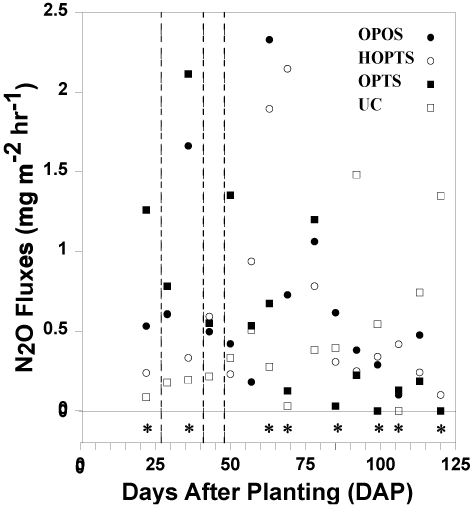
General trends: In contrast to Slayden, et al. (2021), who quantified N2O fluxes in the field during two consecutive years from furrow-irrigated rice grown on a silt-loam soil in a production-scale field in east-central Arkansas [34], and Rector, et al. (2018a,b) [31-32], several visual temporal trends in N2O fluxes occurred among fertilizer-N treatments throughout the 2020 growing season (Figure 1). Both the OPOS and HOPTS treatments had low N2O fluxes at the beginning, fluxes numerically increased during the middle, and had low fluxes again at the end of the growing season (Figure 1). Nitrous oxide fluxes from the OPTS treatment fluctuated during the season, with numerically large fluxes primarily in the first half compared to the second half of the season (Figure 1). In contrast, the UC treatment experienced low N2O fluxes in the beginning and generally numerically increasing fluxes towards the end of the growing season (Figure 1). Of the 60 total measured fluxes, 11 fluxes were greater than 1 mg m-2 hr-1 and only two fluxes were greater than 2 mg m-2 hr-1 (Figure 1).
Fertilizer-N treatment effects: Nitrous oxide fluxes differed among fertilizer-N treatments over time (P < 0.01; Table 3). Of the 60 total measured N2O fluxes, 42 fluxes differed from a mean flux of zero (Table 4). Peak N2O fluxes for OPOS, HOPTS, OPTS, and UC were 2.3, 2.1, 2.1, and 1.5 mg m-2 hr-1, respectively, which did not differ from one another (Table 4), and occurred at 63, 69, 36, and 92 DAP, respectively (Figure 1). There was no identifiable trend between mid-season fertilizer-N application timing and the timing of peak N2O fluxes. The lowest N2O fluxes for all four treatments occurred later in the growing season than the timing of peak fluxes (Figure 1). The lowest N2O fluxes (< 0.01 mg m-2 hr-1) occurred at 106 DAP for the UC treatment and at 99 and 120 DAP for the OPTS treatment (Figure 1). The lowest N2O fluxes for the OPOS and HOPTS occurred on the last sampling day (120 DAP) and measured < 0.01 and 0.10 mg m-2 hr-1, respectively (Figure 1).
Across the 15 sampling dates, N2O fluxes differed significantly (P < 0.05) among treatments on eight dates (i.e., 22, 36, 63, 69, 85, 99, 106, and 120 DAP; Figure 1 and Table 4). At 22 DAP, the mean N2O flux was numerically largest from the OPTS, which did not differ from that of the OPOS and HOPTS, and was 14 times greater than that of the UC treatment, which did not differ from that of the OPOS and HOPTS treatments (Figure 1 and Table 4). At 36 DAP, the mean N2O flux was also numerically largest from the OPTS, which did not differ from that of the OPOS and HOPTS, and was 11.1 times greater than that of the UC treatment, which did not differ from that of the HOPTS treatment (Figure 1 and Table 4). At 63 DAP, the mean N2O flux was numerically largest from the OPOS, which did not differ from that of the OPTS and HOPTS, and was 8.3 times greater than that of the UC treatment, which did not differ from that of the HOPTS and OPTS treatments (Figure 1 and Table 4). At 69 DAP, the mean N2O flux was numerically largest from the HOPTS, which did not differ from that of the OPOS, and was at least 16.5 times greater than that of the UC and OPTS treatments, which did not differ (Figure 1 and Table 4). At 85 DAP, the mean N2O flux was numerically largest from the OPOS, which did not differ from that of the HOPTS and UC, and was 21 times greater than that of the OPTS treatment (Figure 1 and Table 4). In stark contrast to the other sample dates, at 99 DAP, the mean N2O flux was numerically largest from the UC, which did not differ from that of the OPOS and HOPTS, and was at least 54 times greater than that of the OPTS treatment (Figure 1 ad Table 4). At 106 DAP, the mean N2O flux was numerically largest from the HOPTS, which did not differ from that of the OPOS and OPTS, and was at least 42 times greater than that of the UC treatment (Figure 1 and Table 4). Similar to at 99 DAP, at 120 DAP, the mean N2O flux was numerically largest from the UC and was at least 13.5 times greater than that of the OPOS, HOPTS, and OPTS treatments, which did not differ (Figure 1 and Table 4).
Within the first nine sample dates, the OPTS treatment had the numerically largest N2O flux five times among the three N-fertilized treatments, while the HOPTS treatment had the numerically lowest flux four times (Figure 1 and Table 4). The OPOS treatment was also numerically greater than the HOPTS five times out of the first nine sampling dates. By increasing the N applied to a tub, the amount of usable substrate for nitrification and denitrification also increased. Therefore, because the OPTS had twice as much N applied as the HOPTS treatment for the first fertilizer application, the OPTS treatment began with a greater amount of N substrate for N2O production that could be available throughout the first half of the growing season. Subsequently, the OPOS and HOPTS treatments had greater fluxes than the OPTS treatment for the last six sampling dates likely due to the greater N application (7.6 and 7.5 g urea tub-1, respectively) added to the two treatments at the latest fertilization-N application (Table 2).
In a recent 2019 field study, Karki, et al. (2021) evaluated N2O emissions from furrow-irrigated rice with and without cover crops [35] in a Sharkey silty-clay soil (Chromic Epiaquerts) [36] in northeast Arkansas . The furrow-irrigated treatment without cover crops was fertilized with urea in a three-way split of 82 kg N ha-1 prior to the first irrigation, 82 kg N ha-1 nine days after the first irrigation, and 50 kg N ha-1 16 days after the first irrigation, for a total of 214 kg N ha-1 [35]. Karki, et al. (2021) reported peak N2O fluxes approximately one week after the first mid-season fertilizer-N application [35]. The peak N2O fluxes from the three-way split, furrow-irrigated treatment were 1.5 to 2.3 times greater in the more aerated up-slope position, but 2.5 to 4.0 times lower in the down-slope position [35] compared to the peak fluxes measured across all four fertilizer-N treatment in the current greenhouse study.
Similar to Karki, et al. (2021) [35], Slayden, et al. (2021) measured N2O fluxes in the field throughout the 2018 and 2019 growing seasons from hybrid (214-Gemini in 2018 and CL7311 for 2019) rice cultivars grown with optimal N fertilization (i.e., 168 kg N ha-1 total) under CT and no-tillage (NT) and at up-, middle-, and down-slope field positions in a furrow-irrigated production system on a silt-loam soil (Typic Albaqualfs) in east-central Arkansas [34]. Peak N2O fluxes from the current greenhouse study were most similar to peak fluxes measured under NT in 2019, which were the lowest peak fluxes experienced for both the 2018 and 2019 growing seasons [34]. However, peak N2O fluxes in 2018 ranged from 1.7 to 6.6 times greater and up to 3 times greater in 2019 than the peak N2O fluxes measured from the current greenhouse study. The lower fluxes measured in the current study compared to Karki, et al. (2021) and Slayden, et al. (2021) were most likely attributable to the small-scale, controlled environment of the greenhouse that alleviated large soil moisture fluctuations from variable water additions from rainfall and/or irrigation, despite having a greater total fertilizer-N application amount on account of the limited soil in the tubs in the greenhouse study [34,35]. Furthermore, the greenhouse study was purposefully managed to maintain as uniform soil water content as possible, which also likely contributed to decreased N2O fluxes compared to measured fluxes from the field studies.
Using a similar 30-cm-diameter, closed-chamber approach as the current study, Rector, et al. (2018b) measured N2O fluxes throughout the 2017 growing season from a pure-line rice cultivar (CL172) grown with NBPT-coated and non-coated urea (i.e., 118 kg N ha-1 total) under CT and NT in a full-season, flood-irrigated production system on a silt-loam soil (Typic Albaqualfs) in east-central Arkansas [32]. Peak N2O fluxes for rice fertilized with NBPT-coated urea occurred at the end of the growing season [i.e., 55 and 87 days after flood (DAF) for NT and CT, respectively] and peak N2O fluxes ranged from 24 to 71 times lower than the peak fluxes from the current study [32]. However, the Rector, et al. (2018b) study was conducted in a flood-irrigated water management scheme with one pre-flood, fertilizer-N application with NBPT-coated urea. As a result, the establishment of the flood directly after N fertilization likely suppressed N2O production until the end of the season when the flood was removed, and the soil was reaerated before harvest [32].
Similarly, Rector, et al. (2018a) measured N2O fluxes throughout the 2016 growing season from rice grown under a full-season, flood-irrigated and intermittent-flood production system on a silt-loam soil (Typic Albaqualfs) in east-central Arkansas using the same 30-cm-diameter, closed-chamber approached as used in the current study [31]. Peak N2O fluxes were also reported at the end of the growing season (i.e., 74 DAF) from the intermittent-flood treatment for both a pure-line (LaKast) and hybrid (XL753) rice cultivar [31], where the intermittent-flood water management system behaves somewhat like a furrow-irrigated system in terms of more wet-dry cycles than the full-season-flood approach. Field plots under both irrigation schemes received a pre-flood and a mid-season fertilizer-N application (i.e., 26 DAF) as NBPT-coated urea, where, approximately one week after N fertilization, the initial flood was established, consequently creating a similar scenario as the flood-irrigation in Rector, et al. (2018b) where N2O production was likely suppressed until the end of the growing season when the soil became reaerated prior to harvest [32]. Rector, et al. (2018a) reported that the near-surface soil oxidation-reduction (redox) potential was only in the range for nitrification to occur early in the growing season, thus N2O production was limited resulting in relatively low N2O fluxes [32]. Nitrous oxide fluxes reported by Rector, et al. (2018a) were numerically greater compared to those reported by Rector, et al. (2018b), but both sets of field-measured N2O fluxes ranged from 4 to 19 times lower than the fluxes measured in the greenhouse in the current study from simulated furrow-irrigation [31,32].
Season-long N2O emissions
Nitrous oxide emissions numerically ranged from 0.42 kg N2O ha-1 season-1 from the UC to 0.65 kg N2O ha-1 season-1 from the OPOS treatment, but, in contrast to N2O fluxes, did not differ (P = 0.60) among N-fertilizer treatments (Table 5). Consequently, N2O emissions averaged 0.58 kg N2O ha-1 season-1 across all four treatments (Table 5).
Nitrous oxide emissions from the current study were most similar to Rector, et al. (2018b), who reported N2O emissions of 0.50 and 0.42 kg N2O ha-1 season-1 from flood-irrigated rice grown under NT and CT, respectively, fertilized with NBPT-coated urea [32]. Flood-irrigation is known to suppress N2O production because the soil becomes too anaerobic for nitrification occur, while flood-irrigation is known for stimulating CH4 production and emissions.
The previous studies in which alternative water management schemes to flood-irrigation were used [31,34-35] reported greater season-long N2O emissions than those from the current greenhouse study with furrow-irrigation. Rector, et al. (2018a) reported N2O emissions most similar to the current study, where the intermittent-flood irrigation/pure-line treatment was less than two times greater than the mean N2O emissions among the four N-fertilizer treatments, while the intermittent-flood irrigation/hybrid treatment had N2O emissions that ranged from two to three times greater than season-long emissions measured in the current greenhouse study with a pure-line cultivar grown under furrow-irrigation [31]. Season-long N2O emissions from the current greenhouse study ranged from 3.6 to 28 times lower compared to N2O emissions from the furrow-irrigated, three-way split fertilization treatment reported in the field study of Karki, et al. (2021) on a clayey soil [35]. Compared to N2O emissions from both the NT and CT treatments reported in Slayden, et al. (2021), emissions from the current greenhouse study ranged from 4.2 to 7.5 (2018) and 2 to 6 (2019) times lower [34].
The closely managed soil water content, to achieve as uniform soil water content as possible throughout the growing season, was likely responsible for the low magnitude of N2O emissions in the current greenhouse study. The ability to keep the soil moisture content within a certain range, where neither nitrification nor denitrification would be triggered, is likely what kept N2O emissions much lower than N2O emissions measured in the field under furrow-irrigation, which were also subject to a myriad of other environmental influences. Consequently, from a management perspective, irrigating more frequently with potentially less water to maintain a more uniform soil water content over time may be a strategy to minimize N2O losses from furrow-irrigated rice compared to less-frequent irrigations with greater water volumes that perpetuate the cycle of soil wetting and drying that is known to exacerbate N2O production and emissions [37].
The lack of a fertilizer-N-timing effect in this study was not surprising considering that the total fertilizer-N amount applied was the same among the three N-fertilized treatments. However, it was surprising that the UC treatment, which received no fertilizer-N application, did not result in significantly lower N2O emissions compared to the three N-fertilized treatments. The result suggests that native soil N, either present in the soil from the beginning of the growing season or mineralized from SOM during the growing season, still has potential to be nitrified then denitrified under warm, nearly saturated soil conditions. Though not included in the study, applying all fertilizer-N at once, rather than in any split application, may save a producer some time and labor costs if it can be documented that there is little to no negative effect on rice yield. However, loss mechanisms, such as runoff and leaching, represent potential negative consequences that need to be considered in the development of alternative combinations of N application amount and timing. Despite the rather low magnitude of season-long N2O emissions measured in the current study, it must be remembered that N2O is approximately 10 times more potent of a GHG in the atmosphere than CH4 and approximately 300 times more potent than carbon dioxide [11].
Plant response and emissions intensity
Rice yields differed among fertilizer-N treatments (P < 0.01), where rice yield was numerically largest from the HOPTS treatment (11.3 Mg ha-1), but did not differ among the three N-fertilized treatments, all of which had yields that were at least 9.7 times greater than from the non-N-fertilized control (0.9 Mg ha-1; Table 5). Rice yields did not differ among the three N-fertilized treatments on account of uniform total fertilizer-N application. Similarly, rice grain yields from three recent studies conducted on a furrow-irrigated, Dewitt silt-loam soil in Arkansas did not differ among different urea fertilizer-N treatments [38-40]. Rice yields from all three N-fertilized treatments grown in tubs in the greenhouse ranged from 77 to 99.6% of the yield from a similar hybrid cultivar grown in 2019 in the field under flood-irrigated conditions on the same soil as used in this greenhouse experiment (11.3 Mg ha-1) as reported from the annual rice cultivar testing program in Arkansas [41].
Rice yields from the current greenhouse study were also approximately two times greater than yields for both the 2018 and 2019 growing seasons reported by Slayden, et al. (2021) in the field [34]. Unlike the current study, the field study of Slayden, et al. (2021) experienced an abundance of weeds and little precipitation during the 2018 growing season, which contributed to relatively low rice yields [34]. Furthermore, the field study was managed with a single pre-irrigation fertilizer-N application (i.e., 168 kg N ha-1) compared to the split applications applied in the current study. Splitting N applications, as was done in the current study, allowed for more efficient N uptake during the vegetative growth stages of the rice crop [12,42]. Yields reported in the current greenhouse study under simulated furrow-irrigation were similar to yields reported from other field studies examining N2O emissions, specifically Karki, et al. (2021) under furrow-irrigation on a clay soil [35] and Rector, et al. (2018a,b) under flood-irrigation on a silt-loam soil [31,32].
Similar to yields, above- and belowground and total dry matter (DM), above- and belowground N uptake, grain N concentration and uptake, and total N uptake all differed (P < 0.01) among fertilizer-N treatments (Table 5). Above- and belowground and total DM did not differ among N-fertilized treatments, averaging 18.1, 12.2, and 40.5 Mg ha-1, respectively, but were 2.5, 4.8, and 3.4 times, respectively, greater than that from the non-N-fertilized control (Table 5). The non-N-fertilized nature of the unamended control treatment used in this study was expected to result in poor rice growth compared to N-fertilized treatments. The uniform total fertilizer-N added among N-fertilized treatments clearly influenced rice DM more than the timing of fertilizer-N applications.
Della Lunga, et al. (2021) conducted a field study under furrow-irrigation with CT and NT and with the same rice cultivar as used in the current greenhouse study and reported numerically lower aboveground DM than in the current study, which was likely due to a lower plant-stand density experienced in the field compared to in the greenhouse environment [43]. A 2019 study, conducted in a greenhouse setting, evaluated the effect of soil moisture regime (moist, slightly below saturation, and flooded) on plant properties and greenhouse gas emissions from a hybrid rice cultivar (RT7311CL) on a silt-loam soil [37]. The slightly- below-saturation water regime closely resembled the water regime used in the current study. Della Lunga, et al. (2020a) reported belowground DM more than two times greater than that reported in the current study [37]. Unlike the current study, where rice was irrigated daily, rice in Della Lunga, et al. (2020a) was irrigated on an alternate day schedule, which allowed for a more aerobic environment, thus promoting more root growth than what was expected in the likely oxygen-limited soil environment of the current study with nearly continuously saturated, but not flooded, soil [37]. However, aboveground DM from the current study was similar to that reported in Della Lunga, et al. (2020a) [37].
In contrast to DM, above- and belowground N concentrations did not differ (P > 0.05) among fertilizer-N treatments, averaging 0.011 and 0.004 g g-1, respectively, across all four treatments (Table 5). However, the variations in DM and N concentrations among individual treatment replications resulted in differences in above- and belowground N uptake among fertilizer-N treatments (Table 5). Similar to yield and belowground DM, belowground N uptake did not differ among the three N-fertilized treatments, averaging 46.5 kg ha-1, but was at least four times greater than that from the non-N-fertilized control (Table 5). In contrast to aboveground DM and belowground N uptake, aboveground N uptake in the HOPTS was 1.6 times greater than that in the OPTS treatment, while aboveground N uptake in the OPOS treatment was intermediate and similar to that in both the HOPTS and OPTS treatments (Table 5). Aboveground N uptake from the OPOS and OPTS treatments, which did not differ, was at least 2.8 times greater than that from the non-N-fertilized control (Table 5).
The efficiency of N uptake from the soil into rice plants is affected by cultural system, rice cultivar, soil texture, soil moisture, and several other factors (i.e., fertilizer-N rate and fertilizer-N type) [24]. The numerically largest aboveground N uptake from the HOPTS treatment can be attributed to the relationship between fertilizer-N application and the stage of vegetative growth [16]. At the time of the second N application, the HOPTS treatment had only received half of the optimum, early season N rate, leaving the rice plants in the HOPTS treatment at a slight N deficit compared to the other two N-fertilized treatments. Therefore, N uptake following the second fertilizer-N application was likely greatest in the HOPTS treatment. Nitrogen uptake has been reported to continue to increase until the tillering stage [44], which coincided with the second fertilizer-N application. During the vegetative growth phase, plant N is stored in the stem and leaf tissues, but plant N is subsequently transported throughout the plant during periods of N deficit or during specific growth stages, such as grain filling [16], to potentially result in differential grain-N concentrations due to fertilizer-N treatment differences.
In contrast to above- and belowground tissue N concentrations, but similar to rice yield and above- and belowground DM, rice grain N concentration did not differ among N-fertilized treatments, averaging 0.02 g g-1, but was at least 1.2 times greater than that in the non-N-fertilized control (Table 5). Grain-N concentrations from all treatments in the current greenhouse study, including the UC, were numerically greater than those reported by Della Lunga, et al. (2021) for furrow-irrigated, hybrid rice grown under CT and NT in a soil-loam soil in the field [43]. The self-contained tubs used in the greenhouse for the current study did not allow for any runoff or leaching losses of N, as could potentially occur in the field, therefore retaining more of the N inputs throughout the growing season.
Following the differences in grain-N concentration, grain-N uptake did not differ among N-fertilized treatments, averaging 184.2 kg ha-1, but was at least 4.4 times greater than that in the non-N-fertilized control (Table 5). Grain-N uptake in the current study was three to four times greater than that measured in the field in 2018 under CT using the same hybrid rice cultivar as used in the current study, but the total fertilizer-N was only about half of what was used in the current study [43]. Furthermore, the adaptability of hybrid rice cultivars to biotic and abiotic stressors likely at least partially explains the lack of difference between belowground and grain N uptake among the three N-fertilized treatments [43].
As the sum of above- and belowground and grain N uptake, differences in total plant N uptake followed the differences in aboveground N uptake among treatments (Table 5). Total N uptake in the HOPTS was 1.5 times greater than that in the OPTS treatment, while total N uptake in the OPOS treatment was intermediate and similar to that in both the HOPTS and OPTS treatments (Table 5). Total N uptake from the OPOS and OPTS treatments, which did not differ, was at least 3.4 times greater than that from the non-N-fertilized control (Table 5). During grain filling, the grain increases in size and weight due to translocated carbohydrates (i.e., sugars and starch) from the culms and leaf sheaths, where approximately 60% of the carbohydrates are produced from photosynthesis, leaving approximately 40% for the grain [16]. Similarly, grain-N uptake measured in the current study ranged from 39.3 to 42.6% of the total N uptake (Table 5), confirming the plant-N dynamics achieved from rice grown in the greenhouse in the current study followed what is expected from rice grown in the field.
Similar to rice yields and numerous other rice property responses, N2O emissions intensity differed (P = 0.02) among fertilizer-N treatments (Table 5). Emissions intensity was at least 2.7 times greater from the UC (0.19 kg N2O Mg seed yield-1) than from the N-fertilized treatments, which did not differ from one another and averaged 0.06 kg N2O Mg seed yield-1 (Table 5). Emissions intensities associated with the N-fertilized treatments from the current greenhouse study were similar to those reported by Rector, et al. (2018b), which averaged 0.06 kg N2O Mg seed yield-1 for both NT and CT treatments under flood-irrigation [32]. However, the emissions intensity under intermittent-irrigation of a hybrid cultivar reported in Rector, et al. (2018a) was approximately 1.7 times greater than that from the current study [31]. The similar N2O emissions and greater emissions intensity from the non-N-fertilized control compared to the N-fertilized treatments underscores that even mineralized N from native SOM throughout a rice growing season is just as susceptible to nitrification followed by denitrification to be lost to the atmosphere as N2O, and contribute to an agroecosystem's GWP, as fertilizer-derived N under the right soil conditions.
Conclusions
This study aimed to evaluate the effects of N-fertilization amount and timing on N2O fluxes and season-long emissions and plant response from a silt-loam soil in a greenhouse trial simulating a CT, furrow-irrigated rice production system. As hypothesized, both the OPOS and HOPTS treatments had relatively low N2O fluxes at the beginning, numerically increasing fluxes during the middle, and had relatively low fluxes again at the end of the growing season. Nitrous oxide fluxes from the OPTS treatment fluctuated during the season, with numerically greater fluxes primarily in the first half compared to the second half of the season. Nitrous oxide emissions numerically ranged from 0.42 kg N2O ha-1 season-1 from the UC to 0.65 kg N2O ha-1 season-1 from the OPOS treatment, but, contrary to what was hypothesized, did not differ among N-fertilizer treatments. This result indicated that the timing of fertilizer-N application did not influence season-long N2O emissions. The similarity in season-long emissions from the non-N-fertilized control compared to the N-fertilized treatments also highlighted how native soil N is just as susceptible to N2O loss as fertilized-derived N.
Though rice yield was similar among the N-fertilized treatments, aboveground and total N uptake were only numerically greater from the HOPTS than the OPOS treatment, but were significantly greater than that from the OPTS treatment, which only partially supported the original hypothesis that rice under the two-split treatments will have greater total N uptake. In contrast to that hypothesized, grain-N uptake did not differ among N-fertilized treatments.
In order to numerically reduce GHG emissions, namely N2O, from furrow-irrigated rice systems, it is essential to practice proper fertilizer-N and water management. Managing irrigation water inputs to reduce soil water content fluctuations appears to be a useful potential strategy to minimize N2O emissions by controlling denitrification, as all season-long N2O emissions measured in this study did not exceed 0.65 kg N2O ha-1 season-1. Further studies must continue to evaluate the environmental effects of alternative rice management practices to maintain sustainable rice production systems in the US.
Acknowledgments
This study was partially funded by the Arkansas Natural Resources Conservation Service.
References
- Maclean J, Hardy B, Rola T, et al. (2013) Rice Almanac: source book for one of the most important economic activities on Earth. (4th edn), International Rice Research Institute, Metro Manila, Philippines.
- United States Department of Agriculture (USDA) (2019) Long-Term Agricultural Projections.
- Foreign Agriculture Service (FAS) (2020) Production, supply, and distribution. United States Department of Agriculture (USDA).
- Shahbandeh M (2020) Leading countries based on the production of milled rice in 2018/2019 (in million metric tons).
- (2020) Crop Production 2019 Summary, Rice Yearbook. Using data from USDA, National Agricultural Statistics Service. United States Department of Agriculture (USDA), Economic Research Service (ERS).
- (2010) Water levels and selected water-quality conditions in the Mississippi River Valley Alluvial Aquifer in Eastern Arkansas, 2008. United States Geological Survey (USGS).
- Neue H (1993) Methane emission from rice fields: wetland rice fields may make a major contribution to global warming. BioScience 43: 466-473.
- Peyron M, Bertora C, Pelissetti S, et al. (2016) Greenhouse gas emissions as affected by different water management practices in temperate rice paddies. Agric Ecosyst Environ 232: 17-28.
- Rosenberry DO, Glaser PH, Siegel D, et al. (2003) Use of hydraulic head to estimate volumetric gas content and ebullition flux in northern peatlands. Water Resour Res 3: 1066-1114.
- (2012) Global anthropogenic Non-CO2 greenhouse gas emissions: 1990-2030. Environmental Protection Agency (EPA).
- Intergovernmental Panel on Climate Change (IPCC) (2014) Climate change 2014: synthesis report. In: Core Writing Team, R.K. Pachauri and L.A. Meyer, Contribution of working groups I, II and III to the Fifth Assessment Report of the Intergovernmental Panel on Climate Change. IPCC, Geneva, Switzerland, 151.
- Hardke JT, Chlapecka JL (2020) Furrow-irrigated rice handbook. University of Arkansas, Division of Agriculture, Cooperative Extension Service, Fayetteville, AR.
- Hefner SG, Tracy PW (1991) Effects of nitrogen source, application timing, and dicyandiamide on furrow-irrigated rice. J Prod Agric 4: 536-540.
- Xu Y, Ge J, Tian S, et al. (2014) Effects of water-saving irrigation practices and drought resistant rice variety on greenhouse gas emissions from a no-till paddy in the central lowlands of China. Sci Tot Environ 505: 1043-1052.
- Della Lunga D, Brye KR, Slayden JM, et al. (2020) Soil moisture, temperature, and oxidation-reduction potential fluctuations across a furrow-irrigated rice field on a silt-loam soil. J Rice Res Dev 13: 103-114.
- (2019) Rice Production Handbook. UA-DA-CES, Little Rock, AR.
- Rogers CW, Brye KR, Smartt AD, et al. (2014) Cultivar and previous crop effects on methane emissions from drill-seeded, delayed-flood rice production on a silt-loam soil. Soil Sci 179: 28-36.
- Feng J, Li F, Zhou X, et al. (2018) Impact of agronomy practices on the effects of reduced tillage systems on CH4 and N2O emissions from agricultural fields: a global meta-analysis. PLoS One 13: 1-17.
- Liu G, Yu H, Zhang G, et al. (2016) Combination of wet irrigation and nitrification inhibitor reduced nitrous oxide and methane emissions from rice cropping system. Environ Sci Poll Res 23: 17426-17436.
- United States Department of Agriculture (USDA) (2014) Natural Resources Conservation Services (NRCS). Dewitt soil series.
- Gee GW, Or D (2002) Particle size analysis. In: Dane JH, Topp GC, Methods of Soil Analysis Part 4, Physical Methods. Soil Science Society of America. Book Series No. 5, Madison, WI, 255-293.
- Nelson DW, Sommers LE (1996) Total carbon, organic carbon, and organic matter. In: Sparks DL, Page AL, Helmke PA, et al. (Eds.). Methods of soil analysis. Part 3: Chemical analysis 3rd ed. Soil Science Society of America, Madison, WI, 961-1010.
- Tucker MR (1992) Determination of phosphorus by Mehlich 3 extraction. In: Donohue SJ (Ed.). Soil and media diagnostic procedures for the southern region of the United Sates, southern cooperative series bulletin no. 374. Virginia Agricultural Experiment Station, Blacksburg, VA, 6-8.
- University of Arkansas (UA), Division of Agriculture (DA), Cooperative Extension Service (CES) (2017) Rice information: managing furrow-irrigated rice in Arkansas.
- Hardke JT, Barber T, Bateman N, et al. (2021) Rice Management Guide. University of Arkansas, Division of Agriculture, Cooperative Extension Service, Fayetteville, AR.
- Bouman BAM, Tuong TP (2001) Field water management to save water and increase its productivity in irrigated lowland rice. Agric Water Manage 49: 11-30.
- Craswell ET, Vlek PLG (1979) Greenhouse evaluation of nitrogen fertilizers for rice. Soil Sci Soc Am J 43: 1184-1188.
- Sander BO, Wassmann R (2014) Common practices for manual greenhouse gas sampling in rice production: a literature study on sampling modalities of the closed chamber method. Greenhouse Gas Measure Manage 4: 1-13.
- Humphreys JJ, Brye KR, Rector C, et al. (2018) Water management and cultivar effects on methane emissions from direct-seeded, delayed-flood rice production in Arkansas. J Rice Res Dev 1: 14-24.
- Humphreys JJ, Brye KR, Rector C, et al. (2018) Methane production as affected by tillage practice and NBPT rate from a silt-loam soil in Arkansas. J Rice Res Dev 1: 49-58.
- Rector C, Brye KR, Humphreys JJ, et al. (2018) N2O emissions and global warming potential as affected by water management and rice cultivar on an Alfisol in Arkansas, USA. Geoderma Reg 14: e00170.
- Rector C, Brye KR, Humphreys JJ, et al. (2018) Tillage and coated-urea effects on nitrous oxide emissions from direct-Seeded, delayed-flood rice production in Arkansas. J Rice Res Dev 1: 25-37.
- Smartt AD, Brye KR, Rogers CW, et al. (2016) Previous crop and cultivar effects on methane emissions from drill-seeded, delayed-flood rice grown on a clay soil. Appl Environ Soil Sci 2016: 1-13.
- Slayden JM, Brye KR, Della Lunga D, et al. (2022) Site position and tillage treatment effects on nitrous oxide emissions from furrow-irrigated rice on a silt-loam soil Geoderma Reg Submitted/In review
- Karki S, Adviento-Borbe MA, Massey JH, et al. (2021) Assessing seasonal methane and nitrous oxide emissions from furrow-irrigated rice with cover crops. Agriculture 11: 1-15.
- United States Department of Agriculture (USDA) (2013) Natural Resources Conservation Services (NRCS). Sharkey soil series.
- Della Lunga D, Brye KR, Roberts TL, et al. (2020) Water management effects on trace gas emissions under greenhouse conditions from direct-seeded hybrid rice in a silt-loam soil. J Rice Res Dev 3: 95-102.
- Henry CG, Pickelmann DM, Rix JP, et al. (2019) Grain yield response of furrow-irrigated RiceTec Gemini 214 CL to different nitrogen sources, irrigation timing, and tillage. B.R. Wells Arkansas Rice Research Studies 2019 667: 223-227.
- Kandpal V, Henry CG (2017) Grain yield response of furrow-irrigated Clearfield hybrid XL745 to different nitrogen sources. B.R. Wells Arkansas Rice Research Studies 2017 651: 271-278.
- Pickelmann DM, Henry CG, Kandpal V, et al. (2018) Grain yield response of furrow-irrigated Clearfield hybrid RT 7311 to different nitrogen sources. B.R. Wells Arkansas Rice Research Studies 2018 659: 343-351.
- Hardke JT (2019) Arkansas Rice Cultivar Testing Preliminary Yield Reports.
- Chlapecka JL, Hardke JT, Roberts TL, et al. (2020) Nitrogen management strategies for furrow-irrigated rice production. B.R. Wells Arkansas Rice Research Studies 2020 676: 192-196.
- Della Lunga D, Brye KR, Slayden JM, et al. (2021) Plant productivity and nutrient uptake as affected by tillage and site-position in furrow-irrigated rice. Agron J 113: 2374-2386.
- Ramanathan KM, Krishnamoorthy KK (1973) Nitrogen uptake by paddy during the main three stages of growth. Plant Soil 39: 29-33.
Corresponding Author
Kristofor R Brye, Professor, Department of Crop, Soil, and Environmental Sciences, 115 Plant Sciences Building, University of Arkansas, Fayetteville, AR 72701, USA.
Copyright
© 2022 Slayden JM. This is an open-access article distributed under the terms of the Creative Commons Attribution License, which permits unrestricted use, distribution, and reproduction in any medium, provided the original author and source are credited.