Soil Moisture, Temperature, and Oxidation-Reduction Potential Fluctuations across a Furrow-Irrigated Rice Field on a Silt-Loam Soil
Abstract
Alternative water management practices for rice (Oryza sativa) production have been developed for water conservation purposes, such as the furrow-irrigated rice production system, which results in variable volumetric water content (VWC), temperature, and oxidation-reduction (redox) potential conditions. The spatial and temporal variations in environmental factors can affect greenhouse gas (GHG) emissions. The objective of this field study was to document and evaluate the continuous variations in soil water content, temperature, and redox potential over two growing seasons (2018 and 2019) among site positions (up-, mid-, and down-slope) and tillage treatments [conventional tillage (CT) and no-tillage (NT)] under furrow-irrigated rice on a silt-loam soil (Typic Albaqualf) in eastern Arkansas. Soil volumetric water content, temperature, and redox potential were continuously measured throughout most of the growing season in the top 7.5 cm. The up- and mid-slope positions in 2018 had numerically greater soil VWC under NT than under CT, while the up- and mid-slope positions in 2019 had numerically greater VWC under CT than under NT. The up-slope position experienced more numerous VWC and greater redox fluctuations than the mid-slope position. Variations in soil water contents and redox potential likely had a greater effect on GHG production and potential differential tillage treatment response than soil temperature variations. Research efforts need to focus on quantifying spatial and temporal variations in GHG fluxes throughout a furrow-irrigated rice field and investigate relationships among GHG fluxes and emissions and environmental factors known to influence GHG production, namely soil water content, temperature, and redox potential.
Keywords
Soil volumetric water content, Soil redox potential, Environmental parameters
Introduction
Arkansas is the main rice (Oryza sativa)-producing state in the United States, producing, on average, 6.1 Mg grain ha-1 yr-1 [1]. However, even if Arkansas receives enough precipitation to support crop production, with an average of 117 to 137 cm annually, between late spring and early summer during the critical phases of the rice growing season, precipitation alone is insufficient for optimal crop production, thus groundwater is often used as supplemental irrigation [2]. Reports indicate that 83% of the rice fields in Arkansas rely on groundwater to supply rice crops with adequate water [2]. The annual aquifer decline in Arkansas has been estimated to be 0.15 m yr-1 [2], which has caused excessive groundwater withdrawals for agricultural irrigation to be a major regional concern.
With the increasing water-shortage conditions, more effective and efficient water use for rice production must be implemented [3]. Furrow-irrigation systems have been reported to increase water-use efficiency compared to the traditional rice irrigation system, which consists of flooding a rice field for approximately three months of the rice growing season [3]. Furrow irrigation is accomplished by the creation of channels (i.e., furrows), parallel to the predominant slope, adjacent to raised beds along the length of the field [4]. Water travels from the elevationally high end of the field to the low end through gravity flow [4]. The increased water-use efficiency in furrow-irrigation systems has resulted in a reduction in the irrigation rate, evapotranspiration, and seepage due to the absence of a surface layer of floodwater [3]. However, the raised beds can affect the availability of water for crops grown [5], where rice yields were 15% lower from a furrow-irrigation system compared to the continuous full-season flood on silty-clay soils in northeast Arkansas [6].
Coupled with weed management without flooded-soil conditions [7], another major management challenge for a furrow-irrigated rice production system are the zones of differential soil surface conditions (i.e., crop residue) and properties (i.e., soil-fertility and water-related properties) that develop as a result of the required slope across a furrow-irrigated field, which is often ~ 2%. For example, the up-slope position is often semi-dry, the mid-slope position is often moist, and the down-slope position is often saturated to ponded with water. The differential zones coexist at the same time within the same furrow-irrigated field and experience dynamic fluctuations in environmental conditions in response to irrigation and rainfall. Consequently, the dynamic fluctuations within the field increase the frequency of wetting-drying cycles the soil experiences throughout a furrow-irrigated-rice growing season. By themselves, frequent wet-dry cycles are not concerning. However, considering the ramifications of soil that experiences frequent wet-dry cycles on potentially exacerbating greenhouse gas (GHG) emissions, particularly methane (CH4), nitrous oxide (N2O), and carbon dioxide (CO2), the spatial and temporal variations in soil water content, temperature, and oxidation-reduction (redox) potential (Eh), which are environmental/soil properties known to influence GHG production [8-18], associated with furrow-irrigated rice production may pose a serious risk to environmental quality and future sustainability.
The objective of this field study was to document and evaluate the continuous variations in soil water content, temperature, and redox potential during two growing seasons (2018 and 2019) among site positions (up-, mid-, and down-slope) and tillage treatments [conventional tillage (CT) and no-tillage (NT)] under furrow-irrigated rice on a silt-loam soil in eastern Arkansas. It was hypothesized that soil at the up-slope position would experience more numerous soil moisture and greater redox fluctuations than the mid-slope position and that tillage would differentially affect soil water contents and redox potentials throughout the rice growing season. It was also hypothesized that soil under NT, particularly at the down-slope position, would reduce faster and reach lower Eh values than under CT.
Materials and Methods
Site description
Research was conducted over the 2018 and 2019 rice growing seasons in a 400-m long by 12-m wide portion of an approximate 16-ha field in Arkansas County, AR within Major Land Resource Area 131D (Southern Mississippi River Terraces; [19]). Soil mapped throughout the study area was a DeWitt silt loam (Typic Albaqualf), which is a poorly drained, slowly permeable soil that has been under cultivated agriculture for at least 15 years [20,21]. The slope through the study area, oriented in the north-south direction, was 2%, on average, from the up- to the down-slope end of the field. The 30-yr (1981 to 2010) mean annual air temperature is 16.5 ℃, while mean annual precipitation is 125.2 cm [22].
Treatments and experimental design
One 6-m wide strip along the entire field length was prepared as CT using a disk to a depth of 15 to 20 cm followed by a field cultivator to a depth of 10 to 15 cm to break up the soil clods, while an adjacent 6-m-wide strip was prepared without tillage (NT), where the previous year's crop residues were both mowed and burned, prior to rice planting in late Spring 2018 and 2019. Soil sampling and environmental factor monitoring locations were established at an up-, mid-, and down-slope field position in 2018 and approximately the same locations were used again in 2019. Consequently, the experimental design was a split-plot, where site position was the whole-plot factor and tillage was the split-plot factor that was stripped across the length of the field, which created six site-position-tillage treatment combinations. The experimental unit within a tillage treatment was considered as the 6-m wide area of the whole tillage-treatment strip by ~ 2.5-m long (i.e., ~ 15 m2).
Field management
The study location had been consistently managed in a furrow-irrigated rice production system between 2014 and 2019. Beds, approximately 15 cm tall, 30 cm wide at the top, and ~ 76 cm between adjacent bed centers, were established in 2014 throughout the entire field. Each year, the prior year's beds were left intact and were treated with a NT furrow-runner implement (Perkins Sales Inc, Bernie, MO) to make sure the furrow was open to allow water flow during furrow-irrigation. The study area was drill-seeded in mid-May 2018 with the hybrid cultivar 'CL7311' (RiceTec, Alvin, TX) and was planted in late-April 2019 with the hybrid cultivar '214-Gemini' (RiceTec) with 19 cm row spacing.
After planting, the study area was subsequently furrow-irrigated approximately one time per week between mid-June and early September each year using 30-cm diameter, lay-flat poly pipe laid out at the up-slope boundary of the study area, which was connected to a variable-flow, tail-water pump at the down-slope position that returned tail water from the low end back to the high end of the field [23]. The water used for irrigation was from a rain-fed, surface reservoir located on the north side of the study area. Once the down-slope position, roughly one-third of the field, had ponded water, the tail-water-recovery pump ran continuously to maintain a constant presence of water in the down-slope position. Various herbicides were applied as needed throughout the growing season to control weeds.
Sensor installation
Soil volumetric water content (VWC), soil temperature, and soil redox potential were continuously measured throughout most of the growing season. In late-May 2018 and mid-May 2019, two water content reflectometers (Model CS616, Campbell Scientific, Inc., Logan, UT) and two thermocouples (Type E, chromel-constant) were installed in the up- and mid-slope positions in both tillage treatments. A small trench was excavated on top of the raised bed and the reflectometer was inserted in a horizontal position into undisturbed soil. Thermocouples were also installed in a horizontal position at the 7.5-cm depth from the top of the raised beds 30.5 cm from the reflectometers. Six soil redox sensors (Model S65OKD-ORP, Sensorex, Garden Grove, CA) and four thermocouples were installed at the down-slope position. Three redox sensors and two thermocouples were installed in each of the two tillage treatments. Additionally, two redox sensors were installed in each tillage treatment in the up- and mid-slope positions in 2019. Thermocouples were installed with the same procedure as for the up- and mid-slope positions. Soil redox sensors were installed vertically at a depth of ~ 4 cm from the top of the raised beds. All the sensors were connected to a CR1000 data logger (Campbell Scientific) installed in between tillage treatments at each site position that recorded data at 5-minute intervals and output averages every hour. Data loggers were powered by a 12-V, external battery, checked weekly for proper functioning, and data collected weekly.
Data analyses
Time-series data sets were evaluated separately by year for magnitudes of data maxima and minima, frequencies of data maxima and minima oscillations, and consistent numeric trends throughout the growing season among site positions and between tillage treatments.
Results and Discussion
Initial soil properties
Della Lunga, et al. (2020) reported sand, silt, and clay concentrations, bulk density (BD), and soil organic matter (SOM) in the top 10 cm at the beginning of the 2018 rice growing season. Each soil property differed among site positions, between tillage treatments, or among site position-tillage treatment combinations [24]. Particle-size analyses confirmed the mapped soil surface textural class throughout the entire study area as silt loam [24].
Sand was greatest (0.16g g-1) in the CT-up- and lowest (0.12 g g-1) in the CT- and NT-down-slope treatment combinations [24]. Silt was greatest (0.74 g g-1) in the CT-mid- and lowest (0.70 g g-1) in the NT-up-slope combination [24]. Clay was greatest (0.15 g g-1) in the CT-down- and NT-up- and -down- and lowest (0.13 g g-1) in the CT-up- and mid-slope combinations [24]. Soil BD was greatest (1.26 g cm-3) in the NT-down- and lowest (1.11 g cm-3) in the CT-mid-slope combination [24]. Soil organic matter content was greatest (26.1 Mg ha-1) in NT-down- and lowest (22.7 Mg ha-1) in the CT-mid-slope combination [24]. Despite being mowed and burnt each year prior to rice planting, the residue-enriched soil surface under NT protected the soil surface from wind and water erosion and facilitated rapid SOM decomposition [25], likely contributing to generally greater SOM contents under NT than CT.
Environmental factor trends over time
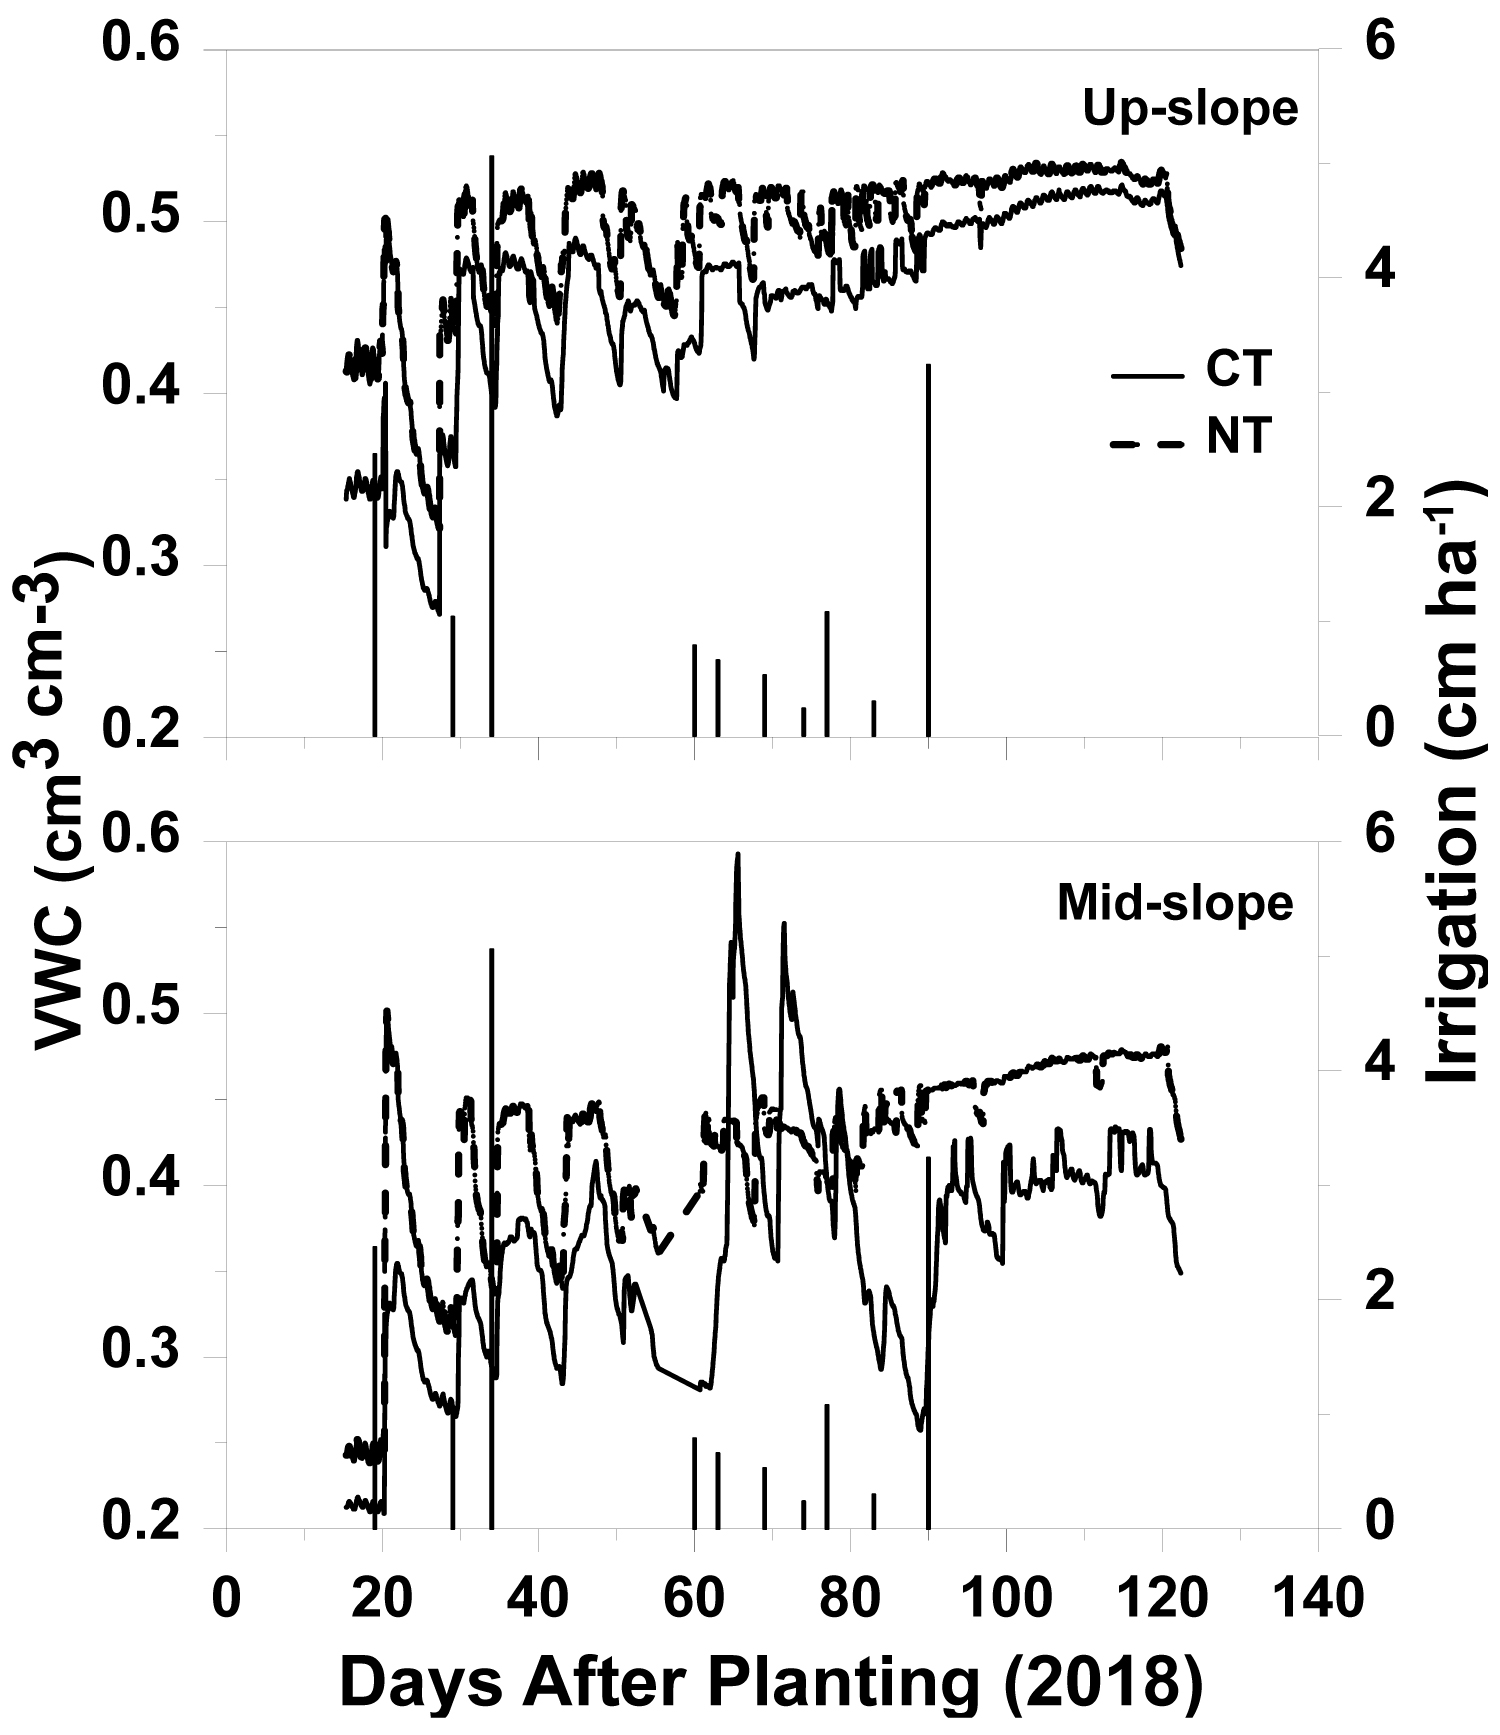
Soil water content: Soil VWC trends over time showed somewhat different environmental conditions between the 2018 and 2019 growing seasons. The up- and mid-slope positions in 2018 had relatively numerically greater VWC at the 7.5-cm depth under NT than under CT (Figure 1), while up- and mid-slope positions in 2019 had relatively numerically greater VWC under CT than under NT (Figure 2). The up-slope position in 2018 had VWCs that numerically ranged from 0.33 and 0.27 cm3 cm-3 at 26 and 27 days after planting (DAP) under NT and CT, respectively, to 0.53 and 0.52 cm3 cm-3 at 113 and 114 DAP under NT and CT, respectively (Figure 1). At 15 DAP, VWC started at 0.41 and 0.34 cm3 cm-3 in the NT and CT sections, respectively, at the up-slope position (Figure 1). Subsequently, VWC under both tillage treatments in the up-slope position followed similar trends throughout the 2018 growing season in response to rainfall and furrow irrigation, with a similar frequency of wet-dry cycles greater than or equal to a VWC change of 5% (Table 1 and Figure 1). However, VWCs under NT were consistently numerically greater than under CT in the up-slope position for the majority of the 2018 growing season, which was most likely related to the partial presence of crop residues that slowed down the flow of water to some degree, especially during irrigation, favoring infiltration into the soil and reducing evaporation. Additionally, the passage of the disk and field cultivator in the CT section of the study area most likely disrupted the macro-pores and favored the formation of a slight surface soil crust [26], which was visually confirmed in the CT-up-slope combination after a drying and wetting cycle started at 24 and ended at 26 DAP (Figure 1). Although the soil crust limited infiltration, the presence of a soil crust did not affect the wetting and drying process (Table 1). The presence of a surface soil crust was observed until at least 75 DAP. Furthermore, the NT-up-slope combination had a slightly greater clay content (0.15 g g-1 clay), thus likely at least slightly greater water-holding capacity due to improved soil aggregation (Brady and Weil, 2008), than the CT-up-slope combination (0.13 g g-1 clay; [24]).
At 19 and 20 DAP, VWC numerically increased 0.11 and 0.07 cm3 cm-3 under CT and NT, respectively, in response to the irrigation application of 2.5 cm ha-1 and a rainfall event of 1.5 cm that occurred over a 2-hr period at 20 DAP (Figure 1). The drying that occurred in both tillage treatments from 20 to 26 DAP (Figure 1) was necessary to achieve to ensure that the fertilizer-nitrogen (N) application was performed on a dry soil in order to avoid ammonia volatilization, a process that urea undergoes when applied to wet-soil conditions [27]. From 47 to 118 DAP, VWCs in the up-slope position under both tillage treatments numerically oscillated, but never decreased below 0.40 cm3 cm-3 or increased above 0.53 cm3 cm-3, indicating a wet, but never saturated condition (Figure 1), where the total porosity for the up-slope position, averaged across tillage treatments, was estimated to be 54% based on early season bulk density [24]. The relatively rapid numeric decline in VWC after 118 DAP in both tillage treatments (Figure 1) was related to draining the field to prepare for harvest.
Similar environmental conditions occurred at the mid-slope position in 2018, where VWCs under NT were generally numerically greater than under CT throughout the growing season (Figure 1). Both tillage treatments at the mid-slope position began the growing season at 15 DAP at numerically lower VWCs, 0.25 and 0.21 cm3 cm-3 under NT and CT, respectively, than at the up-slope position (Figure 1). Soil VWCs ranged from 0.25 cm3 cm-3 at 17 DAP to 0.50 cm3 cm-3 at 20 DAP under NT and ranged from 0.21 cm3 cm-3 at 17 DAP to 0.58 cm3 cm-3 at 65 DAP under CT (Figure 1). The first furrow-irrigation event resulted in the greatest numeric increase in VWC under NT, 0.24 to 0.48 cm3 cm-3, in the span of 24 hours (Figure 1). However, VWC increased the most under CT from multiple irrigation events later in the season, around 60 DAP, when VWC numerically increased from 0.28 to 0.57 cm3 cm-3 over a period of 5 days, which affected the wet-dry processes, with a greater frequency of wet-dry cycles than under NT (Table 1). From 63 to 70 DAP, CT experienced VWCs that numerically exceeded those under NT (Figure 1).
Deep tracks left by the passage of field equipment around the up- and mid-slope positions of the study area were discovered at 75 DAP. The tracks most likely affected the down-slope movement of water in the furrows and consequently the VWCs in the up- and mid-slope positions. At 80 DAP, a cleaning operation of the furrows was performed to reestablish the regular flow of the water through the up- and mid-slope sections of the study area, most likely causing the drying that occurred under CT at the mid-slope position between 80 and 88 DAP (Figure 1). Contrary to up-slope, both tillage treatments in the mid-slope position did not show any delayed response to the applied irrigation water (Figure 1), which was most likely due to the slightly concave micro-topography at the mid-slope position that slowed the flow of water, favoring infiltration. As observed in the up-slope position, VWC trends at the mid-slope position also clearly showed the drying process that started at 118 DAP to prepare for harvest (Figure 1). Estimated total porosity for the mid-slope position, averaged across tillage treatments, was 56%, which demonstrated that, similar to the up-slope position, the VWC in the mid-slope position never reached saturation, except for a very short period of time under CT at 65 DAP (Figure 1). In addition, no difference in clay content existed at the mid-slope position between tillage treatments to have possibly differentially affected infiltration and/or water-holding capacity.
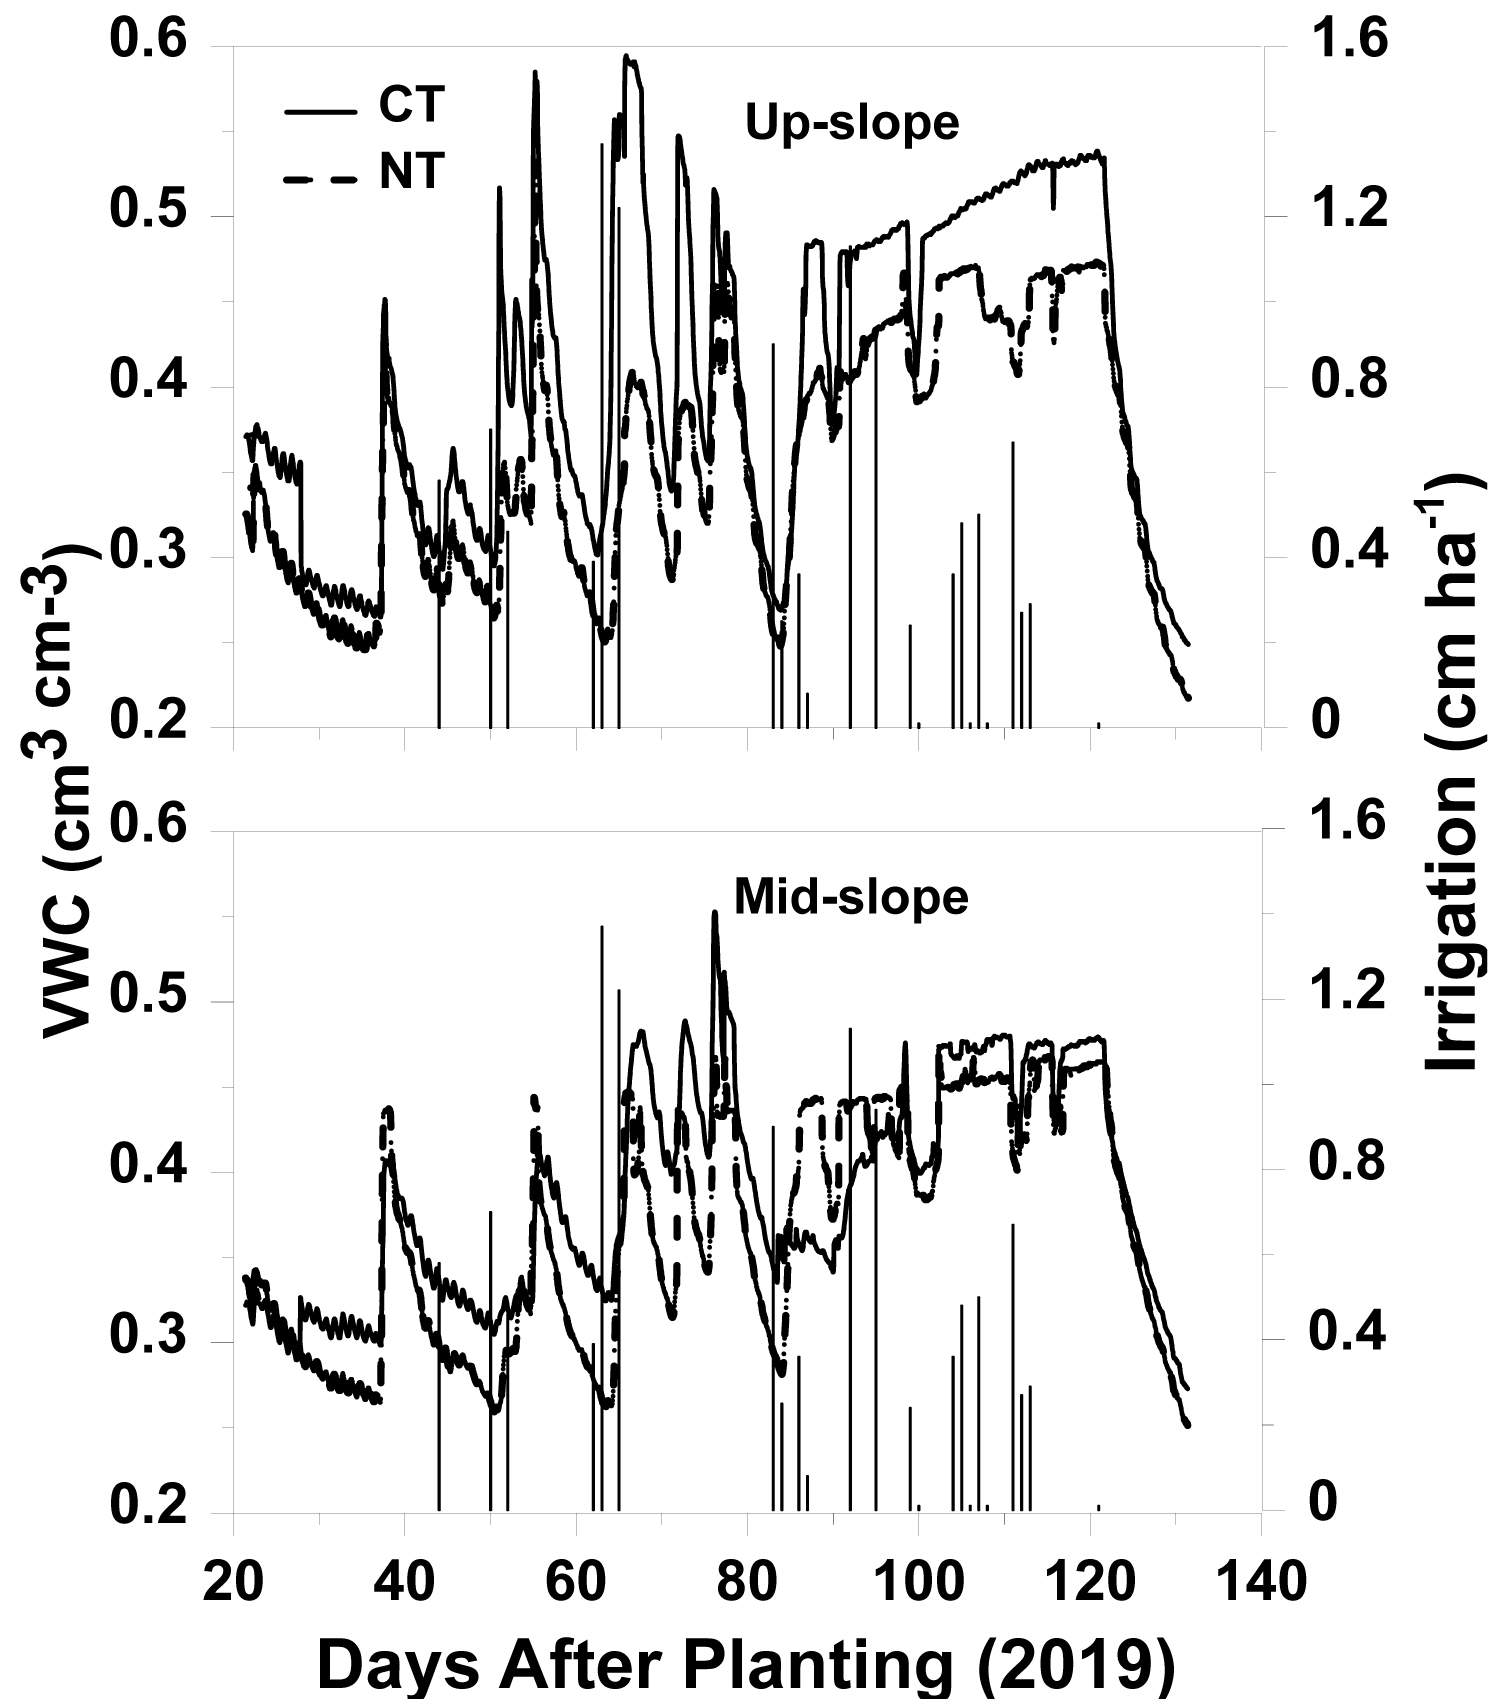
Soil VWC trends in the up- and mid-slope positions during the 2019 growing season were somewhat different compared to the 2018 growing season (Figure 2). In contrast to 2018, in the up-slope position in 2019, the VWC under CT was consistently at least slightly numerically greater than under NT, while VWC in the mid-slope position did not vary substantially between tillage treatments, but numerically lower VWCs were consistently achieved under NT than CT following prolonged dry-down periods between rainfall and/or irrigation events (Figure 2). Excluding the drying phase at the end of the growing season, VWCs in the up-slope position under NT ranged from 0.25 cm3 cm-3 at 84 DAP to 0.53 cm3 cm-3 at 55 DAP, while VWCs under CT ranged from 0.25 cm3 cm-3 at 84 DAP to 0.59 cm3 cm-3 at 65 DAP (Figure 2).
Compared to 2018, the 2019 growing season had numerically wider VWC fluctuations in both the up- and mid-slope positions. Greater growing-season (i.e., April to September) rainfall, 36.2 and 59.3 cm in 2018 and 2019, respectively, and lower dependence on total applied irrigation, 15 and 12 cm ha-1 in 2018 and 2019, respectively, likely caused the numerically greater VWC fluctuations observed in 2019 compared to in 2018. However, though less total irrigation water was applied in 2019, irrigation frequency was actually greater in 2019 (Figure 2) than in 2018 (Figure 1). The greater irrigation frequency in 2019 likely determined the generally lower frequency of wet-dry cycles of greater than 5% change in VWC in both the up- and mid-slope positions compared to in the 2018 growing season (Table 1). Similar to up-slope, VWCs in the mid-slope position in 2019 ranged from 0.25 cm3 cm-3 at 63 DAP to 0.47 cm3 cm-3 at 76 DAP under NT and ranged from 0.26 cm3 cm-3 at 26 DAP to 0.55 cm3 cm-3 at 76 DAP under CT. As in 2018, VWCs in both positions under both tillage treatments began to decrease around 118 DAP in preparation for harvest (Figure 2). Through the entire 2019 growing season, the difference in VWC between tillage treatments in the mid-slope position did not exceed 0.07 cm3 cm-3 (Figure 2). Estimated total porosity, averaged across tillage treatments, was 58 and 57% in the up- and mid-slope positions, respectively, thus VWC at the two site positions never reached saturation during the 2019 growing season (Figure 2). In the two growing seasons, the VWC decreases, likely attributed to plant uptake and vertical drainage, and VWC increases associated with rainfall irrigation events, resulted in wet-dry cycles that never reached the upper threshold of soil saturation, but exceeded the lower threshold of field capacity (Figure 1 and Figure 2). While, in 2018, only the mid-slope position recorded VWC values below field capacity (~ 0.30 cm3 cm-3), both the up- and mid-slope positions in 2019 experienced VWC in excess of field capacity repeatedly during the first half of the growing season (Figure 1 and Figure 2).
The presence of the tail-water pump at the lower end of the field likely reduced the fluctuations in VWC during the second half of the growing season in both site positions in 2018 and 2019 (Figure 1 and Figure 2). Additionally, the tail-water pump likely aided in maintaining a relatively greater VWC than would be normally observed in a producer's field under a more typical crop-production scenario. The frequent variations in VWC measured at the up- and mid-slope positions and differential tillage treatment response over the 2-year period of monitoring, would likely influence GHG production and would likely result in at least a numerically differential tillage treatment effect on season-long GHG emissions.
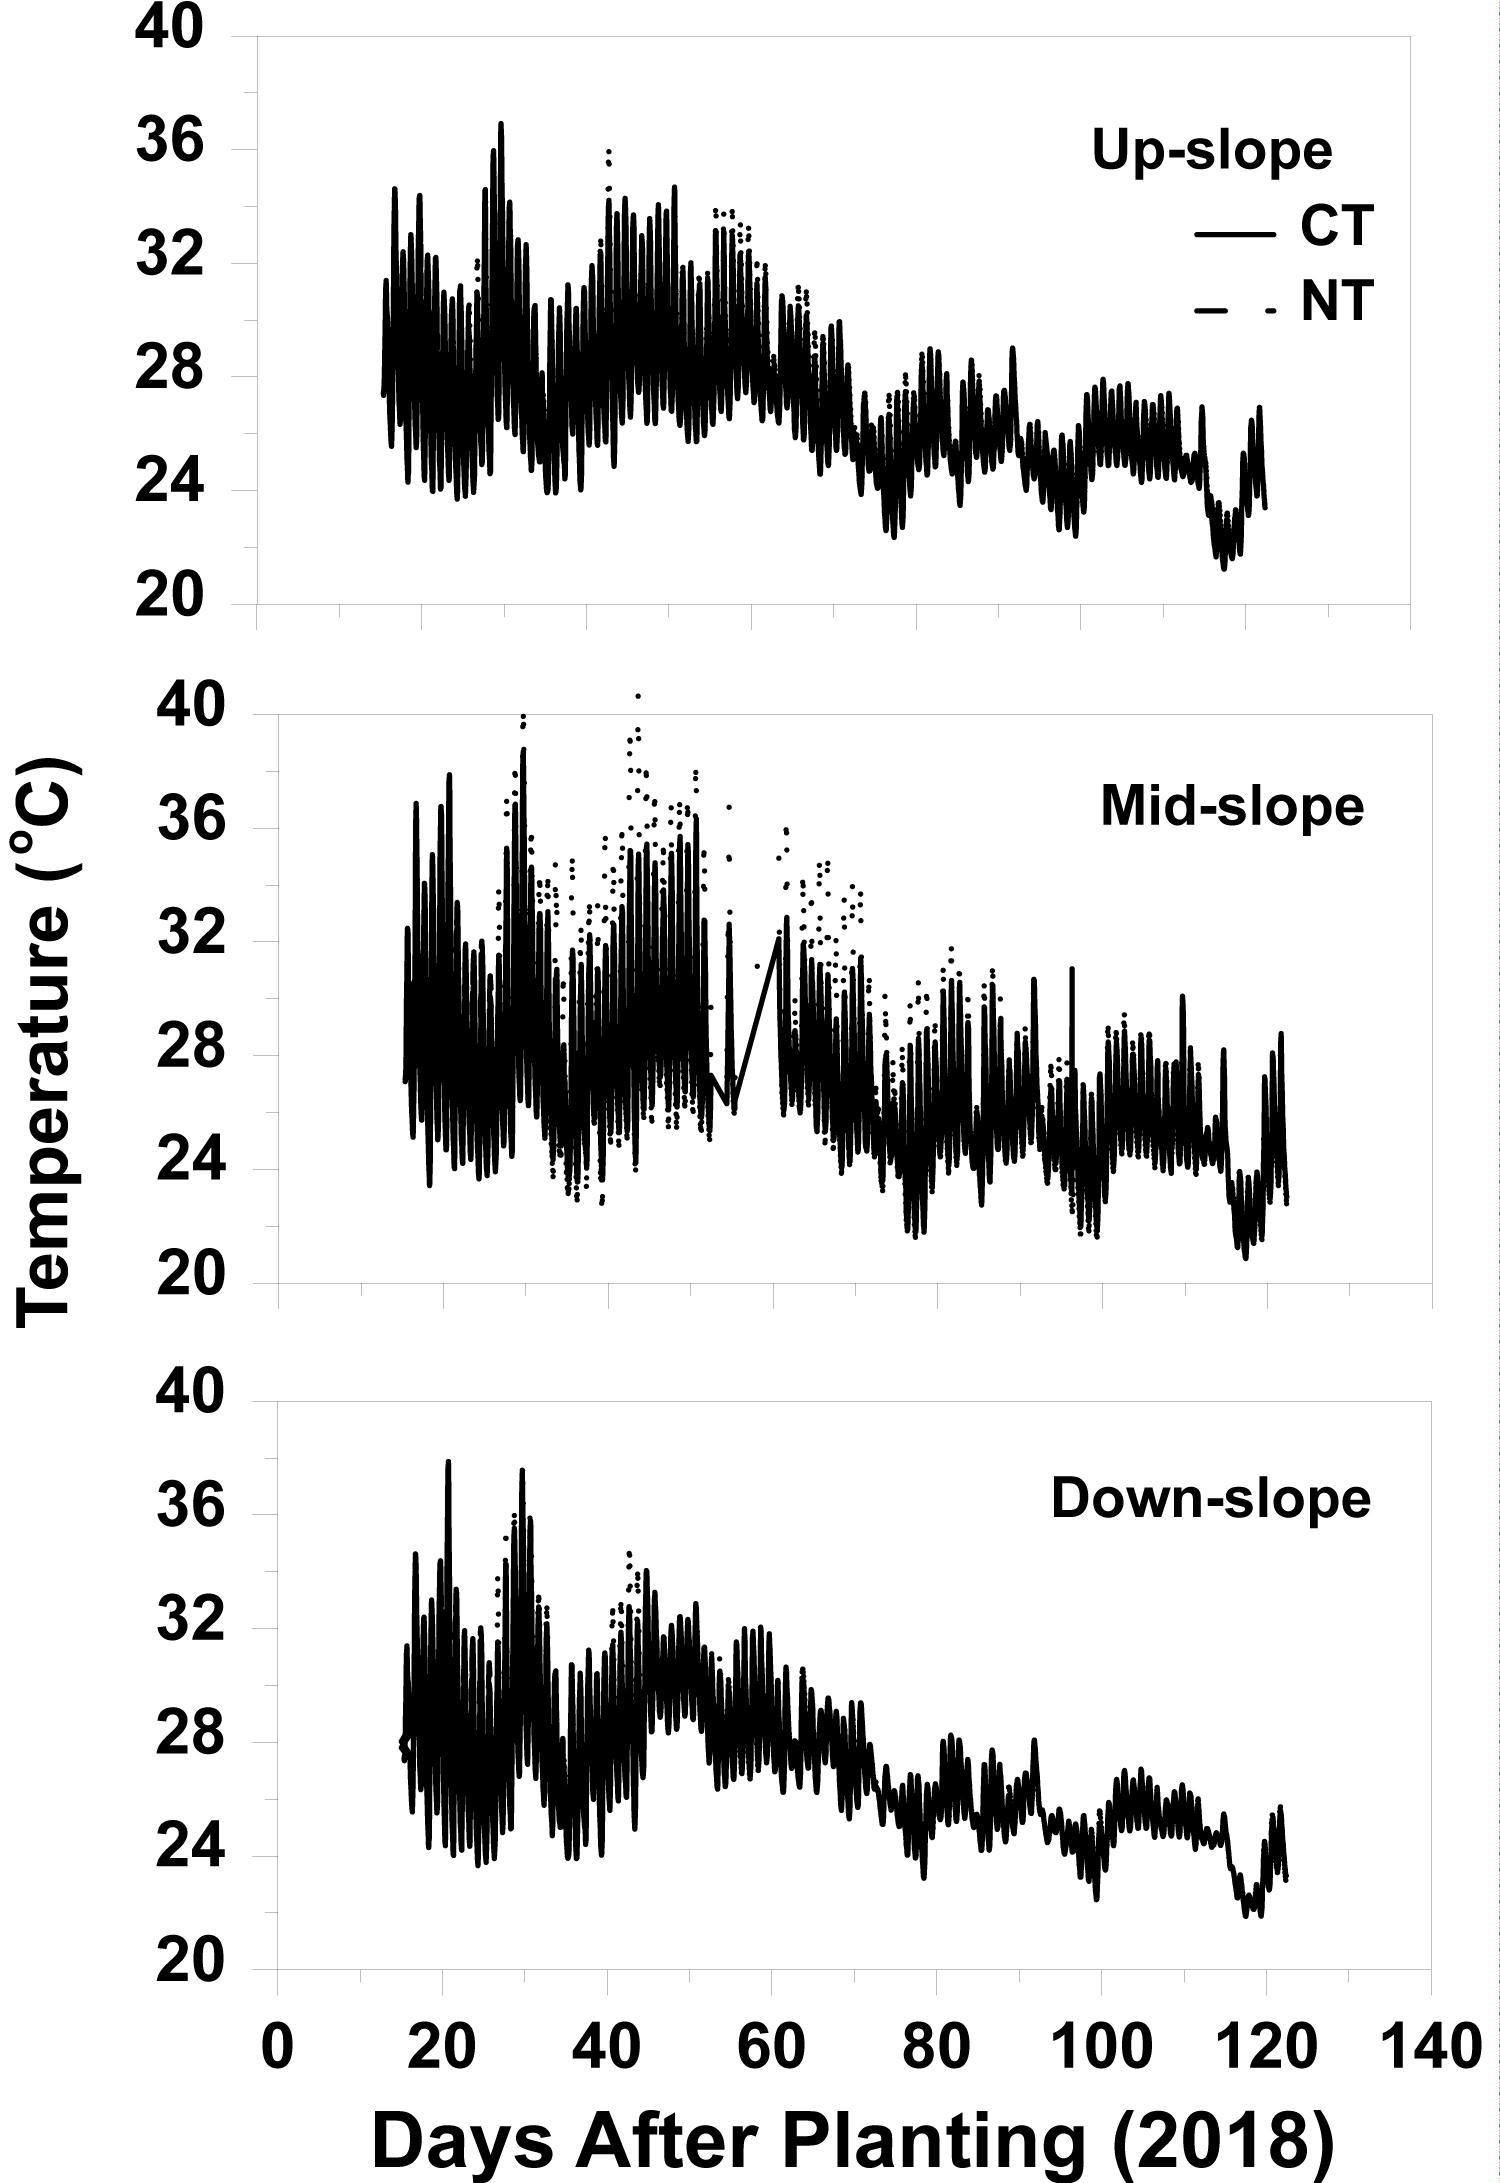
Soil temperature: Soil temperatures measured at the 7.5-cm depth in 2018 showed uniform conditions across tillage treatments and site positions (Figure 3). The CT/NT and up-/mid-slope combinations had similar soil temperature ranges, from a minimum of 21 ℃ at 116 DAP to a maximum of 38 ℃ at 30 DAP (Figure 3). During the first half of the 2018 growing season, the up- and mid-slope positions had slightly greater soil temperatures than during the second half of the growing season (Figure 3). From 15 to 66 DAP, the average soil temperature in the up- and mid-slope positions in both tillage treatments was 27 ℃, while the average soil temperature in the up- and mid-slope positions in both tillage treatments from 66 to 118 DAP was 24 ℃ (Figure 3). The greater near-surface soil water content in the second half of the growing season (Figure 1), along with the increased canopy coverage due to the growing rice plants, likely attenuated solar radiation and maintained a cooler and constant environment in the upper 7.5-cm soil layer.
Variations in vegetation cover can affect soil temperature [28]. Canopy coverage influences the radiation balance, evaporation of soil water, and reflection of incoming radiation. The insulation provided by residues and/or living plants is controlled by the amount and associated thickness of the vegetative cover [29]. In a 7-year study in south Asia on rice paddies, results showed a reduction of 3 ℃ in the upper part of the soil when the rice plants reached the end of the vegetative phase [29]. Additionally, the specific heat of water, in conjunction with the greater soil water content in the upper part of the soil during the second half of the growing season (Figure 1), provided regulatory mechanisms that kept the soil temperature lower than the atmospheric air temperature [30].
Soil temperatures at the down-slope position were also similar between tillage treatments and varied similarly as in the up- and mid-slope positions; however, the daily fluctuations appeared to vary less at the down-slope position, especially after 66 DAP, compared to the daily fluctuations at the up- and mid-slope positions (Figure 3). The presence of ponded water on the soil surface at the down-slope position likely facilitated a more constant temperature in the upper part of the soil profile (Figure 3).
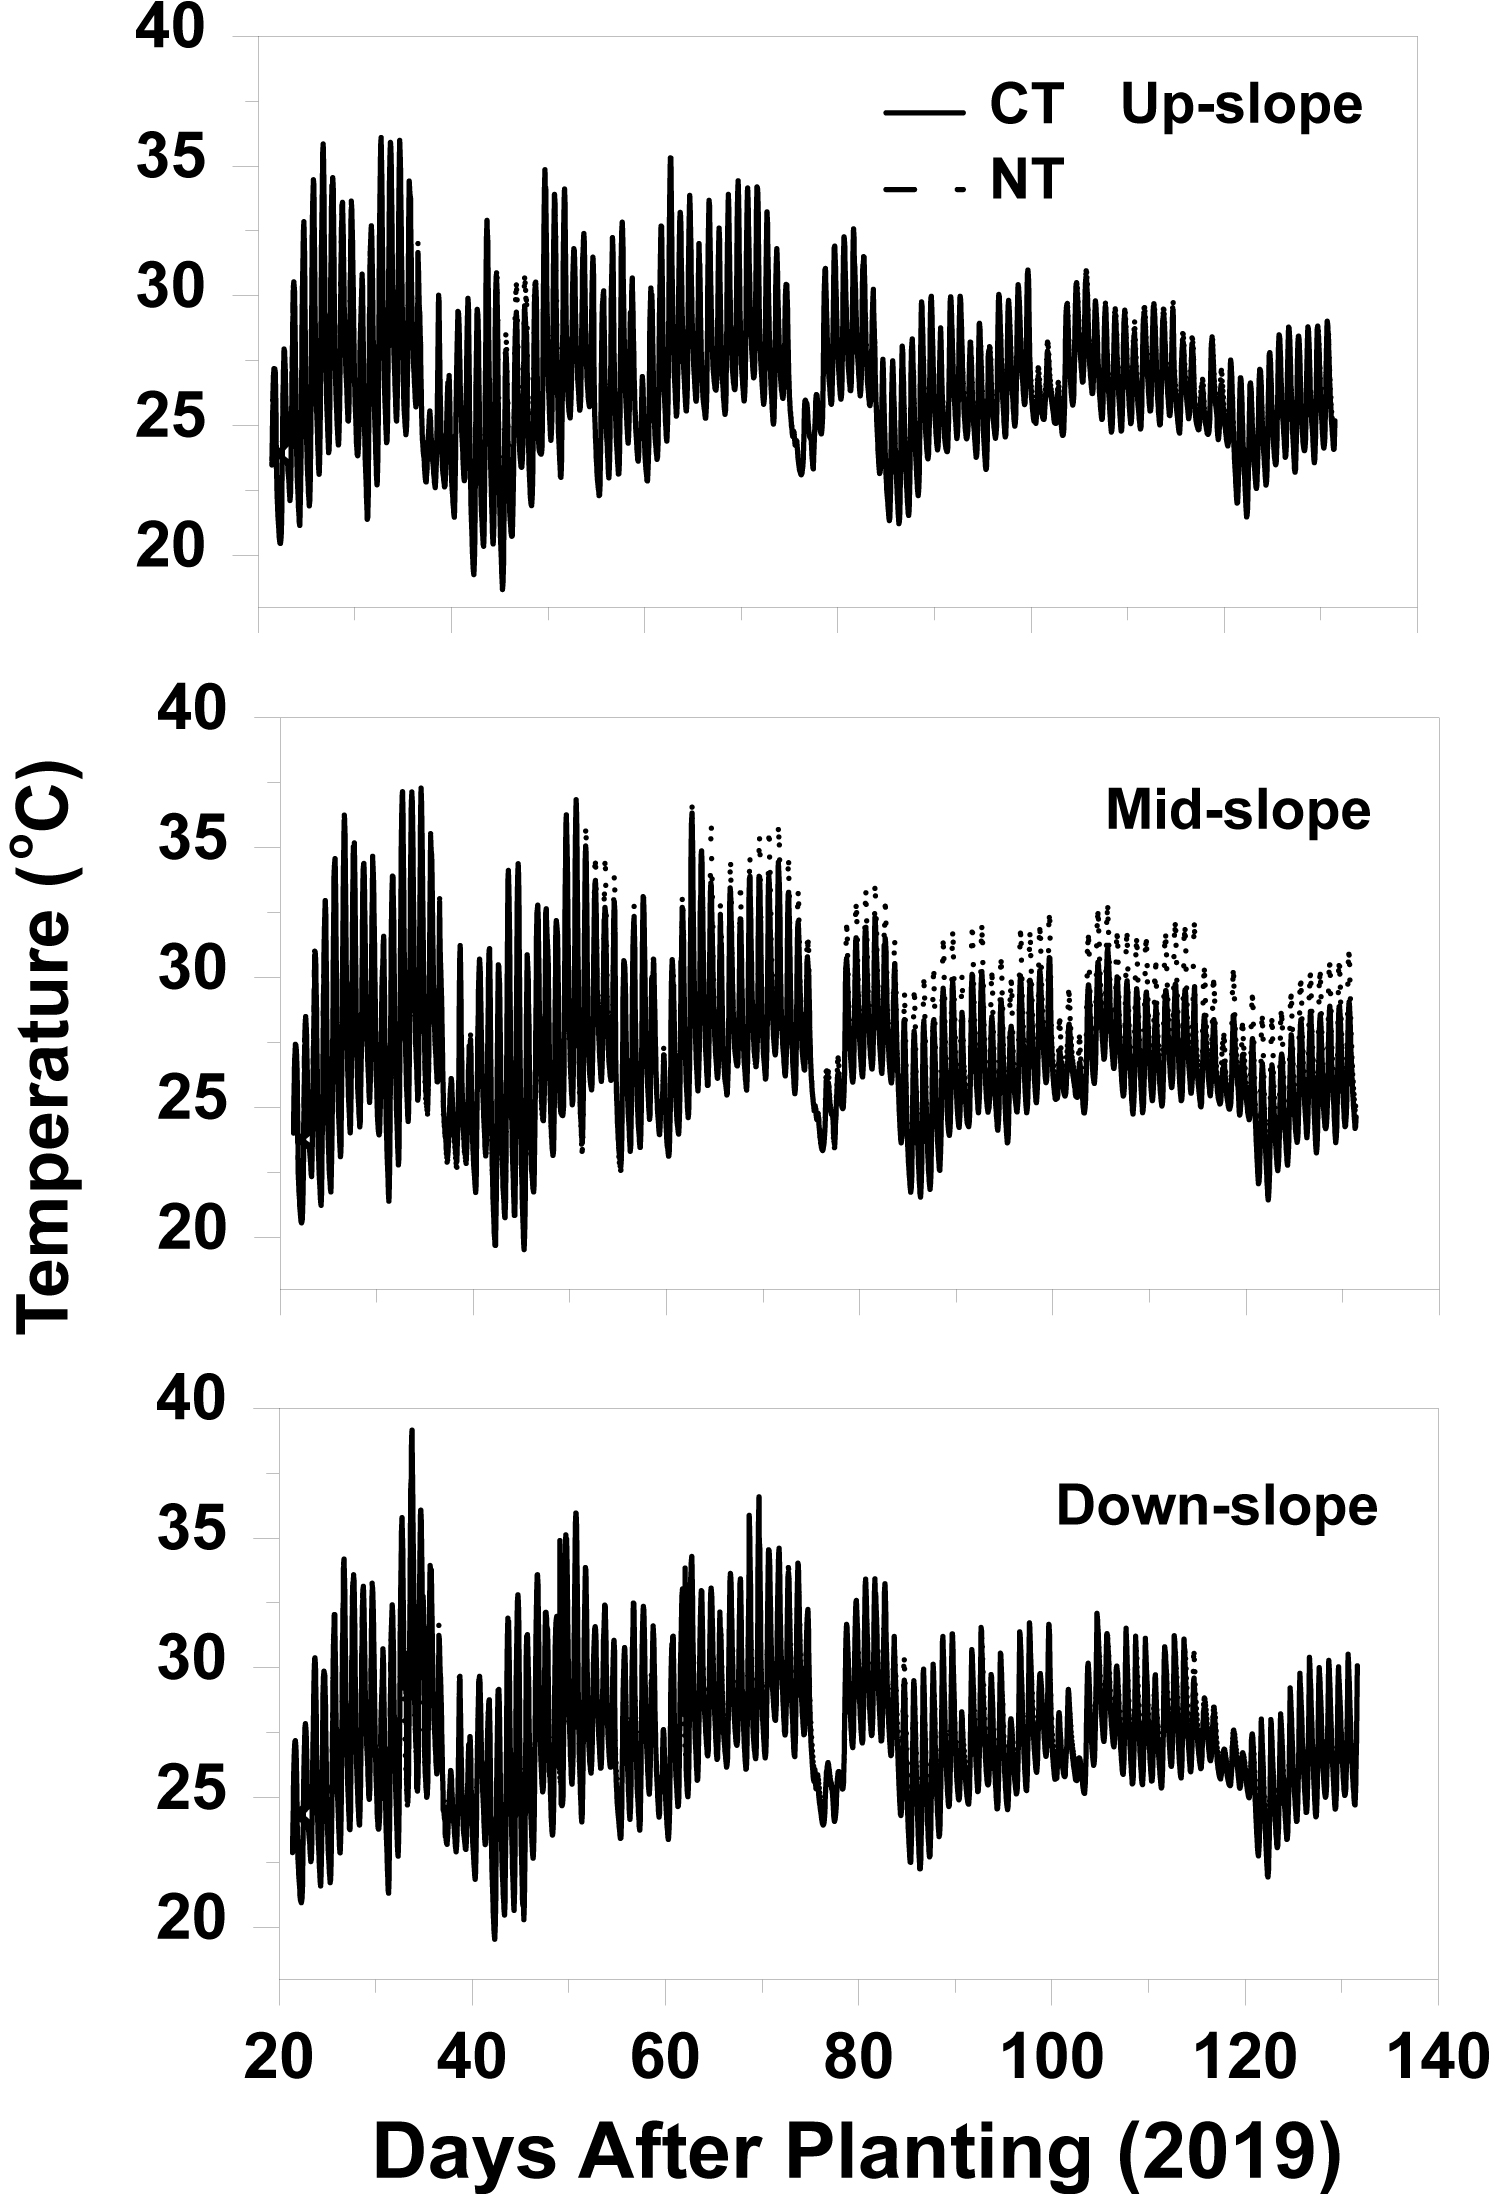
Similar to 2018, soil temperatures measured throughout the growing season in 2019 showed uniform conditions across tillage treatments and site positions (Figure 4). Soil temperatures ranged from 19 ℃ at 45 DAP to 37 ℃ at 33 DAP in 2019 (Figure 4). The average soil temperature for the up-, mid-, and down-slope positions in both tillage treatments was 27 ℃ in 2019. The large decrease in temperature from 70 to 75 DAP, observable in all site position-tillage combinations, most likely was related to a series of rainfall events that occurred during that time period, which delivered a total of 14 cm of rain. The rainfall events, in conjunction with prolonged cloudy sky conditions, likely reduced the amount of solar radiation reaching the soil surface to contribute to the soil temperature reduction [31]. The daily soil temperature fluctuations in the second part of the 2019 growing season, specifically from 75 to 131 DAP, were slightly less in all site position-tillage combinations compared to the daily fluctuations in the first part of the growing season (Figure 4). Similar to 2018, increased canopy coverage likely played a major role in moderating the daily fluctuations of temperature in the second half of the growing season [29]. Compared to 2018 (Figure 3), generally more constant soil temperatures occurred throughout the 2019 growing season at all site position-tillage combinations (Figure 4). In contrast to the frequent variations in VWC measured at the up- and mid-slope positions and differential tillage treatment response over the 2-year period of monitoring, the measured variations in soil temperature, which were essentially unaffected by tillage treatment, would likely have minimal influence on GHG production and would likely not contribute much to a differential tillage treatment effect on season-long GHG emissions.
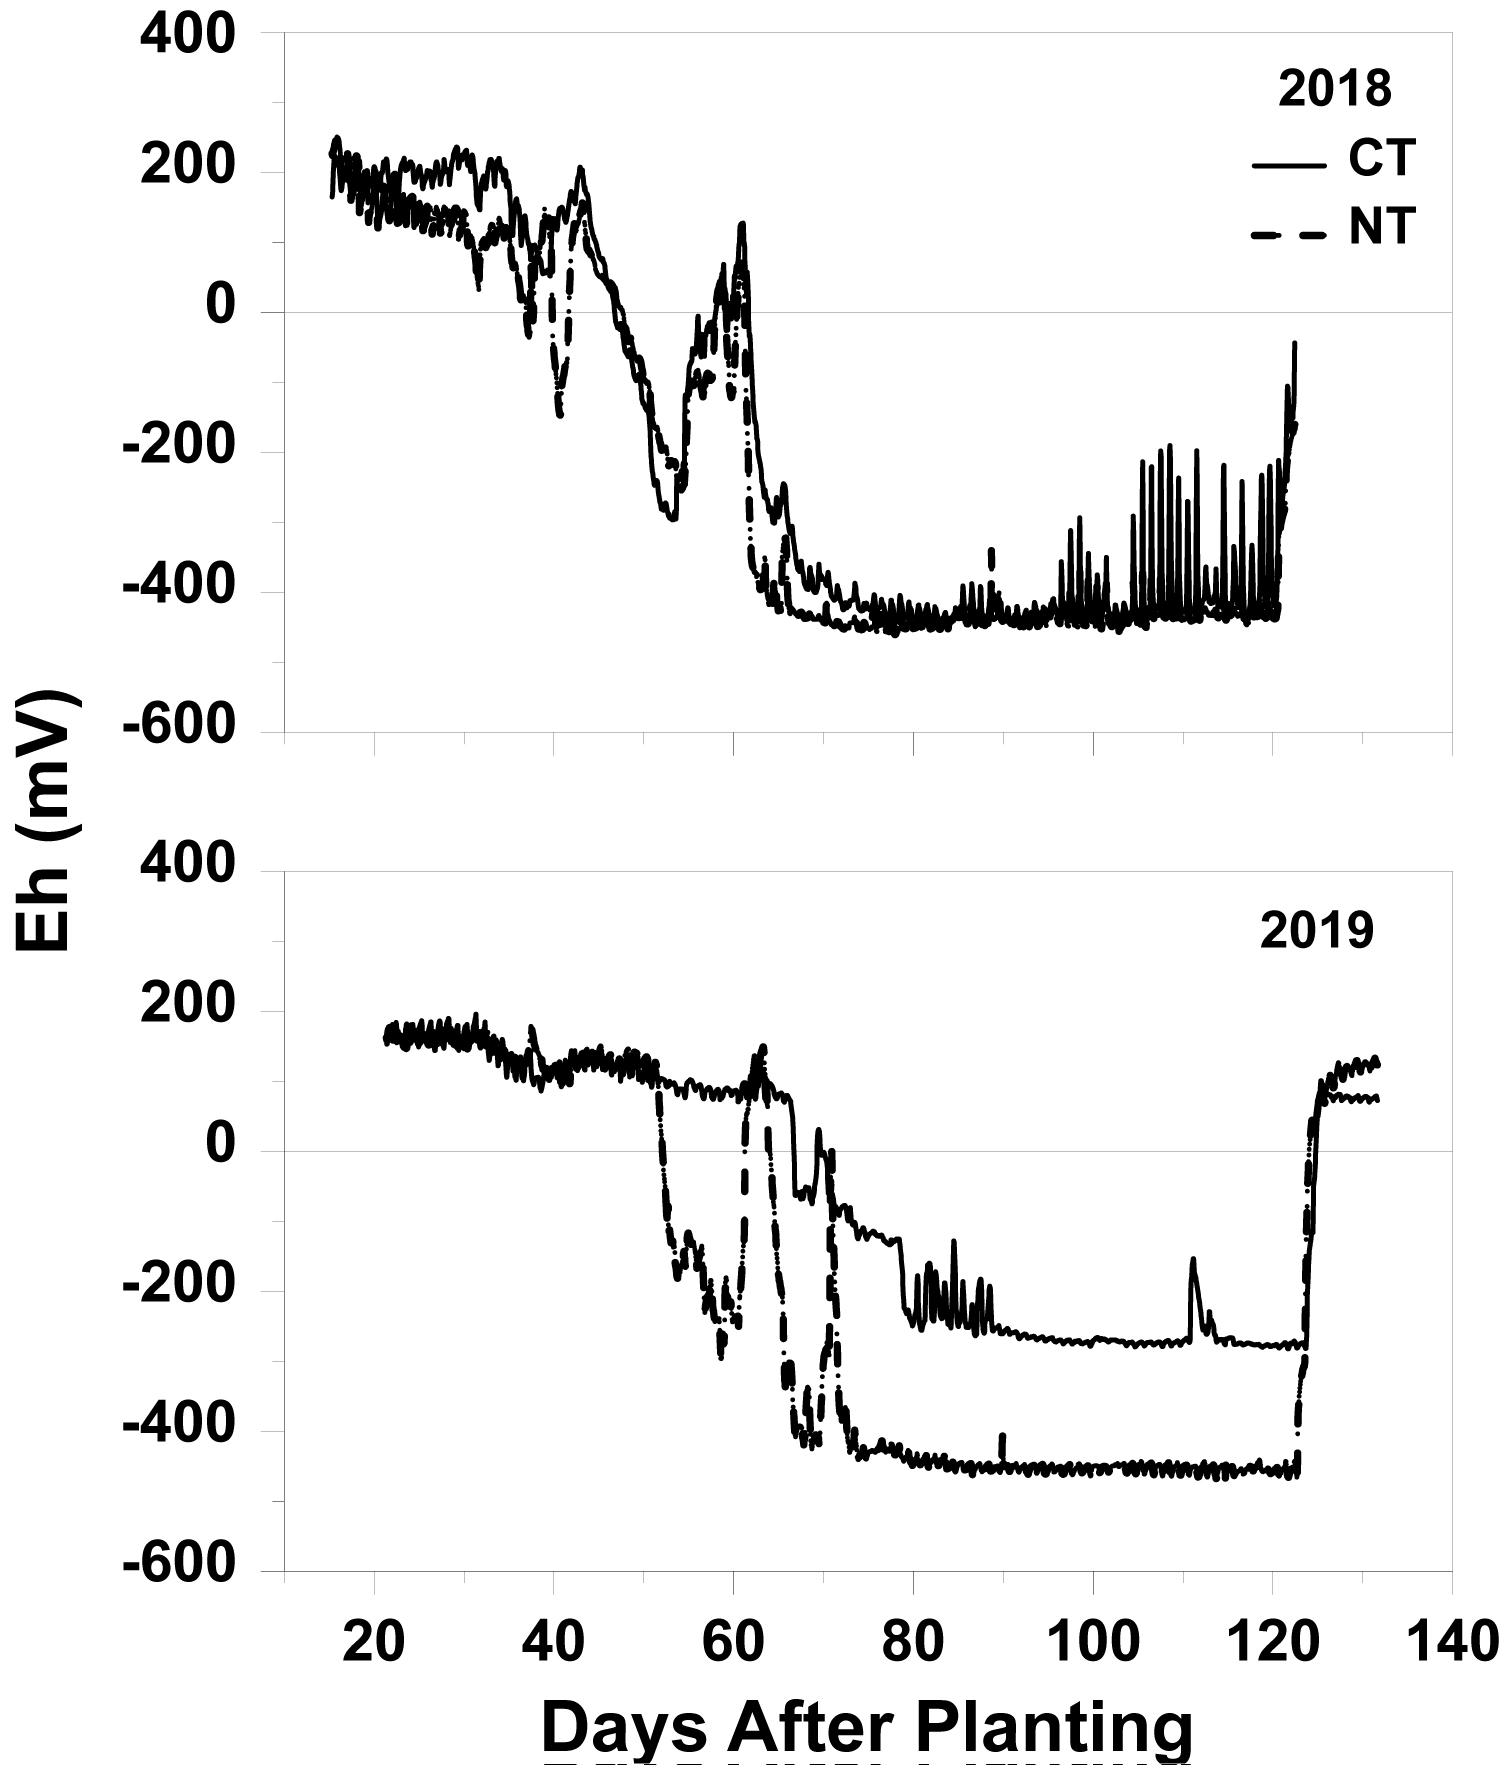
Soil redox potential: Soil redox potential measurements have shown to be useful to better understand the hydrologic control on biogeochemical processes in the soil, offering a quantitative assessment of the intensity of coupled oxidation-reduction reactions operating simultaneously in a dynamic system like the pedosphere [32]. Soil redox potentials measured at the down-slope position in 2018 and 2019 (Figure 5) showed that a somewhat different set of environmental conditions occurred at the down- compared to the up- and mid-slope positions throughout the two growing seasons. The differential conditions were due to the ponded water that often occurred at the down-slope position as the furrow-irrigation water accumulated before being recirculated to and re-applied at the top of the field.
In the 2018 and 2019 growing seasons, both tillage treatments had soil Eh values at the down-slope position between 150 and 230 mV at the beginning of the measurement period (Figure 5), indicating that aerobic conditions were prevalent [32] when Eh measurements started. Studies on correlations between levels of oxygen (O2) and soil redox potentials showed that aerobic soils have redox potentials greater than 200 mV, while soils with redox potentials between 200 and -150 mV had O2-deficient conditions, and soils with redox potentials below -150 mV were described as anaerobic [32-34]. The general trend at the down-slope position in both growing seasons was similar, with redox potentials that decreased as more ponded water accumulated and persisted (Figure 5). However, redox potential fluctuations during the two growing seasons depicted distinctively different environmental conditions (Table 2 and Figure 5).
In 2018, soil under NT reduced at a faster rate than under CT (Figure 5), which has been previously reported for rice grown on the same soil in east-central Arkansas [17]. From 15 to 32 DAP, soil redox potentials under NT in the down-slope position numerically decreased from 245 to 40 mV, while redox potentials under CT numerically decreased from 200 to only 175 mV (Figure 5). The greater concentration of easily decomposable organic compounds under NT, due to the partial presence of surface residues, likely contributed to faster consumption of oxygen during the respiratory phase of microbial decomposition [35]. Anaerobic conditions were achieved by 50 DAP in both tillage treatments and maintained until 55 DAP and were achieved again at 61 DAP and maintained until 121 DAP (Figure 5). The aerobic conditions from 55 to 60 DAP were most likely a result of the discontinuous presence of ponded water during the first half of the growing season, allowing diffusion of atmospheric O2 into the soil and the subsequent rapid numeric increase in the soil redox potential (Table 2 and Figure 5). Greater fluctuations between aerobic and O2-limited conditions occurred under CT than under NT (Table 2). The steep numeric decline in redox potential measured in both tillage treatments from 32 to 37 DAP was related to the combination of irrigation application and rainfall to accomplish the management practice referred to as flushing. After flushing, the soil was left to dry to favor percolation and to move the recently applied urea-N fertilizer into the subsoil, close to the root zone (Figure 5, [36]).
Similar to early in the growing season, the numerically rapid decline of redox potentials under NT in the down-slope position at 38 DAP was most likely related to the largest single irrigation application (5.1 cm ha-1 of water) that started at 34 DAP and reached the down-slope position a few days later (Figure 5). The delayed decline in redox potentials under CT during the same time period was likely due to the micro-topographic differences between tillage strips. Field observations revealed that, while water was accumulating at the down-slope position, soil under NT wet up faster than under CT (Figure 5). Initially, following the irrigation cycles from 31 to 67 DAP, continuously ponded water was observed under NT, but not under CT.
From 42 DAP to the end of the 2018 growing season, soil redox potential trends were similar under both tillage treatments, where redox potentials under CT appeared to vary more than under NT due to the micro-topographic differences in the tillage strips along the length of the furrow-irrigated field (Figure 5). Anaerobic conditions achieved at 62 DAP, and maintained up to 121 DAP, were reversed when the ponded water was released from the down-slope end of the field to dry the soil in preparation for harvest (Figure 5).
In 2019, the down-slope position had redox potentials that ranged from 170 mV to -450 mV and from 170 mV to -280 mV under NT and CT, respectively (Figure 5). From 21 to 50 DAP, soil redox potential trends were similar under both tillage treatments, where soil Eh slightly numerically decreased from 170 to 90 mV, creating O2-deficient soil conditions (Table 2 and Figure 5). While redox potentials decreased from 50 to 79 DAP under CT, when anaerobic conditions were achieved, soil redox potentials under NT varied more, likely due to micro-topographic differences that affected the presence and maintenance of ponded water at the down-slope position (Table 2 and Figure 5).
Similar to the 2018 growing season, ponded water accumulated faster under NT than under CT in 2019 (Figure 5). Ponded water was visually observed under NT in the down-slope position during the first half of the 2019 growing season, but not under CT. Anaerobic conditions were achieved earlier under NT (~ 70 DAP) than under CT, which were not achieved until 78 DAP. Anaerobic conditions were maintained in both tillage treatments until 123 DAP, but numerically greater soil reduction occurred under NT than under CT (Figure 5). Soil redox potentials under NT in the down-slope position remained below -400 mV from 71 to 121 DAP, while soil redox potentials under CT during the same time period never reached below -270 mV (Figure 5). From 121 DAP to the end of the 2019 growing season, both tillage treatments experienced a similar numerically increasing trend in soil redox potentials in the down-slope position due to the release of the ponded water and the soil drying before harvest (Figure 5).
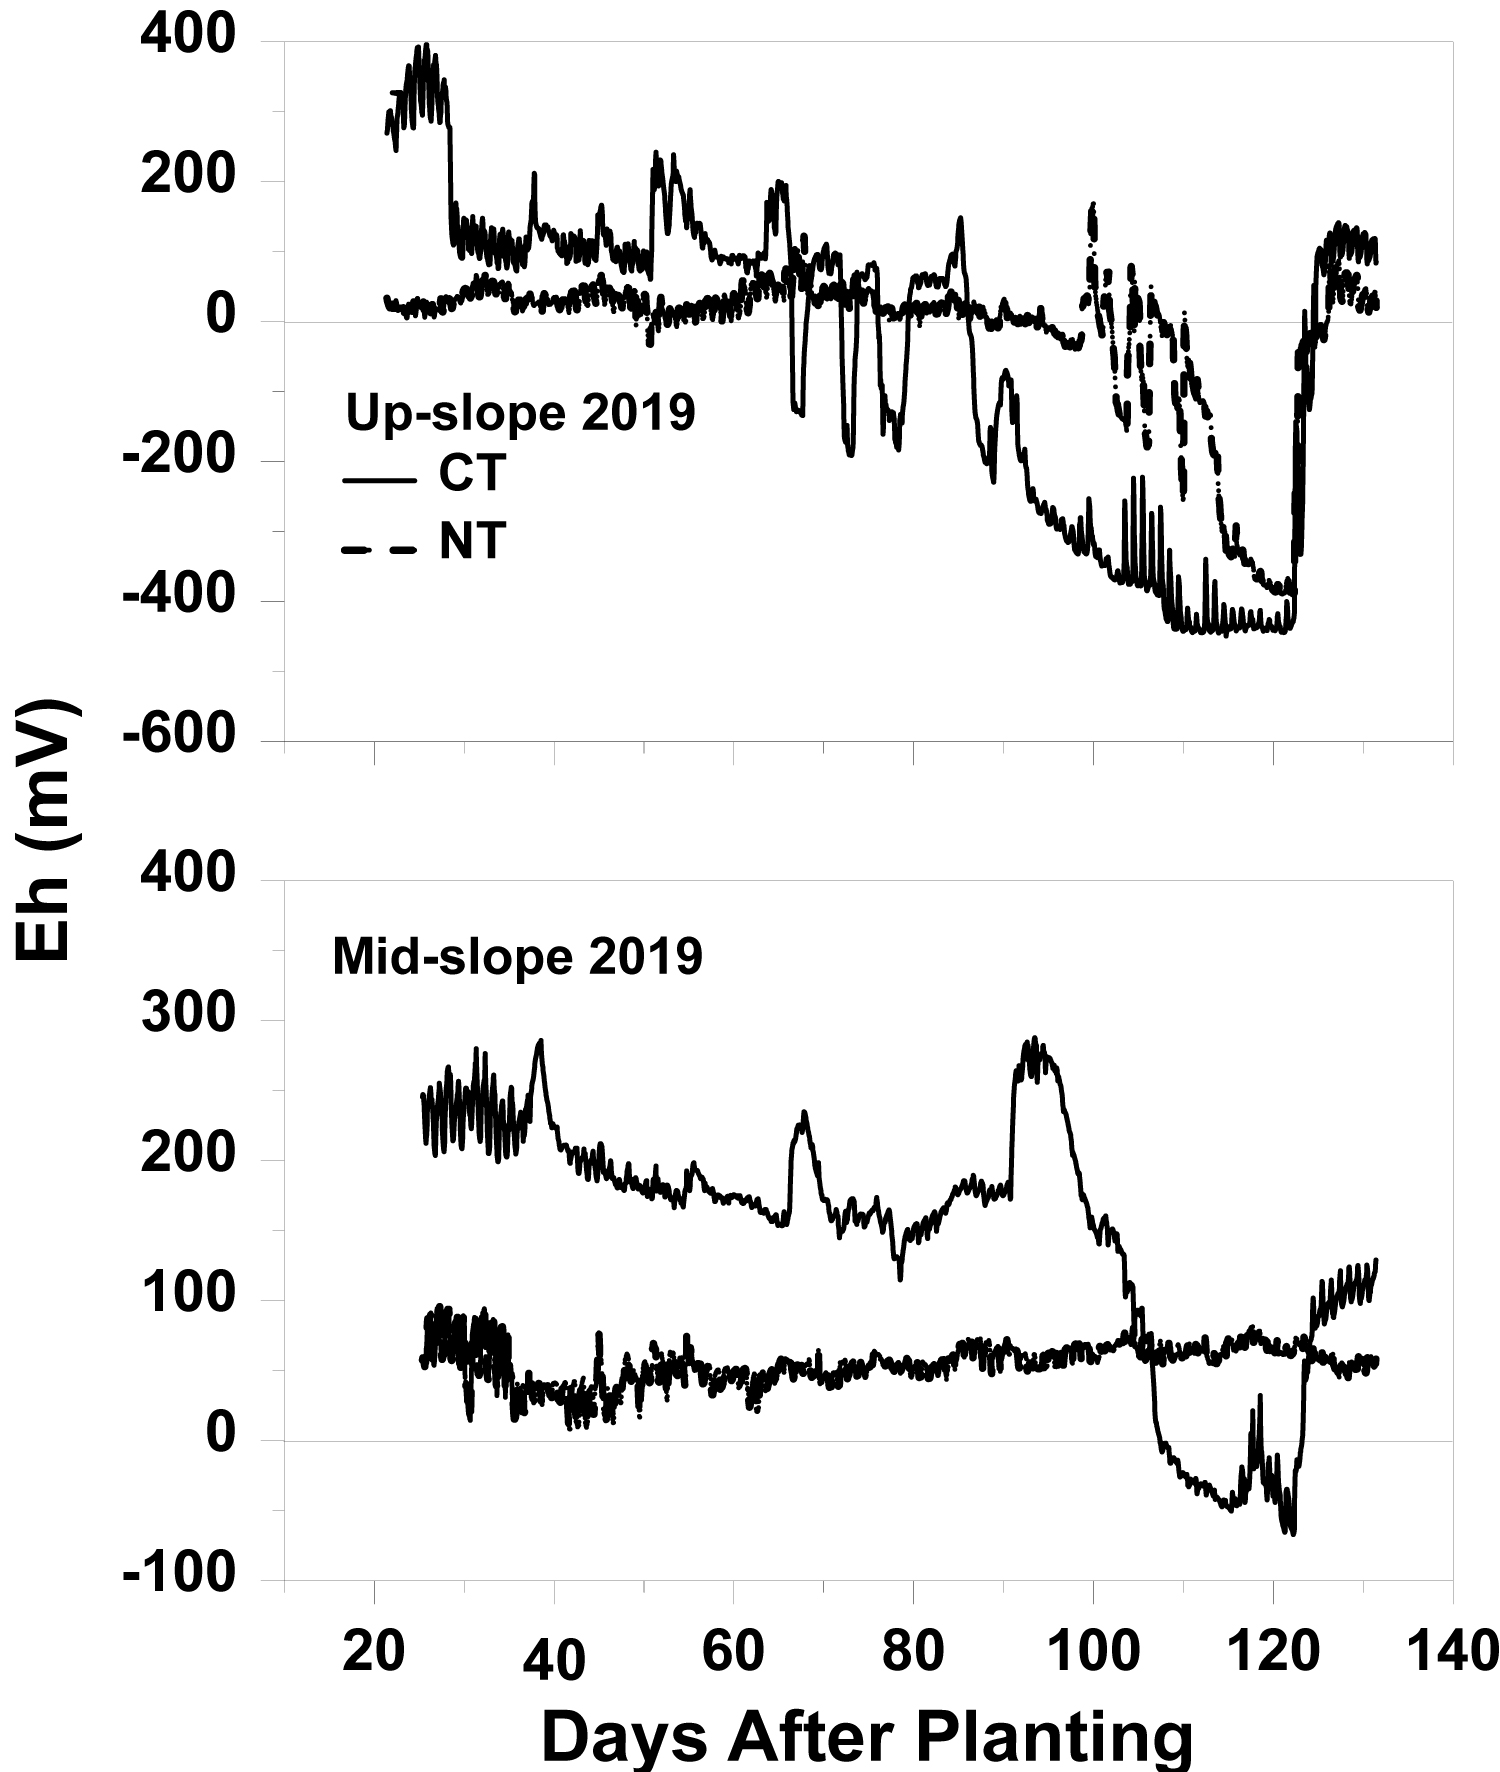
Results from redox potential measurements in the up- and mid-slope positions in 2019 (Figure 6) highlighted the environmental factor variability associated with furrow-irrigated rice production that, in turn, can substantially influence GHG emissions. Soil redox potentials under NT in the up-slope position remained relatively uniform from 21 to 97 DAP, ranging from 105 to -19 mV (Figure 6). During the same time period in 2019, soil redox potentials under CT fluctuated more than under NT, ranging from 400 to -200 mV (Table 2 and Figure 6). Anaerobic conditions were achieved in the up-slope position by 92 and 102 DAP under CT and NT, respectively, and were maintained until 122 DAP (Figure 6). The delayed, numeric redox potential decline under NT in the up-slope position (Figure 6) was most likely related to the non-uniform movement of the irrigation-water wetting front. The soil water content under CT in the up-slope position was numerically greater than under NT for most of the 2019 growing season (Figure 2). As observed in the down-slope position, the drying process at the end of the growing season in preparation for harvest resulted in a rapid numeric increase in redox potentials from approximately -455 mV at 121 DAP to approximately 130 mV at 131 DAP in both tillage treatment (Figure 6).
As measured in the up-slope position, soil redox potentials in the mid-slope position were relatively constant under NT throughout the 2019 growing season, ranging from 92 mV at 27 DAP to 11 mV at 41 DAP (Figure 6). For the entire duration of measurements in 2019, soil redox potentials under NT in the mid-slope position resulted in O2-deficient conditions without ever achieving actual anaerobic levels. The greater soil bulk density under NT than under CT [24] resulted in lower porosity and likely lower O2 diffusion, reducing the potential of the mid-slope to reduce under NT (Figure 6). Soil redox potentials under CT in the mid-slope position fluctuated more, from 280 mV at 38 and 92 DAP to -60 mV at 122 DAP, than under NT in the mid-slope position (Figure 6). Aerobic conditions were present under CT until 42 DAP, while O2-deficient conditions characterized nearly all of the remaining growing season (Figure 6). The variability in soil physical-chemical properties among site position-tillage treatment combinations contributed to the numerically greater fluctuations of Eh under CT than under NT in both growing seasons and numerically greater fluctuations in the up- than in the mid-slope position in 2019 (Table 2). Similar to VWC, but in contrast to temperature, spatial and temporal variations in soil redox potential measured at the up- and mid-slope positions and differential tillage treatment response would likely influence GHG production and would likely result in at least a numerically differential tillage treatment effect on GHG emissions.
Environmental implications
Considering all soil redox potential, soil temperature, and VWC measurements over the 2-year study, optimum ranges and time periods for N2O, CH4, and CO2 production could be determined. Nitrification proceeds at an optimal rate at 70% water-filled soil pore space and soil temperature between 20 and 30 ℃ [37]. Methanogenesis and methanotrophy are processes strongly affected by soil physical and chemical properties, where soil redox potential is the most critical factor for CH4 production. In order to initiate methanogenesis, soil Eh must remain in the range of -100 and -200 mV or lower for at least a period of 14 days [8]. The ideal soil water content for aerobic decomposition and soil respiration (i.e., CO2 production) to occur at the largest, most optimum rate is also around 60% water-filled pore space, which is near field moisture capacity [38].
Optimum conditions for N2O, CO2, and CH4 production across the 2018 and 2019 growing seasons were determined using 60% water-filled pore space, soil temperature between 20 and 30 ºC, and soil Eh less than -110 mV as criteria for N2O, CO2,and CH4, respectively. In 2018, optimal conditions for N2O and CO2 production were met from 15 to 19 DAP in the CT-up-slope combination, at 22, 43, 44, 51, and 63 DAP in the CT-mid-slope combination, at 29 DAP in the NT-mid-slope combination, and from 49 to 54 and from 62 to 122 DAP in the CT-down-slope combination. No optimal conditions occurred in the NT-up- and NT-down-slope combinations. Optimal conditions for CH4 production were met from 62 to 122 DAP and from 50 to 122 DAP in the CT-down- and NT-down-slope combinations, respectively, in 2018.
In 2019, optimal conditions for N2O and CO2 production were met from 25 to 27 and again at 40, 45, 46, 59 and 125 DAP in the CT-up-, at 65 and 79 DAP in the NT-up-, at 22, 44, 46, and 64 DAP in the CT-mid-, and at 57 and 74 DAP in the NT-mid-slope combination. No optimal conditions existed at the down-slope position in both tillage treatments for N2O and CO2 production in 2019. Optimal conditions for CH4 production were met from 87 to 124 DAP and from 109 to 122 DAP in the CT-up- and NT-up-slope combinations, respectively. Optimal conditions for CH4 production were also met from 73 to 124 DAP and from 52 to 123 DAP in the CT-down- and NT-down-slope combinations, respectively, in 2019.
Conclusions
This field study documented soil water content, temperature, and redox potential variations continuously over two consecutive growing seasons in CT and NT at up-, mid-, and down-slope positions in a furrow-irrigated rice production system on a silt-loam soil in eastern Arkansas. The up-slope position experienced more numerous soil moisture and greater redox fluctuations than the mid-slope position. The CT treatment was prone to temporary surfacing crusting, which tended to decrease infiltration and soil water contents at up- and mid-slope positions, while NT promoted infiltration and greater and more consistent soil water contents, particularly later in the growing season when the remnants of the previous year's residue minimized evaporative losses. The NT treatment, particularly at the down-slope position, experienced faster soil reduction, reaching lower Eh values in both growing seasons, than under CT.
Compared to the traditional full-season-flood water management scheme for rice production, which maintains a continuously, non-varying, saturated, ponded soil for approximately three months of the growing season, the relatively frequent wetting-drying cycles that occur in the up- and mid-slope positions, roughly one-third of the area, in a furrow-irrigated rice field make weed management and uniform crop production challenging and may greatly exacerbate GHG production and emissions. Variations in soil water contents and redox potential will likely have a greater effect on GHG production and potential differential tillage treatment response than soil temperature variations. Though one of the several reasons furrow-irrigated rice was developed was to conserve and more efficiently use water, which is another major issue for rice production in the United States, particularly in eastern Arkansas, the potential for increased GHG emissions may result in increased global warming potential, thus affecting the apparent environmental friendliness and future sustainability of the furrow-irrigated rice production system. Research efforts will need to focus on quantifying spatial and temporal variations in GHG fluxes throughout a furrow-irrigated rice field and investigate relationships among GHG fluxes and emissions and environmental factors known to influence GHG production, namely soil water content, temperature, and redox potential.
Acknowledgments
Dustin Pickelmann, Vaishali Kandpal, Joshua Humphreys, Tyler Durre, Ryder Anderson, and Shelby Lebeau are gratefully acknowledged for assistance in the field or laboratory.
References
- United States Department of Agriculture (USDA) (2019) National agriculture statistic service arkansas crop production, USA.
- United States Geological Survey (USGS) (2010) Water levels and selected water-quality conditions in the Mississippi river valley alluvial aquifer in Eastern Arkansas, 2008. US Geological Survey.
- He C (2010) Effects of furrow irrigation on the growth, production, and water use efficiency of direct sowing rice. Sci Word J 10: 1483-1497.
- Food and Agriculture Organization (FAO) (2011) Save and Grow: A policymaker's guide to the sustainable intensification of smallholder crop production. Food and Agriculture Organization of the United Nations. Rome, Italy.
- Ockerby SE, Fukai S (2001) The management of rice grown on raised beds with continuous furrow irrigation. Field Crop Res 69: 215-226.
- Vories ED, Counce PA, Keisling TC (2002) Comparison of flooded and furrow-irrigated rice on clay. Irrig Sci 2: 139-144.
- Bagavathiannan MV, Norsworthy JK, Scott RC (2011) Comparison of weed management programs for furrow-irrigated and flooded hybrid rice production in Arkansas. Weed Technol 25: 556-562.
- Oo AZ, Bellingrath-Kimura KTW, Bellingrth-Kimura SD (2015) Within field spatial variation in methane emissions from lowland rice in Myanmar. Springer Plus 4: 145-155.
- van der Gon HAC, van Breemen N, Neue H, et al. (1996) Release of entrapped methane from wetland rice fields upon soil drying. Global Biogeochem Cycles 10: 1-7.
- Gogoi N, Baruah KK, Gogoi B, et al. (2005) Methane emission characteristics and its relations with plant and soil parameters under irrigated rice ecosystem of northeast India. Chemosphere 59: 1677-1684.
- Rogers CW, Brye KR, Smartt AD, et al. (2014) Cultivar and previous crop effects on methane emissions from drill-seeded, delayed-flood rice production on a silt-loam soil. Soil Sci 179: 28-36.
- Liu Y, Wan K, Tao Y, et al. (2013) Carbon dioxide flux from rice paddy soil in central China: Effects of intermittent flooding and draining cycles. PLoS One 8: 1-8.
- Nishimura S, Yonemura S, Minamikawa K, et al. (2015) Seasonal and diurnal variations in net carbon dioxide flux throughout the year from soil in paddy field. J Geophys Res Biogeosci 120: 63-76.
- Motschenbacher JM, Brye KR, Anders MM, et al. (2015) Daily soil surface CO2 flux during non-flooded periods in flood-irrigated rice rotations. Agron Sustain Dev 35: 771-782.
- Bateman EJ, Baggs EM (2005) Contributions of nitrification and denitrification to N2O emissions from soils at different water-filled pore space. Biol Fertil Soils 41: 379-388.
- Peyron M, Bertora C, Pelissetti S, et al. (2016) Greenhouse gas emissions as affected by different water management practices in temperate rice paddies. Agric Ecosyst Environ 232: 17-28.
- Rector C, Brye KR, Humphreys J, et al. (2018) Tillage and coated-urea effects on nitrous oxide emissions from direct-seeded, delayed-flood rice production in Arkansas. J Rice Res Dev 1: 25-37.
- Barker JB, Franz TE, Heeren DM, et al. (2017) Soil water content monitoring for irrigation management: A geostatistical analysis. Agri Water Manage 188: 36-49.
- United States Department of Agriculture (USDA) (2006) Major land resource areas. The Caribbean, and the Pacific Basin.
- United States Department of Agriculture (USDA), Natural Resource Conservation Service (NRCS) (2014) Dewitt soil series.
- United States Department of Agriculture (USDA) (2019) Web soil survey.
- National Oceanic and Atmospheric Administration (NOAA) (2010) Data tools: 1981-2010 Climate Normals.
- Kandpal V (2018) Evaluation of a solar powered flow tail water recovery system for furrow irrigation. University of Arkansas, Fayetteville, USA.
- Della Lunga D, KR Brye, JM Slayden, et al. (2020) Chamber effects on soil moisture and plant productivity in furrow-irrigated rice on a silt-loam soil in Arkansas. J Rice Res Dev 3: 66-73.
- United States Department of Agriculture (USDA), Natural Resources Conservation Service (NRCS), (2005) National soil survey handbook.
- Negassa W, Price RF, Basir A, et al. (2015) Cover crop and tillage systems effect on soil CO2 and N2O fluxes in contrasting topographic positions. Soil Till Res 154: 64-74.
- Yan X, Du L, Shi S, et al. (2000) Nitrous oxide emission from wetland rice soil as affected by the application of controlled-availability fertilizers and mid-season aeration. Biol Fertil Soils 32: 60-66.
- Song YT, Zhou DW, Zhang HX, et al. (2013) Effects of vegetation height and density on soil temperature variations. Chinese Sci Bull 58: 907-912.
- Mandal KG, Misra AK, Hati KM, et al. (2004) Rice residue-management options and effects on soil properties and crop productivity. Food Agri Environ 2: 224-231.
- Brady NC, Weil RR (2008) The Nature and Properties of Soils. (14th edn), Upper Saddle River, NJ: Pearson Prentice Hall, 975.
- Knutti R, Stocker TF, Joos F, et al. (2002) Constraints on radiative forcing and future climate change from observations and climate model ensembles. Nature 416: 719-723.
- Wang J, Bogena HR, Vereecken H, et al. (2018) Characterizing redox potential effects on greenhouse gas emissions induced by water-level changes. Vadose Zone J 17: 1-13.
- Rubol S, Silver WL, Bellin A (2012) Hydrologic control on redox and nitrogen dynamics in a peatland soil. Sci Total Environ 432: 37-46.
- Masscheleyn PH, DeLaune RD, Patrick WH (1993) Methane and nitrous oxide emissions from laboratory measurements of rice soil suspension: Effect of soil oxidation–reduction status. Chemosphere 26: 251-260.
- Clay DE, Clapp CE, Linden DR, et al. (1992) Tillage influence on redox potential following rainfall. Soil Till Res 22: 211-219.
- Ando T, Yoshida S, Niiyama I (1983) Nature of oxidizing power of rice roots. Plant Soil 72: 57-71.
- Lai TV, Denton MD (2017) N2O and N2 emissions from denitrification respond differently to temperature and nitrogen supply. J Soils Sediments 18: 1548-1557.
- Eswaran H, Reich PF, Kimble J, et al. (2000) Global carbon stocks. In: Lal R, Kimble J, Levine E, Stewart BA, Global climate change and pedogenic carbonates. Lewis Publisher, Boca Raton, Florida, 15-26.
Corresponding Author
Diego Della Lunga, Department of Crop, Soil, and Environmental Sciences, University of Arkansas, 115 Plant Sciences Building, Fayetteville, AR 72701, USA.
Copyright
© 2020 Della Lunga D, et al. This is an open-access article distributed under the terms of the Creative Commons Attribution License, which permits unrestricted use, distribution, and reproduction in any medium, provided the original author and source are credited.