Chamber Effects on Soil Moisture and Plant Productivity in Furrow-Irrigated Rice on a Silt-Loam Soil in Arkansas
Abstract
Furrow-irrigation is a relatively new rice (Oryza sativa L.) production practice that results in large variations in near-surface soil water contents along the long length of a furrow-irrigated field that may have major impacts on the ability to accurately measure and quantify greenhouse gas (GHG) emissions. The objective of this study was to evaluate the effects of tillage [conventional tillage (CT) and no-tillage (NT)], site position, and GHG chamber presence on soil volumetric water content (VWC), above ground biomass, and yield in a furrow-irrigated rice production system in eastern Arkansas. Research was conducted during 2018 and 2019 growing seasons on a DeWitt silt loam (fine, smectitic, thermic Typic Albaqualf) near Stuttgart, AR. Eighteen, 30-cm-diameter, polyvinyl chloride (PVC) base collars were installed on top of 30-cm wide beds into which rice was drill-seeded in CT and NT strips at an up-, mid-, and down-slope position. On 10 and 15 different weekly dates in 2018 and 2019, respectively, soil VWC in the top 6 cm was measured inside and outside the base collars and above ground dry matter and yield were measured at the end of the season. On six of 10 and 15 weeks during both seasons, the difference in VWC inside and outside the base collars did not differ (P > 0.05) for any of the six tillage-site position combinations. Soil VWC differed between inside and outside the base collars in only 8 and 16% of the total measurements in 2018 and 2019. Above ground dry matter and yield did not differ between inside and outside the base collars in four and three of six tillage-site position combinations in 2018 and did not differ in all treatment combinations in 2019. Results demonstrated that the presence of base collars, commonly used for GHG emissions measurements in flood-irrigated rice, did not have a substantial effect on soil moisture or plant productivity, strengthening the validity and applicability of the closed-chamber method for in-field GHG measurements in furrow-irrigated rice production.
Keywords
Conventional tillage, No-tillage, Gas emission measurements
Introduction
Agriculture in the United States (US) accounts for a substantial portion of GHG emissions into the atmosphere. In 2012, estimated total emissions from agricultural fields were 526.3 Tg of CO2 equivalents. Greenhouse gas emissions in the agricultural sector are projected to increase 20% by 2030, while GHG emissions from rice (Oryza sativa) alone are projected to increase by 2% [1]. Among the six states where rice is produced in the US (i.e., Arkansas, Texas, Louisiana, Mississippi, Missouri and California), Arkansas led the state ranking in estimated CH4 emissions with 2.6 Tg of CO2 equivalents in 2012, due to Arkansas having the largest rice production among the rice-producing states [2].
Rice is unique among almost all other cultivated crops in that rice is commonly grown under flooded-soil conditions. Arkansas receives an average of 117 to 137 cm of rainfall annually, between late spring and early summer during the critical phases of the growing season.
Precipitation alone is insufficient, thus causing excessive withdraws from the aquifers [3]. The water used for irrigating rice mostly comes from surface reservoirs or groundwater aquifers through the use of wells [4]. In 2015, 98% of the 31.2 million m3 d-1 pumped from aquifers in the US were used for crop irrigation [5]. In 2015 in Arkansas, the counties with the largest volume of water usage were Jefferson and Arkansas County, with an average of 160,123 and 101,827 m3 d-1, respectively [5]. The Mississippi Alluvial Plain covers 82,879 km2 and underlies approximately one third of Arkansas [3]. The Sparta/Memphis aquifer in the Mississippi Alluvial Plain, which is classified as an alluvial aquifer, extends from Missouri to the north to Louisiana to the south [3] and is one of the main sources of agricultural irrigation water in Arkansas. Reports indicate that 83% of the rice fields in Arkansas rely on groundwater for irrigation [3]. In 2006, Arkansas County registered the lowest water-level of the aquifer (21 m above National Geodetic Vertical Datum), with the largest depression in potentiometric surface (-0.3 m) [3]. The annual aquifer decline in Arkansas has been estimated to be 0.15 m yr-1 [3].
With increasing water-shortage conditions, research on effective water use in rice production has been initiated [6]. Different water management and field preparation practices greatly affect GHG production and emissions from rice fields [7]. Continuous flooding, intermittent flooding, alternate wetting drying (AWD), and delayed flooding (DF), in combination with cultural practices like conventional tillage (CT) or no-tillage (NT), have been studied to determine the environmental impact of different combinations of practices. The drying process in the AWD and DF treatments showed a reduction in soil oxidation-reduction (redox) potential and favored oxidation and microbial reactions such as nitrification of ammonium hydrolyzed from synthetic fertilizers (i.e., urea). As a result, CH4 emissions decreased, however, N2O emissions increased compared to emissions from continuously flooded conditions [8]. Furthermore, NT reduced soil erosion and increased organic matter and C substrate that can affect the production of N2O in a rice field [9].
In addition to AWD and DF, furrow-irrigation is another alternative water management scheme being tested in rice production. The furrow-irrigation system uses gravity and the field's slope to distribute water in furrows adjacent to raised beds along the length of the field. Due to the field's slope, the soil along the length of the field tends to experience temporal variability and dynamic wetting and drying cycles, with the lowest-elevation portion of the field often flooding over time in the growing season and behaving like the continuous-flood system. Furthermore, studies on furrow-irrigation systems showed increased water use efficiency (WUE) compared to conventional irrigation (CI) systems (i.e., flooding; [6]). The widely varying soil moisture conditions within a furrow-irrigated field can exacerbate GHG emissions, particularly N2O.
The most-used, in-field system to quantify GHG fluxes and emissions is the non-steady-state, non-flow-through, closed-chamber method [10]. The chamber method allows measurements to be obtained from small areas relying on the change of gas concentrations over time [10]. In a furrow-irrigated setting, the actual presence of the chamber base that needs to be installed may affect soil moisture dynamics, such that the soil moisture inside the chamber base may differ from that outside the chamber. If such soil moisture differences arise, plant growth and productivity could consequently be affected as well. However, only one known study has been conducted to evaluate possible chamber effects on GHG emissions from rice production [11]. Smart, et al. [11] conducted a field study in 2012 on a Sharkey clay (Chromic Epiaquerts) in northeast Arkansas to evaluate the potential effects of chamber diameter (i.e., 15- and 30-cm diameters) on GHG emissions in flood-irrigated rice.
The goal of this field study was to evaluate the applicability of the standard, closed-chamber method for quantifying GHG fluxes and emissions from the furrow-irrigated rice production system. The specific objective of this study was to evaluate the effects of tillage (i.e., CT and NT), site position (i.e., up-, mid-, and down-slope), and chamber (i.e., inside and outside the chamber) on soil water content throughout the growing season and end-of-season above ground biomass and yield in the furrow-irrigated rice production system in eastern Arkansas. It was hypothesized that the installed chamber base collars would not affect soil moisture content or plant productivity (i.e., aboveground biomass and yield) differentially among tillage and site position treatment combinations.
Materials and Methods
Site description
This field study was conducted during 2018 and 2019 at the Rice Research and Extension Center (RREC) (34°27'58.49"N, 91°24'19.67"W) near Stuttgart in Arkansas County in Major Land Resource Area 131D, or Southern Mississippi River Terraces [12], in the region locally referred to as the Grand Prairie. The research area was located on quaternary alluvial terrace deposits in the Bayou Meto basin of the Lower Mississippi River Valley on a DeWitt silt loam (fine, smectitic, thermic Typical Albaqualfs), which is a poorly drained, slowly permeable soil that has been under cultivated agriculture for at least 15 years. The study area was approximately 400-m long and 12-m wide, with an average slope of 2%.
Experimental design and agronomic management
Half of the study area was conventionally tilled on 5 May, 2018 with a disk, field cultivator, and a raised, ~ 76-cm-row-spaced bedder roller. The second treatment constituted a stale-seed-bed cultural practice, referred here after as NT, where the prior year's beds were left intact and the area was treated with a NT furrow runner implement (Perkins Sales Inc., Bernie, MO) to create a small slot to ensure water flow was maintained in each furrow due to the shallowness of the pre-existing beds.
The study area was planted on 17 May 2018 with the hybrid cultivar CL7311 (RiceTec, Alvin, TX) and was planted on 30 April 2019 with the hybrid cultivar 214-Gemini (RiceTec). Seeds were directly drilled at a rate of 28 and 21 kg ha-1 with 19-cm row spacing in 2018 and 2019, respectively. Hybrid rice generally has better tillering capacity than pure line cultivars, which allows for lower seeding rates. Furthermore, the hybrid cultivar 214-Gemini specifically has superior tillering capacity compared to CL7311, which was responsible for the differences in hybrid rice seeding rates between 2018 and 2019. On 5 June 2018, the study area was mechanically broadcast-amended with 101 kg ha-1 of potassium (K) as muriate of potash and 67 kg ha-1 of phosphorus (P) applied as diammonium phosphate. On 13 June, 2018, the study area was mechanically broadcast-amended with 168 kg ha-1 of nitrogen (N) as coated urea (46-0-0). On 16 May, 2019, shortly after planting, the study area was mechanically broadcast-amended with 67 kg ha-1 of K applied as muriate of potash, 67 kg ha-1 of P applied as triple super phosphate, 11 kg ha-1 of zinc (Zn) applied as zinc 20, and 23 kg ha-1 of N and 27 kg ha-1 of sulfur (S) applied as ammonium sulfate. On 3 June 2019, at the 3- to 4-leaf stage, the study area was mechanically broadcast-amended with 168 kg N ha-1 as coated urea.
The study area was furrow-irrigated using 30-cm-diameter, lay-flat poly pipe laid out at the up-slope boundary of the study area and connected to a novel variable flow tail water system [13,14] at the down-slope position that returned tail water at the lower end of the study area back to the crown of the field. The water used for irrigation was from a rain-fed, surface reservoir. Water usage, calculated from April 15 to September 15, was ~ 15 and 12 cm water ha-1 for the 2018 and 2019 rice growing seasons, respectively.
Rainfall data were obtained from a nearby meteorological station located in Stuttgart, Arkansas. Total precipitation, measured from April 15 to September 15, was 36.2 and 59.3 cm of rainfall for the 2018 and 2019 rice growing seasons, respectively.
Chamber installation
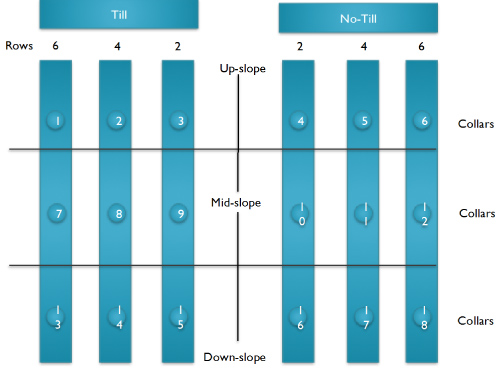
Within 14 days after planting in 2018 and 2019, schedule 40 polyvinyl chloride (PVC) base collars, 30 cm in diameter, 30-cm tall, and 0-6 cm thick, which were beveled to an angle of 45 ℃ at the base, were installed in the study area at the up-, mid-, and down-slope positions in the field (Figure 1). The up-slope position was 91 m from the high-elevation end of the field. The mid-slope position was 91 m down slope from the up-slope position. The down-slope position was 204 m down slope from the mid-slope position and ~ 9 m up-slope from the lowest-elevation end of the field. At each position, three base collars were installed on top of every other raised bed in the CT and NT treatments (Figure 1). Each base collar had four, 12.5-mm-diameter holes equidistant from each other drilled in the side of the base collar 10 cm up from the beveled bottom to allow free movement of the water inside and outside the collar during furrow irrigation. The base collars were installed on top of the beds by pushing them into the soil to a depth of 10 cm, which allowed the drilled holes to intersect the soil surface.
Soil sample collection and processing
On 31 May, 2018, two sets of soil samples were collected from the top 10 cm of each raised beds at the three site positions. One set of soil samples was collected with a 4.8-cm-diameter, stainless steel core chamber and slide hammer for bulk density determinations, while the other set of soil samples was collected with a 2-cm-diameter manual push probe for particle-size analysis and soil organic matter (SOM) evaluations. All samples were oven-dried at 70 ℃ for 48 hours, ground, and sieved through 2-mm mesh screen. Particle-size analyses were conducted using a modified 12-hr hydrometer method [15]. Soil organic matter concentration was determined by weight-loss-on-ignition at 360 ℃ for 2 hours. Measured SOM concentrations were converted to contents (Mg ha-1) using the measured bulk density and 10-cm sample depth interval.
Water content measurements
On 10 different dates [i.e., 27, 67, 75, 81, 88, 95, 101, 108, 115, and 122 days after planting (DAP)] in 2018, soil VWC was measured in triplicate inside the base collars and at a distance of 10 cm from the collar in both the up- and down-slope directions from the base collars using a Theta Probe (SM 150, Delta-T Devices Ltd, Cambridge, UK). On five of the sample dates (i.e., 27, 101, 108, 115, and 122 DAP), measurements were made early in the morning around 0900 hours, while on the other five sample dates (i.e., 67, 75, 81, 88, and 95 DAP), measurements were made in the mid-afternoon around 1600 hours. In 2019, soil VWC measurements were recorded on 15 sampling dates (i.e. 21, 28, 35, 42, 49, 56, 63, 70, 77, 84, 91, 98, 105, 112, 118 DAP). All VWC measurements in 2019 were made at 1600 hours. The soil VWC difference (Diff-VWC) between inside the collar and the average of moisture contents outside the collar was calculated (i.e., VWC inside minus VWC outside) for data analyses.
Plant measurements
After the last VWC measurement date each year (i.e., 122 and 131 DAP in 2018 and 2019, respectively), aboveground biomass was collected from inside each collar by cutting all plants to a height of about 2 cm above the soil surface. At approximately 1 m from each collar, in both the up- and down-slope directions from the base collars, the most representative row of rice of the two rows planted on top of the raised beds was selected and a 1-m-long section was also collected. Therefore, for each collar, three aboveground biomass samples were collected: inside the collar, outside up-slope, and outside down-slope. All plant samples were dried at 55 ℃ for 7 days. The plant samples were then weighed to determine aboveground dry matter. After oven drying, the grain was manually separated from the panicles and weighed again to calculate grain yield.
The tillage strips were harvested by combine on 17 September and 9 September 2018 and 2019, respectively. Grain yields determined from manual plant sampling were compared to the whole-tillage-strip average combine yield.
Statistical analyses
Based on a split-split-plot experimental design, a two-factor analysis of variance (ANOVA) was performed using the Glimmix procedure in SAS (version 9.4, SAS Institute, Inc., Cary NC) to evaluate the effect of tillage (CT and NT) and site position (up-, mid-, and down-slope) on initial soil properties and on Diff-VWC, which was conducted separately by measurement date each year, aboveground dry matter, and yield. Least square means were evaluated to determine if Diff-VWC differed from zero. Two-sample T-tests, without equal variance, were performed separately by year for each tillage-site position treatment combination using Minitab (version 13.31, Minitab, Inc., State College, PA) to evaluate aboveground dry matter and yield inside and outside the base collars. In addition, a one-sample T-test, without equal variance, was performed using Minitab to compare the 2018 base-collar yield to the whole-field average combine yield for each tillage-site position treatment combination. Significance was judged at the 0.05 level for all statistical analyses.
Results and Discussion
Initial soil properties
Initial soil properties in the top 10 cm at the beginning of the 2018 rice growing season differed (P < 0.05) among tillage-site position treatment combinations throughout the study area (Table 1). Sand concentration ranged from 0.12 g g-1 in the NT-Down- to 0.16 g g-1 in the CT-Up-, while silt concentration ranged from 0.70 g g-1 in the NT-Up- to 0.74 g g-1 in the CT-Mid-slope combination (Table 1). Clay concentration ranged from 0.13 g g-1 in the CT-Up-, CT-Mid-, and NT-Mid-, which did not differ, to 0.15 g g-1 in the CT-Down-, NT-Up-, and NT-Down-slope combinations, which did not differ (Table 1). Despite being significant, differences in initial sand, silt, and clay concentrations in the top 10 cm among tillage-site position combinations were not large, thus were considered non-agronomically significant for rice production. Bulk density ranged from 1.11 g cm-3 in the CT-Mid- to 1.30 g cm-3 in the NT-Up-combination (Table 1). Soil organic matter ranged from 22.7 Mg ha-1 in the CT-Mid- to 26.1 Mg ha-1 in the NT-Down-slope combination (Table 1).
Chamber effects on soil water contents
In both seasons, the presence of the gas sampling base collars had minimal effect on soil VWC and plant growth. Based on ANOVA conducted separately by sampling date in 2018, the difference in VWC in the top 6 cm inside and outside the gas sampling base collars (Diff-VWC) was unaffected by tillage on each of the 10 weekly sampling dates and nine of 10 weekly sample dates were also unaffected by site position (Table 2). Averaged across tillage, at 81 DAP, the difference in VWC inside and outside the gas sampling base collars was greater (P = 0.04) at the up- and mid-slope positions, which did not differ, where VWC was greater outside than inside the collars, compared to the down-slope position, where VWC was the same inside and outside the base collars. In addition, neither aboveground dry matter nor yield were affected by tillage or site position (P > 0.05; Table 2) and averaged 10.1 and 4.5 Mgha-1, respectively, throughout the entire study area.
In 2018, on six of the 10 weekly sampling dates (i.e., 27, 95, 101, 108, 115, and 122 DAP), soil VWC inside and outside the gas sampling base collars did not differ (P ˃ 0.05) for any of the six tillage-site position treatment combinations (Table 3). However, at 67, 75, and 81 DAP, in the CT-up-slope combination (Table 3), soil VWC was 3.9 to 12.9% greater (P < 0.05) outside than inside the base collars. Similarly, at 81 and 88 DAP, in the NT-mid-slope combination (Table 3), soil VWC was 15.8 to 23.0% greater (P < 0.05) outside than inside the base collar. In addition, at 81 DAP, in the NT-up-slope combination (Table 3), soil VWC was 15.4% greater (P < 0.05) outside than inside the base collars. Deep tracks left by the passage of field equipment around the up- and mid-slope positions of the study area were discovered between 75 and 81 DAP. The tracks most likely affected the down-slope movement of water in the furrows and consequently the soil VWC surrounding the base collars, specifically in the up- and mid-slope positions. Overall, based on 60 total field treatment-sample date combinations, there were only five instances, representing 8.3% of the dataset, where the soil VWC differed between inside and outside the base collars.
In 2019, the difference in soil VWC in the top 6 cm inside and outside the gas sampling base collars (Diff-VWC) was unaffected by tillage on 14 of 15 weekly sampling dates and 10 of 15 weekly sampling dates were also unaffected by site position (Table 2). The interaction between tillage and site position affected the difference in soil VWC on two of 15 weekly sampling dates (Table 2). Averaged across site positions, at 98 DAP, the difference in soil VWC inside and outside the gas sampling base collars was 12.4% greater (P = 0.02; Table 2) under NT than CT, where in both tillage treatments soil VWC was from 4 to 17% greater outside than inside the base collars. Averaged across tillage, at 42 and 56 DAP, the difference in soil VWC inside and outside the gas sampling base collars was from 11 to 57% greater (P = 0.02; Table 2) at the mid- compared to the up- and down-slope positions, while at 98 and 105 DAP, the difference in soil VWC inside and outside the gas sampling base collars was from 8 to 34% greater (P ≤ 0.02; Table 2) at the mid- compared to the up- and down-slope positions. At 91 DAP, the difference in soil VWC inside and outside the gas sampling base collars was 11% greater (P < 0.01; Table 2) at the up- compared to the mid- and down-slope position. Similar to 2018, neither aboveground dry matter nor yield were affected by tillage or site position (P ˃ 0.05; Table 2) and averaged 12.1 and 6.9 Mgha-1, respectively, throughout the entire study area.
In 2019, on six of the 15 weekly sampling dates (i.e., 21, 28, 35, 49, 70, and 112 DAP), soil VWC inside and outside the gas sampling base collars did not differ (P ˃ 0.05) for any of the six tillage-site position treatment combinations (Table 3). However, in the CT-down-slope combination, soil VWC was 2.6% greater (P = 0.02; Table 3) inside than outside the base collars at 56 DAP and 10.5% greater (P < 0.01; Table 3) outside than inside the base collars at 63 DAP. At 98, 105, and 118 DAP in the CT-mid-slope combination, soil VWC was 0.4 to 28% greater (P < 0.03; Table 3) outside than inside the base collars. Similarly, at 42, 98, and 118 DAP in the CT-up-slope combination, soil VWC was 1 to 19% greater (P < 0.03; Table 3) outside than inside the base collars. Again, at 42 DAP in the NT-down-slope combination, soil VWC was 4.8% greater (P = 0.02; Table 3) outside than inside the base collars. Additionally, at 63,77,84, and 98 DAP in the NT-mid-slope combination, soil VWC was 17 to 41% greater (P < 0.04; Table 3) outside than inside the base collars. At 56, 91, and 105 DAP in the NT-up-slope combination, soil VWC was 3.2 to 8.1% greater (P < 0.01; Table 3) outside than inside the base collars. At the down-slope position in both tillage treatments, the discontinuous presence of a permanent flood for the first half of the season, in addition to differences in micro-relief between the CT and NT, most likely caused the differences in soil VWC measured at 42, 56, and 63 DAP. The greater clay and SOM at the NT-Down-slope combination (Table 1) likely resulted in a greater water-holding capacity each year, limiting significant soil moisture variation in the top 6 cm between inside and outside the base collars, which occurred on only one (42 DAP in 2019) of 25 sample dates throughout both years (Table 3). Overall, based on 90 total field treatment-sample date combinations, there were only 15 instances, representing 16.6% of the dataset, where the soil VWC differed between inside and outside the base collars.
Chamber effects on plant productivity
In 2018, aboveground dry matter inside and outside the base collars did not differ (P ˃ 0.05) in the CT/up- and mid-slope and NT/up- and down-slope treatment combinations (Table 4). However, in the CT/down- and NT/mid-slope combinations, aboveground dry matter was 46 and 10%, respectively, greater (P ≤ 0.03; Table 4) outside than inside the collars. In addition, rice yields inside and outside the base collars did not differ (P ˃ 0.05) in the CT/up-, NT/up-, and NT/mid-slope treatment combinations (Table 4). However, in the CT/mid-, CT/down-, and NT/down-slope combinations, rice yields were 57, 61, and 60%, respectively, greater (P ≤ 0.04) outside than inside the collars. Although the rice yield inside the base collars was lower than outside in three of the six tillage-site position treatment combinations, rice yields inside the base collars did not differ (P ˃ 0.05) from the whole-field, mean combine yield (7.9 Mg ha-1) for four of the six tillage-site position treatment combinations (Table 4). Rice yields inside the base collar from the CT/down- and NT/up-slope treatment combinations were 47 and 55%, respectively, lower than the whole-field, mean combine yield. The lower dry matter and yield inside compared to outside the gas-sampling base collars in two of the six treatment combinations may have resulted from a negative effect of the base collar on tillering capacity.
In contrast to 2018, in 2019, aboveground dry matter and yield did not differ (P ˃ 0.05) between inside and outside the base collars in any of the tillage-site position combinations (Table 4). The greater tillering capacity of 214-Gemini planted in 2019 compared to CL7311 planted in 2018 was likely able to overcome the potential negative effect of the base collar presence that occurred in 2018.
Conclusions
Since rice production has been specifically identified as a substantial agronomic source of GHG emissions, reliable and valid methods of in-field, direct measurement of GHG fluxes and emissions from rice production under traditional (i.e., flood irrigation) and alternative water management schemes (i.e., furrow irrigation), which are gaining popularity due to the perceived benefits of reduced water use and labor costs, are critical for accurate quantification and assessment of the environmental burden and carbon footprint of rice in the United States. The results of this two-year field study clearly demonstrated that, even though soil moisture varied over the course of the 2018 and 2019 rice growing seasons due to natural rainfall and periodic furrow irrigation, the presence of GHG sampling base collars did not have a substantial effect on soil VWC, aboveground dry matter, or rice yield in the furrow-irrigated production system. Consequently, it appears that the standard, closed-chamber method for plot-scale, trace gas emissions research is more than reasonably applicable for continued use in a furrow-irrigated rice production system. Furthermore, this study also contributed to the already present literature on methods of analysis for GHGs in rice production systems in general [8,10,11], strengthening the validity and reliability of the vented, non-steady-state, non-flow-through, closed-chamber method.
Acknowledgements
The authors thank Dustin Pickelmann, Vaishali Kandpal, Joshua Humphreys, Tyler Durre, and Ryder Anderson for their field work and Shelby Lebeau for her laboratory assistance.
References
- https://www3.epa.gov/climatechange/Downloads/ghgemissions/US-GHG-Inventory-2016-Main-Text.pdf
- https://www3.epa.gov/climatechange/Downloads/EPAactivities/EPA_Global_NonCO2_Projections_Dec2012.pdf
- United States Geological Survey (USGS) (2010) Water levels and selected water-quality conditions in the Mississippi river valley alluvial aquifer in Eastern Arkansas, 2008. U.S. Geological Survey.
- Vories ED, Counce PA, Keisling TC (2002) Comparison of flooded and furrow-irrigated rice on clay. Irrig Sci 21: 139-144.
- https://static.ark.org/eeuploads/anrc/Final_groundwater_report_2016-2017.pdf
- He C (2010) Effects of furrow irrigation on the growth, production, and water use efficiency of direct sowing rice. Sci Word J 10: 1483-1497.
- Pittelkow CA, Linquist BA, Lundy ME, et al. (2015) When does no-till yield more? A global analysis. Field Crops Res 183: 156-168.
- Rector C, Brye KR, Humphreys J, et al. (2018) Tillage and coated-urea effects on nitrous oxide emissions from direct-seeded, delayed-flood rice production in Arkansas. J Rice Res Dev 1: 25-37.
- Liu XJ, Mosier AR, Halvorson AD, et al. (2006) The impact of nitrogen placement and tillage on NO, N2O, CH4, and CO2 fluxes from a clay loam soil. Plant Soil 280: 177-188.
- Venterea RT (2010) Simplified method for quantifying theoretical underestimsation of chamber-based trace gas fluxes. J Environ Qual 39: 126-135.
- Smartt AD, Brye KR, Rogers CW, et al. (2015) Chamber size effects on methane emissions from rice production. Open J Soil Sci 5: 227-235.
- https://www.nrcs.usda.gov/Internet/FSE_DOCUMENTS/nrcs142p2_050898.pdf
- Henry CG, Kohler B, Nichols J (2019) Irrigation system. US Patent Number 20190307083A1. Filed.
- Kandpal V (2018) Evaluation of a Solar Powered Variable Flow Tail Water Recovery System for Furrow Irrigation. Masters Thesis. University of Arkansas Biological and Agricultural Engineering. Fayetteville, Arkansas.
- Gee GW, Or D (2002) Particle-size analysis. In: Dane JH, Topp GC, Method of soil analysis. Part 4: Physical methods. (1st edn), Soil Science Society of America, Madison, Wisconsin, 255-293.
Corresponding Author
Diego Della Lunga, Department of Crop, Soil, and Environmental Sciences, 115 Plant Sciences Building, University of Arkansa, Fayetteville, AR 72701, USA.
Copyright
© 2020 Della Lunga, et al. This is an open-access article distributed under the terms of the Creative Commons Attribution License, which permits unrestricted use, distribution, and reproduction in any medium, provided the original author and source are credited.