Methane Production as Affected by Tillage Practice and NBPT Rate from a Silt-Loam Soil in Arkansas
Abstract
Greenhouse gas (GHG) emissions from agricultural settings have come under great scrutiny in the past 20 years and the impact of GHGs in the environment regarding global climate change is alarming. Understanding the conditions and mechanisms that produce GHGs, specifically methane (CH4), are needed to better attenuate the release of CH4 from various agronomic practices in agricultural settings, particularly from rice (Oryza sativa L.) production. The objective of the study was to evaluate the effects of tillage [conventional tillage (CT) and no-tillage (NT)] and urea fertilization, with and without N-(n-butyl) thiophosphoric triamide (NBPT), on CH4 fluxes and emissions from rice grown on a Dewitt silt-loam soil (fine, smectitic, thermic Typic Albaqualfs) in the direct-seeded, delayed-flood rice production system in Arkansas. Gas samples were a collected in 2017 from vented, non-flow through chambers at 20-minute intervals (0, 20, 40, and 60 minutes) every week from flood establishment to four days after end-of-season flood release. Methane fluxes differed (P < 0.01) between tillage treatments over time during the 2017 growing season. Methane fluxes ranged from 453 g CH4-C ha-1 day-1 by 41 days after flood (DAF) establishment to 611.2 g CH4-C ha-1 day-1 by 70 DAF under CT and ranged from 405.2 g CH4-C ha-1 day-1 by 13 DAF to 784.6 g CH4-C ha-1 day-1 by 41 DAF under NT. Averaged across tillage, mean season-long CH4 emissions were 33.4 and 37.2 kg CH4-C ha-1 season-1 from NBPT-coated and non-coated urea, respectively, but were unaffected (P > 0.05) by fertilizer treatment. Greater understanding of the effects of tillage on CH4 and other GHG emissions is essential for ascertaining GHG impacts from rice production and for determining GHG loads to the atmosphere.
Keywords
Methane emissions, Conventional tillage, No-tillage, Greenhouse gas
Introduction
Global climate change will be one of the foremost challenges for humankind over the next 50 years [1]. As air temperatures increase globally and the human population rises, developing new techniques to improve or sustain soil health and water resources will become necessary for continued survival [1]. Developing alternative agronomic techniques will be paramount for increasing agricultural production, as well as reducing climate-change drivers, such as greenhouse gas (GHG) emissions. Rising levels of the main naturally and anthropogenically produced GHGs [i.e., carbon dioxide (CO2), methane (CH4), and nitrous oxide (N2O)] are clear when contrasting a baseline of pre-Industrial Revolution concentrations with recently recorded concentrations, which set record levels unseen for the last 800,000 years [1]. Pre-Industrial Revolution GHG concentrations were 280 mg L-1 for CO2, 0.7 mg L-1 for CH4, and 0.18 to 0.26 mg L-1 for N2O, while 2005-reported GHG concentrations were 379 mg L-1 for CO2, 1.8 mg L-1 for CH4, and 0.32 mg L-1 for N2O [2]. More recently, total US GHG emissions increased by 8.4% from 1990 to 2010 [1].
Agriculture alone is responsible for nearly 50% of global CH4 emissions and for 10 to 12% of total anthropogenic GHG emissions worldwide [3]. Of all widely grown row crops, particularly in the United States (US), rice production specifically has been under scrutiny for its atmospheric-CH4 contributions due to the unique water management system, which entails maintaining a continuous flood for most to all of the rice growing season, as rice is semi-aquatic plant [1]. The flood-irrigation system differs from all other cultivated row crops in the world, as most crops are irrigated or watered when needed. In the flooded-soil environment, anaerobic and reducing conditions develop gradually to facilitate CH4 production by methanogens, if a reducible form of carbon (C) is present [1]. Since C, and soil organic matter (SOM) in general, is concentrated near the soil surface, the main source of CH4 production in the soil column, regardless of landuse, is in the topsoil, where > 99% of the total soil-produced CH4 is typically emitted [4]. Methane diffusion through the water column is slow, consequently passive transport of CH4 through the aerenchyma tissue of the rice plants themselves provides the main mechanism of CH4 release to the atmosphere from rice cultivation [5-8].
As of 2011, estimates of total CH4 emissions from rice production represented 1.1% of the total US CH4 emissions to the atmosphere [1]; however, crop residue burning, and rice cultivation combined make up 3.7% of the total agricultural CH4 releases [1]. In 2015, the total estimated CH4 emissions from rice production in the US were 11.2 MMT (million megatons) of CO2 equivalents [9]. In 2016, 47% of all US rice was grown in Arkansas [10]. Consequently, Arkansas produced an estimated 3.8 MMT CO2 equivalents in 2015 from rice cultivation alone [9]. This large magnitude of GHG production from the soil and its effects on global climate change justify why characterization of GHG emissions, in particular CH4, from common rice production practices, specifically in Arkansas, is crucial [11].
Along with conventional tillage (CT), no-tillage (NT) agriculture is a relatively widely adopted, alternative management practice being used with many upland crops, where the goal is to reduce soil erosion, decrease input costs, and sustain long-term crop productivity [12]. No-tillage also generally increases SOM, which not only enhances essential nutrients in the soil, but may potentially supply an increased amount of C substrate to methanogens, which could have a significant effect on CH4 emissions [13,14]. For rice production in Arkansas, NT methods account for approximately 4% of the total planted area, where CT makes up approximately 60%, while the remaining 36% uses a stale-seedbed approach [10]. One reason for the rather low NT adoption rate is that rice produced under NT has exhibited up to a 7.5% reduction in yield compared to under traditional CT [12], which is a barrier for many producers to overcome when contemplating switching tillage systems to reap the environmental benefits of conservation production practices, such as increased SOM, that can be realized from conversion to NT. It is anticipated that more producers will consider conversion to NT rice production in the future for a variety of reasons, including agronomic, environmental, and economic reasons. Consequently, evaluation of CH4 emissions from rice production under CT and NT practices, which has not been conducted in Arkansas, is not only timely, but is also critical to document potential impacts of tillage practice on CH4 emissions to help guide future agronomic decisions, such as whether to convert to NT or not.
In addition to tillage practice as a major agronomic decision point for rice production, optimal rice production requires careful nitrogen (N) management to maximize yields. Conventional production practices often expose N-fertilized crops to potentially increased N-loss mechanisms, such as volatilization, denitrification, and/or leaching. For rice production, urea is the common fertilizer-N source due to urea's large N concentration (46% N; [15]). Urea has two amine groups, which help reduce N loss through nitrification after application, compared to other potential fertilizer-N sources like ammonium nitrate, which adds readily mobile nitrate directly to the soil that is also prone to denitrification [15]. To further reduce potentially substantial N losses via ammonia volatilization, the urease inhibitor N-(n-butyl) thiophosphoric triamide (NBPT) is commonly used as a coating on urea prills [15]. Although significant loss of N can occur through ammonia volatilization, establishing the flood quickly after N application as NBPT-coated urea slows down the activity of the urease enzyme that resides in the soil [16]. More specifically, NBPT-coated urea is the common urea treatment used in Arkansas to inhibit urease activity after application [15,17]. Examining the relationship between non-coated-urea fertilization and an unfertilized control, Rogers, et al. [18] demonstrated no difference with regards to season-long CH4 emissions from rice grown on a silt-loam soil in east-central Arkansas. Furthermore, Rector, et al. [11] reported no effect of urea coating (i.e., NBPT-coated or non-coated) on season-long N2O emissions from rice grown on a silt-loam soil in east-central Arkansas. Minimizing N volatilization losses and prolonging N release in the soil from NBPT-coated urea compared to non-coated urea have the potential to increase aboveground biomass production. However, it has not been clearly shown whether CH4 emissions increase with greater aboveground biomass [14,18]. Furthermore, the potential effects of NBPT-coated compared to non-coated urea on CH4 emissions have not been examined in Arkansas.
The lack of field studies directly assessing the potential effects of tillage options and NBPT rate on CH4 emissions is a current limitation for evaluating the present and potential future sustainability of rice production in Arkansas and elsewhere in areas of concentrated rice cultivation. Therefore, the objective of this field study was to evaluate the effects of tillage practice (CT and NT) and NBPT rate (NBPT-coated urea and non-coated urea) on CH4 fluxes and season-long emissions from a pure-line cultivar grown under a full-season flood in the direct-seeded, delayed-flood production system on a silt-loam soil in Arkansas. It was hypothesized that CH4 fluxes and emissions would be greater from NT than from CT because of the increased labile organic matter on the soil surface under NT to provide more C substrate for CH4 production compared to CT. Though not previously studied for potential effects on CH4 emissions, it was also hypothesized that NBPT would have little to no effect on CH4 emissions when flooding of the rice field is accomplished within 24 hr of urea application [19].
Materials and Methods
Site description
Research was performed in 2017 at the University of Arkansas Division of Agriculture's Rice Research and Extension Center (RREC) east of Stuttgart in Arkansas County, in east-central AR (34°27'54.5" N, 91°25'8.6" W), closely following procedures outlined in Rogers, et al. [20] on a Dewitt silt-loam (fine, smectitic, thermic Typic Albaqualfs) soil with < 1% slope throughout the research site. The study area had been managed in a rice-soybean (Glycine max L. [Merr.]) rotation, which is a commonly used rotation for rice production in Arkansas, for more than 25 years. Replicate research plots for this study have been managed under long-term NT for at least 10 years [21-24] and an adjacent area that had been under continuous CT for over 75 years. The NT treatment used in this study was border area of larger NT plots that were part of an on-going long-term NT potassium (K) fertilization study [21,22,24].
The regional climate throughout the study area is temperate, with a mean annual air temperature of 16.5℃, which ranges from a mean minimum of 12.7 ℃ in January to a mean maximum of 23.5℃ in July [25]. The mean annual precipitation for the study area is 135 cm [25]. The 2017 growing season (i.e., May through September) had an average daily air temperature of 25.0 ℃, which was similar to the 30-year (i.e., 1981 to 2010) average of 25.1 ℃ for the same months [25]. The precipitation for the entire growing season was 55.0 cm, while the 30-year average is 43.0 cm of rainfall.
Treatments and experimental design
A randomized complete block (RCB) design with a factorial arrangement of each tillage (CT and NT)- NBPT-rate (coated and non-coated urea) treatment combination replicated four times was used to address the objective of this study. Two long-term NT plots (4.6 m wide by 7.6 m long) were used with an 18 cm row spacing. Each large plot had two NBPT rates: with (coated) and without (uncoated). Each plot had four base collars (described below) installed: two for the NBPT-coated and two for the non-coated urea treatment. Conventional tillage plots (1.6 m wide by 4.6 m long) with 18 cm row spacing were established adjacent to the long-term NT plots and had one base collar placed per plot, for a total of four base collars per plot receiving NBPT-coated urea and four base collars per plot receiving non-coated urea. The CT and NT areas, situated adjacent to one another, were separated by a levee, but were each treated with a full-season-flood water management scheme. There was a total of 16 gas-sampling base collars for the tillage-fertilizer-type treatment combinations (i.e., CT/NBPT-coated urea, CT/non-coated urea, NT/NBPT-coated urea, and NT/non-coated). Tillage and fertilizer-type treatments represented a split-plot design, where tillage was the whole-plot and fertilizer type was the split-plot factor, while time (i.e., gas flux measurement date) was a split-split-plot factor for CH4 flux analyses.
Plot management
On 22 March 2016, the year prior to this field study, pre-plant fertilizer, 83.8 kg K ha-1 as muriate of potash, 29.4 kg P ha-1 as triple superphosphate, and 11.2 kg Zn ha-1 as ZnSO4, were applied to all CT plots. On 22 March 2016, the NT plots were pre-plant fertilized with only 83.8 kg K ha-1 as muriate of potash and rice seeds were pre-treated with Zn. The CT plot area was left fallow, while the NT plots were cropped to soybean during the 2016 growing season. On 20 November 2016, the CT plots were disked with one pass, then on 25 April 2017 the CT plots were manipulated with two passes of a land plane to smooth the soil surface to prepare for planting.
The pure-line cultivar 'CL172', which is a long-grain, semi-dwarf cultivar that was created by the University of Arkansas, was planted on 9 May and 11 May 2017 in the NT and CT plots, respectively. A single, pre-emergence mixture of Obey (FMC Corp., Philadelphia, PA), which is a mixture of clomazone (2-[(2-chlorophenyl)methyl]-4,4-dimethyl-3-isoxazolidinone and quinclorac (3,7-dichloro-8-quinolinecarboxylic acid), and Permit Plus [halosulfuron methyl, methyl 3-chloro-5-(4,6-dimethoxypyrimidin-2-ylcarbamoylsulfamoyl)-1 methylpyrazole-4-carboxylate; Gowan Co., Yuma, AZ] herbicide was applied on 9 May 2017 with no additional herbicide application throughout the growing season.
A recommended, single, pre-flood N application (118 kg N ha-1 as either coated or non-coated urea) was broadcast manually to dry soil within each collar in both CT and NT plots on 12 June 2017. The N recommendation was determined according to the N-Soil Test for Rice (N-STaR; [15]) in the NT portion of the study area. The N-STaR fertilizer-N recommendation is based on soil samples to a depth of 46 cm and is further refined based on soil textural class and cultivar selection [15]. On 13 June 2017, the full-season flood was established at the 4- to 5-leaf stage of the rice, after which the flood was maintained at a 6 to 10 cm depth until two weeks prior to harvest when the flood was released.
Gas sampling and analyses
Similar to procedures used by Rogers, et al. [20] and Humphreys, et al. [26], after planting and before flooding, a boardwalk system was constructed throughout the study area to reduce stresses and disturbances to the rice plants and facilitate easier access to the plots during the growing season for gas sample collection. The boardwalk was constructed of 5.1 cm × 30.5 cm × 3.6 m pressure-treated wooden planks laid upon 20 × 40 cm concrete blocks before base-collar installation in the plots. The base collars were then set into place to contain portions of the second and third rice rows in each plot for gas sampling.
For the determination of CH4 fluxes, vented, non-flow-through, non-steady-state chambers [20,26,27] were used for the collection of gas samples. In the construction of cylindrical base collars (30 cm in diameter by 30 cm tall), schedule 40 polyvinyl chloride (PVC) was used and beveled at the bottom to facilitate insertion to a depth of approximately 10 cm. Four, 12.5 mm diameter holes were drilled approximately 12 cm from the beveled end of each base collar to allow for flood water to enter and exit the base collars. The collars were driven into the ground such that the drilled holes were just above or level with the soil surface. The holes were plugged during sampling and after flood release with gray butyl-rubber septa (Voigt Global, part# 73828A-RB, Lawrence, KS) to prevent convection currents inside the chambers that would dilute the ambient headspace air.
To facilitate rice growth during the season, 40 and/or 60 cm long chamber extensions were used to increase the height of the chamber. Extensions were covered in reflective aluminum tape (CS Hyde, Mylar metallized tape, Lake Villa, IL) to reduce temperature variations due to reflecting solar energy inside the chamber during use. Tire inner tube cross sections, approximately 10 cm wide, were taped to the bottom of all the extensions to function as a seal to the base collars and to the other extensions during chamber use.
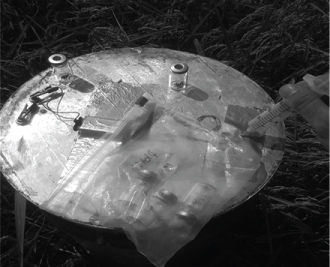
Chamber caps (30 cm diameter PVC by 10 cm tall) with a 5 mm thick sheet of PVC glued to the top were also covered with reflective aluminum tape (Figure 1). Approximately 10 cm wide tire inner tube cross sections were also taped to the bottom of the caps to serve as a seal and attachment mechanism to the base collar or extensions. A 4.5 mm inside diameter (id), 15 cm long piece of copper refrigerator tubing was installed on the side of each cap to maintain atmospheric pressure during sampling. On the top of each chamber cap, a single, 12.5 mm diameter hole was drilled and plugged with gray butyl-rubber septa (Voigt Global, part# 73828A-RB, Lawrence, KS) for syringe and thermometer insertion (Figure 1). To ensure proper air mixing in the enclosed chamber, a 2.5 cm2, battery-operated (9 V), magnetic levitation fan (Sunon Inc., MagLev, Brea, CA) ran throughout the duration of gas sampling for headspace air mixing (Figure 1).
The acquisition of gas samples from the chambers was completed by using a 20 mL, B-D syringe with a detachable 0.5 mm diameter × 25 mm long needle (Beckton Dickson and Co., Franklin Lakes, NJ) that was inserted through the gray butyl-rubber septa installed in the chamber cap (Figure 1). After drawing a gas sample from the chamber into the syringe, the collected sample was immediately injected into a pre-evacuated, 10 mL, crimp-top glass vial (Agilent Technologies, part# 5182-0838, Santa Clara, CA). Gas samples were acquired at 20-minute intervals, beginning at 0 minutes when the chamber was capped and sealed, for 1 hr (i.e., the 0-, 20-, 40-, and 60 min marks). Gas sampling started 1 day after flood establishment in 2017 and continued weekly until flood release when sampling frequency changed to 1, 2, 3, 4 and 5 days after flood release. Similar to prior studies [18,19,26], all gas sampling occurred in the morning between 0800 to 1000 hr CST to minimize temperature fluctuations in the chambers.
Relative humidity, ambient air temperature, 10 cm soil temperature, barometric pressure, and the air temperature inside the chamber were recorded during each chamber sampling event and at every sampling interval (i.e., the 0-, 20-, 40-, and 60 min marks). During gas sampling, the distance from the top of the chamber to the water level, if any water was present, was measured to properly calculate the interior chamber volume. Methane gas standards (i.e., 2, 5, 10, 20, and 50 mg L-1) were collected in the field using a 20 mL syringe with a detachable needle that was immediately injected into pre-evacuated, 10 mL, crimp-top glass vials. Methane gas standards from the same five concentration standards were also collected in the laboratory immediately prior to gas sample analysis to evaluate potential leakage from sample transport from the field.
Utilizing a flame ionization detector (250 ℃), a Shimadzu GC-2014 gas chromatograph (Shimadzu North America/Shimadzu Scientific Instruments Inc., Columbia, MD) was used to analyze gas samples for their CH4 concentration within 48 hr of collection in the field. According to procedures described by Rogers, et al. [18], CH4 fluxes were calculated using changes in concentrations in the chamber headspace over the 60 min sampling interval. To assess the change in concentration over time, measured concentrations (mL L-1; y axis) were regressed against time (in minutes; X-axis) of sample extraction (i.e., 0, 20, 40, and 60 minutes). The slope of the resulting best-fit line was then multiplied by the calculated chamber volume (L) and divided by the inner surface area of the chamber (m2) resulting in flux units of μL CH4 m-2 min-1 [28]. The units of the μL CH4 were then converted using the Ideal Gas Law (PV = nRT) to μmol CH4, where P was the measured pressure over the 60 min sampling interval in atmospheres (atm), V was the calculated volume of the interior of the chamber (L), n was the number of moles of the gas, R was the gas constant (0.8206 L atm mol-1 K-1), and T was the average measured temperature inside the chamber in Kelvin over the 60 min interval. To convert μmol CH4 to the mass of CH4, the molar mass of CH4 was then used for a final flux unit of mg CH4 m-2 d-1 [28].
On a chamber-by-chamber basis, season-long emissions were calculated by linear interpolation between sample dates. Emissions data were also divided into pre- and post-flood-release periods for data analyses due to differences in emissions mechanisms.
Statistical analyses
A three-factor analysis of variance (ANOVA) was performed using SAS 9.4 (SAS Institute, Inc., Cary, NC) to evaluate the effects of tillage, NBPT rate, time, and their interactions on CH4 fluxes. A two-factor ANOVA was performed to evaluate the effects of tillage practice, NBPT rate, and their interaction on pre- and post-flood-release CH4 emissions and area- and yield-scaled, season-long CH4 emissions. When appropriate, means were separated by least significant difference (LSD) at the α = 0.05 level.
Results and Discussion
Initial soil physical and chemical properties
Early season soil properties were evaluated and reported by Rector, et al. [11] in a similar study conducted in the same field plots as the study current was conducted to determine potential differences among plots associated with the tillage (NT and CT) and pre-assigned fertilizer treatments. Sand, silt, and clay contents, 0.14, 0.71, and 0.15 g g-1, respectively, in the top 10 cm did not differ by tillage or fertilizer treatment [11], thus confirming a silt-loam soil surface texture throughout the study area. In addition, soil EC, extractable soil Ca, S, and Cu and TN, TC, and SOM content, and C:N ratio in the top 10 cm also did not differ by tillage or fertilizer treatment and averaged 0.20 dS m-1, 1.32 Mg ha-1, 14.8 and 1.51 kg ha-1, 879 kg ha-1, 8.86 and 23.3 Mg ha-1, and 10.1, respectively, throughout the study area [11]. However, several minor differences existed among tillage and pre-assigned fertilizer treatments.
Soil bulk density did not differ between pre-assigned fertilizer treatments under CT, which averaged 1.38 g cm-3, but was 19 and 11% greater than that in the NT/non-coated-urea (1.15 g cm-3) and NT/NBPT-coated-urea (1.23 g cm-3) treatment combinations, which also differed between one another [11]. Similar to soil bulk density, pre-flood extractable soil K content did not differ between pre-assigned fertilizer treatments under CT, but was greater in the NT/NBPT-coated urea (156 kg ha-1) than in the NT/non-coated urea (135 kg ha-1) treatment combination [11]. However, all treatment combinations had extractable soil K concentrations within the "Medium" (i.e., 91 to 130 mg K kg-1) soil-test category for fertilizer recommendations for rice grown in Arkansas, with any additional K fertilizer having little to no expected effect on rice growth or productivity [15].
Soil pH under both CT and NT fell within the optimal ~ 5.0 to 6.75 pH range for rice production [17,29], but, averaged across pre-assigned fertilizer treatments, pre-flood soil pH was 13% greater in the top 10 cm under CT (pH = 6.1) than under NT (pH = 5.4; [11]). Averaged across pre-assigned fertilizer treatments, pre-flood extractable soil P, Mg, Na, and Mn contents were also 12, 60, 45, and 24%, respectively, greater under CT than under NT, while extractable soil Fe and Zn contents were 1.2 and 2.1 times, respectively, greater under NT than under CT [11]. However, soil P concentrations in both tillage treatments were in the "Low" (i.e., 16-25 mg kg-1) soil-test category [11], which would have suggested additional P fertilizer be applied, but additional P was not applied due to maintaining research continuity with the long-term NT study, which could have potentially impacted plant health and productivity [15]. Mean extractable soil Zn concentrations were 5.1 and 2.1 mg kg-1 for NT and CT, respectively, where the soil-test Zn category was "Low" for CT and "Optimum" for NT [11]. However, according to Norman, et al. [15], neither Zn level required additional Zn fertilizer for rice grown on a silt-loam soil in Arkansas.
Considering only a few pre-flood differences in soil properties existed among treatments early in the rice growing season, with the exception of extractable soil P, the differences were relatively minor and were generally expected to have little agronomic impact on rice growth and productivity. Consequently, it was reasonably assumed that any subsequently measured differences in CH4 fluxes and/or emissions among treatments were actually due to imposition of those treatments rather than to large and numerous inherent differences among plots representing the imposed treatments.
Methane fluxes
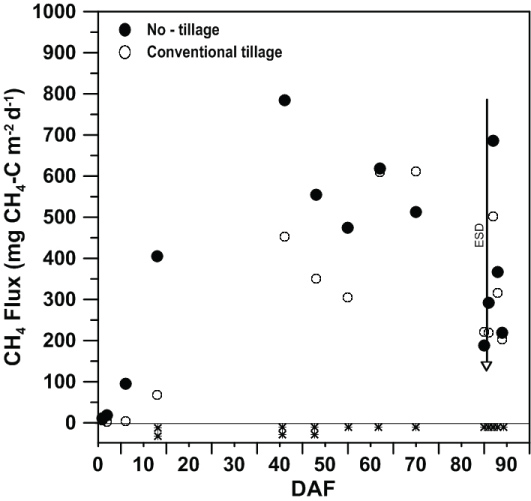
Over the 2017 rice growing season, as expected, CH4 fluxes followed a similar pattern as reported in previous studies [18,30,31], with fluxes starting low, increasing to a mid-season peak, then decreasing towards the end-of-season drain, with a small flux increase after flood release before declining within one week after flood release. Methane fluxes differed between tillage treatments over time (P < 0.01), but were unaffected (P > 0.05) by NBPT rate (Table 1 and Figure 2). At 1, 2, and 6 DAF, CH4 fluxes from both tillage treatments did not differ from a flux of zero. By 13 DAF, CH4 fluxes from CT still did not differ from a flux of zero, while CH4 fluxes from NT were both greater than zero and greater than that from CT (405 mg CH4-C m-2 d-1). Between 13 and 41 DAF, analytical equipment error prevented analysis of collected gas samples, therefore no data could be presented. By 41 DAF, CH4 fluxes from CT (452 mg CH4-C m-2 d-1) were lower than the seasonal peak from NT (784 mg CH4-C m-2 d-1), but did not differ from CT fluxes measured 48 DAF. Between 41 and 55 DAF, CH4 fluxes at least numerically decreased over time, where CH4 fluxes remained greater from NT than from CT at both 48 and 55 DAF. Between 55 and 89 DAF, which represented the end of gas sampling in the field, CH4 fluxes did not differ between tillage treatments on any measurement date (Figure 2). However, CH4 fluxes from CT numerically peaked at 70 DAF (611.2 mg CH4-C m-2 d-1) then decreased until a post-flood-release spike occurred at 87 DAF (501.6 mg CH4-C m-2 d-1). After peaking at 41 DAF, CH4 fluxes from NT generally decreased until a post-flood-release spike also occurred at 87 DAF (686.1 mg CH4-C m-2 d-1). The general pattern of a post-flood-release spike in CH4 flux has been observed previously from silt-loam soils [18,26,30]. The post-flood-release spike in CH4 flux is thought to be caused by the degassing of entrapped CH4 in the soil profile [32] after the water column has been released from the field to prepare for harvest. Despite measured CH4 fluxes still being greater than a flux of zero, gas sampling in the field ceased at 89 DAF because of the need to harvest the rice crop.
Above ground dry matter and yield
Rector, et al. [11] measured and reported aboveground dry matter and yield from the same field plots as the current study used. Aboveground dry matter did not differ between NBPT rates, but differed between tillage practices [11]. Aboveground dry matter was 17.8 and 18.1 Mg ha-1 from NBPT-coated and non-coated urea, respectively, and averaged 18.0 Mg ha-1, while aboveground dry matter was 15% lower from NT (16.5 Mg ha-1) than from CT (19.4 Mg ha-1; [11]).
Similar to aboveground dry matter, rice yields produced by CL172 were unaffected by NBPT rate, but differed between tillage treatments [11]. Rice yields were 8.3 and 8.5 Mg ha-1 from NBPT-coated and non-coated urea, respectively, and averaged 8.4 Mg ha-1 [11]. These results indicate that greater N-volatilization loss from the non-coated compared to the NBPT-coated urea likely did not occur, which supports the original hypothesis that NBPT would have little effect on CH4 emissions. From the same Dewitt silt-loam soil and N-fertilization treatments as used in the current study, Rector, et al. [11] also reported that season-long N2O emissions did not differ between NBPT-coated and non-coated urea. Consequently, the lack of a NBPT-rate effect on dry matter production, yield, and season-long CH4 and N2O suggest that substantial rice-plant morphological differences, specifically with aerenchyma tissue, do not arise from using either NBPT-coated or non-coated urea to potentially differentially facilitate GHG emissions.
Rice yields were 12% lower from NT (7.8 Mg ha-1) than from CT (8.9 Mg ha-1; [11]). Though both tillage treatments had mean soil-test P levels in the low category before planting, the slightly, though significantly, greater P content under CT compared to under NT [11] may have contributed to the yield difference between the two tillage treatments. Rice yields measured in this study from CT practices were also slightly lower than expected yields for CL172 (9.2 Mg grain ha-1) grown in Arkansas based on a summary of recent yield trials [33]. Site-specific yields measured in this study could have been impacted by the fungal disease false smut (Ustilaginoidea virens), which was visually observed to a small degree in 2017 associated with rice grown in both tillage treatments. In contrast to the results of this study, through a global meta-analysis, Pittelkow, et al. [12] reported that NT had no significant effect on rice yield compared to CT. Both NT and CT plots received the same quantity of fertilizer N, but NT was not fertilized with P, whereas CT plots were fertilized with P due to the nature of the P-fertilization treatments the NT plots were a part of that were used in this study.
Soil redox and temperature
In addition to aboveground dry matter and yield, Rector, et al. [11] also measured and reported soil redox and temperature trends over the growing season from the same field plots as the current study used. Methane production is optimal in the soil redox potentials (Eh) range of approximately -200 to -250 mV [34]. Based on measured values from the hour during CH4 flux measurements, soil Eh at the 7 cm depth started near 200 mV, but decreased to near 0 mV by 6 DAF under NT and by 24 DAF under CT [11]. Once reached, soil Eh remained near or below -200 mV for the remainder of the season [11].
Soil Eh was greater under CT than NT at 2 and 6 DAF, but was similar between tillage treatments during all other measurement's weeks [11]. Averaged across measurement dates, mean soil Eh was greater in the NT/non-coated-urea (-55.6 mV) than in the other three treatment combinations, which did not differ and averaged -241 mV [11]. An explanation for the apparent inconsistent differences in soil Eh is not immediately obvious, but may relate to the degree of rhizosphere oxygenation, which would tend to maintain greater soil Eh when well-oxygenated and a lower soil Eh when poorly oxygenated.
Soil temperatures at the 7 cm depth started around 26 ℃, increased to around 28 ℃ mid-season by 41 DAF, then decreased to below 20 ℃ and continued to decrease after the end-season-drain (86 to 88 DAF; [11]). The numerically largest soil temperature was achieved in CT at 41 DAF, with the numerically lowest soil temperature occurring in NT at 87 DAF [11].
Averaged over NBPT rates, the soil temperature was significantly cooler under NT than CT during the middle of the flooded portion of the rice growing season (i.e., 34, 41, 48, 55, 62, and 70 DAF), but did not differ by more than 2 ℃ on any given date [11]. The cooling effect under NT management likely occurred because of unincorporated residue left by the NT treatment on the soil surface, which attenuated soil profile heating during the middle of the sampling season more than under CT. Averaged over measurement dates, mean soil temperatures were lower and did not differ between NBPT rates, averaging 23.5 ℃, under NT compared to under CT, where soil mean temperatures were slightly warmer and differed between NBPT rates (24.5 and 23.8 ℃ for NBPT-coated and non-coated urea, respectively) under CT [11]. The slight soil warming was likely due to the lack of crop residue and greater subsequent heating of the soil profile by radiative solar energy under CT than under NT. Brye, et al. [35] reported that diurnal fluctuations of air temperature significantly influenced CH4 emissions from silt-loam soils in Arkansas. However, the presence of the flood water likely attenuates and minimizes the diurnal fluctuations of air temperature.
Methane emissions
In contrast to that hypothesized, pre- and post-flood-release and season-long, area- and yield-scaled CH4 emissions were unaffected (P > 0.05) by tillage treatment and NBPT rate (Table 1). Though not significant, pre-flood-release CH4 emissions ranged from 19.1 to 37.2 kg CH4-C ha-1 period-1 and averaged 27.8 kg CH4-C ha-1 period-1 from CT and ranged from 27.2 to 51.4 kg CH4-C ha-1 period-1 and averaged 40.6 kg CH4-C ha-1 period-1 from NT (Table 2). Similarly, though not significant, pre-flood-release CH4 emissions ranged from 27.2 to 51.3 kg CH4-C ha-1 period-1 and averaged 36.4 kg CH4-C ha-1 period-1 from non-coated urea and ranged from 19.1 to 51.4 kg CH4-C ha-1 period-1 and averaged 32.0 kg CH4-C ha-1 period-1 from NBPT-coated urea (Table 2). Post-flood-release CH4 emissions were numerically smaller than those before the flood was released (Table 2) and represented only 4.3 and 3.7% of the measured season-long CH4 emissions from CT and NT, respectively. The relatively small proportion of post-flood-release CH4 emissions was similar to what has been reported in recent studies (3.4 to 13.2%), but from different pure-line cultivars (i.e., 'Taggart' and 'Wells') grown on silt-loam soils under CT and a full-season flood in east-central Arkansas [18,30].
Though not significant, season-long, area-scaled CH4 emissions ranged from 20.3 to 39.2 kg CH4-C ha-1 season-1 and averaged 29.0 kg CH4-C ha-1 season-1 from CT, whereas season-long, area-scaled CH4 emissions ranged from 28.3 to 53.8 kg CH4-C ha-1 season-1 and averaged 42.2 kg CH4-C ha-1 season-1 from NT (Table 2). Though SOM and TC contents in the top 10 cm did not differ between tillage treatments early in the growing season [11], it was likely that both SOM and C were concentrated more towards the soil surface (i.e., upper most few millimeters), due to the lack of incorporation, which limited the availability of reducible substrate to methanogens, hence limited the production and release of CH4 from under NT management. Mitra, et al. [4] suggested that the main source of CH4 in the soil column is in the topsoil, where > 99% of the total soil-produced CH4 is emitted regardless of the landuse being agriculturally disturbed or natural and relatively undisturbed. Furthermore, since the aerenchyma tissue of the rice plants themselves provides the main mechanism of CH4 release to the atmosphere via passive transport from below a column of water [5-8] and the SOM/C substrate was likely stratified and concentrated right at the soil surface, there was likely little to no opportunity for produced CH4 molecules to enter the aerenchyma tissue of the rice plant and therefore no mechanism for release to the atmosphere, except for ebullition which is slower than the passive aerenchyma transport [32,36]. Though not measured directly in this study, it was also possible that the soil redox status right at the soil surface was not reduced enough for substantial CH4 production, despite the presence of ample SOM/C substrate. Rector, et al. [11] also reported no difference in N2O emissions between CT and NT practices.
Similar to the lack of a tillage effect, though not significant, season-long, area-scaled CH4 emissions ranged from 24.8 to 53.3 kg CH4-C ha-1 season-1 and averaged 37.8 kg CH4-C ha-1 season-1 from non-coated urea, whereas season-long, area-scaled CH4 emissions ranged from 20.3 to 53.8 kg CH4-C ha-1 season-1 and averaged 33.4 kg CH4-C ha-1 season-1 from NBPT-coated urea (Table 2). These results support the hypothesis that NBPT would have little to no effect of CH4 emissions. Thus, it appears that the same amount of aerenchyma tissue was produced between the two NBPT-rate treatments that facilitated the same magnitude of season-long CH4 emissions. Regardless of NBPT rate, the magnitude of season-long CH4 emissions from optimally N-fertilized rice measured in this study were lower than that reported from recent studies conducted on silt-loam soils in east-central Arkansas [18,26].
Similar to area-scaled emissions, season-long, yield-scaled CH4 emissions, which represented an emissions intensity metric, ranged from 4.1 to 4.4 kg CH4-C (Mg grain)-1 and averaged 4.25 kg CH4-C (Mg grain)-1 across NBPT rates, whereas season-long, yield-scaled CH4 emissions ranged from 3.2 to 5.4 kg CH4-C (Mg grain)-1 and averaged 4.3 kg CH4-C ha-1 season-1 across tillage treatments (Table 2). The emissions intensities measured in this study were similar to and within the range [2.52 to 7.39 kg CH4-C (Mg grain)-1] reported by Humphreys, et al. [26] for rice grown in 2015 in a Dewitt a silt loam in Arkansas.
Agronomic and environmental implications
Reducing the GHG load to the atmosphere will be necessary to mitigate global climate change and its potentially disastrous long-term effects on the environment [1]. However, before the GHG load can be reduced, it will be necessary to increase understanding of the agronomic practices that affect GHG emissions, which necessitates careful characterization of rice production practices that affect CH4 emissions. Though measurements were made over the course of only one growing season, results of this field study, the first of which conducted in Arkansas, the leading rice-producing state in the United States, to evaluate the effects of tillage practice and NBPT rate, showed that season-long CH4 emissions did not differ between CT and NT or between NBPT-coated and non-coated urea.
Rice producers considering the adoption of alternative practices for increased sustainability may not achieve substantial benefits from NT, in terms of reduced CH4 emissions, as might be expected for other soil properties and processes. However, implementing NT compared to continuing with CT, coupled with similar, rather than greater, CH4 emissions from NT compared to CT, may provide an impetus for changing tillage practices.
Though designed to inhibit urea breakdown, fertilizing rice with NBPT-coated urea is also more costly than using non-coated urea. However, results of this study showed that non-coated urea could potentially be used in place of NBPT-coated urea without increasing CH4 emissions, which was also shown recently to be the case for N2O emissions [11]. In addition, season-long N2O emissions were also low from a full-season flood treatment, which minimized the fluctuations in soil Eh that would have promoted N2O production and release [11].
Since numerous other factors have been shown to significantly influence CH4 emissions from rice production, such as cultivar selection [20,26], soil texture [30,31], and water management scheme [26], results of this study suggest that climate-change modelers may not need to account for tillage practice when attempting to estimate large-scale, regional CH4 emissions from rice produced from a silt-loam soil in a direct-seeded, delayed flood production system. However, though not directly measured in this study, if flooding times greater than 24 hr are required following urea-N application, then NBPT rate may be important. Consequently, the results of this study have provided evidence to narrow the pool of significant soil and agronomic factors needed to consider for model estimation purposes. Studies like the present study will continue to be necessary to conduct under field conditions to further refine current knowledge regarding factors affecting CH4 emissions in regions of concentrated rice production, such as is eastern Arkansas.
Conclusions
This field study was the first to examine the effects of tillage (CT and NT), NBPT rate, and their interaction on CH4 fluxes and emissions from a pure-line rice cultivar grown in a silt-loam soil in the direct-seeded, delayed-flood production system in east-central Arkansas. Similar to that hypothesized, CH4 fluxes were greater from NT than CT at times over the 2017 rice growing season and were unaffected by NBPT rate. Methane emissions were unaffected both tillage treatment and NBPT rate since flooding occurred within the recommended 24 hr using fertilizing with urea. Results of this study will be valuable information when contemplating new policies and recommendations for future rice production practices and sustainability in the mid-southern United States, particularly eastern Arkansas.
Though the results of this study were based on one growing-season of measurements, these results indicate consistent CH4 flux trend and emissions responses from year to year at least partially due to the presence of the flood water for most of the growing season attenuating inter-annual differences in growing-season weather conditions. The importance of rice production to the state of Arkansas, and the other few areas of concentrated rice production in the United States, makes continued quantification of GHG emissions, specifically CH4, from traditionally common and alternative rice production practices vital to mitigating global climate change. With rice being a staple food for a substantial portion of the current human population, continued research into the effects of rice production practices on CH4 emission is warranted as the global population continues to rise, which will require increased, yet sustainable, production, while simultaneously protecting the environment.
Acknowledgments
Planning and field assistance provided by Donna Frizzell, Eddie Castaneda-Gonzalez, and Jarrod Hardke are greatly appreciated.
References
- Intergovernmental Panel on Climate Change (IPCC) (2014) Climate Change 2014: Synthesis Report. Contribution of Working Groups I, II and III to the Fifth Assessment Report of the Intergovernmental Panel on Climate Change. In: Core Writing Team, RK Pachauri, LA Meyer, IPCC, Geneva, Switzerland.
- Forster P, V Ramaswamy, P Artaxo, et al. (2007) Changes in atmospheric constituents and in radiative forcing. In: Solomon S, D Qin, M Manning, et al. Climate Change 2007: The Physical Science Basis. Contribution of Working Group I to the Fourth Assessment Report of the Intergovernmental Panel on Climate Change. Cambridge University Press, Cambridge, United Kingdom and New York, NY, USA.
- Smith P, D Martino, Z Cai, et al. (2007) Agriculture. In: B Metz, OR Davidson, PR Bosch, R Dave, et al. Climate Change 2007: Mitigation. Contribution of Working Group III to the Fourth Assessment Report of the Intergovernmental Panel on Climate Change. Cambridge University Press, Cambridge, United Kingdom and New York, NY, USA.
- Mitra S, R Wassman, M Jain, et al. (2002) Properties of rice soils affecting methane production protentials: 2. Differences in topsoil and subsoil. Nutr Cycl Agro 64: 183-191.
- Cicerone RJ, JD Shetter (1981) Sources of atmospheric methane: measurements in rice paddies and a discussion. J Geophys Res 86: 7203-7209.
- Yu KW, ZP Wang, G Chen (1997) Nitrous oxide and methane transport though rice plants. Biol Fert Soils 24: 341-343.
- Dannenburg S, R Conrad (1999) Effect of rice plants on methane production and rhizospheric metabolism in paddy soil. Biogeochem 45: 53-71.
- Groot TT, PM van Bodegom, HAJ Meijer, et al. (2005) Gas transport through the root-shoot transition zone of rice tillers. Plant Soil 277: 107-116.
- https://19january2017snapshot.epa.gov/ghgemissions_.html.
- Hardke JT (2017) Trends in Arkansas rice production. In: RJ Norman, KAK Moldenhauer, BR Wells Arkansas Rice Research Studies, 2016. University of Arkansas System, Fayetteville, AR, USA, 11-14.
- Rector C, KR Brye, J Humphreys, et al. (2018) Tillage and coated-urea effects on nitrous oxide emissions from direct-seeded, delayed-flood rice production in Arkansas. J Rice Res Dev 1: 25-37.
- Pittelkow CM, BA Linquist, ME Lundy, et al. (2015) When does no-tillage yield more? A global meta-analysis. Field Crops Res 183: 156-168.
- Liu XJ, AR Mosier, AD Halvorson, et al. (2006) The impact of nitrogen placement and tillage on NO, N2O, CH4, and CO2 fluxes from a clay loam soil. Plant Soil 280: 177-188.
- Ahmad S, C Li, G Dai, et al. (2009) Greenhouse gas emission from direct seeding paddy field under different rice tillage systems in central China. Soil Till Res 106: 54-61.
- Norman RJ, NA Slaton, TL Roberts (2013) Soil Fertility. In: JT Harke, Arkansas Rice Production Handbook Misc Publ 192. University of Arkansas, Division of Agriculture Cooperative Extension Service, Little Rock, AR, USA, 69-102.
- Cantarella H, R Otto, J Rodrigues Soares, et al. (2018) Agronomic efficiency of NBPT as a urease inhibitor: A review. J Adv Res 13: 19-27.
- Norman RJ, CE Wilson, NA Slaton (2003) Soil fertilization and mineral nutrition in U.S. mechanized rice culture. In: C Smith, R Dilday, Rice: Origin, history, technology, and production. John Wiley & Sons, Inc., Hoboken, NJ, USA.
- Rogers CW, KR Brye, RJ Norman, et al. (2013) Methane emissions from drill-seeded, delayed-flood rice production on a silt-loam soil in Arkansas. J Environ Qual 42: 1059-1069.
- Norman RJ, CE Wilson, NA Slaton, et al. (2009) Nitrogen fertilizer sources and timing before flooding dry-seeded, delayed-flood rice. Soil Sci Soc Am J 73: 2184-2190.
- Rogers CW, KR Brye, AD Smartt, et al. (2014) Cultivar and previous crop effects on methane emissions from drill-seeded, delayed-flood rice production on a silt-loam soil. Soil Sci 179: 28-36.
- Slaton NA, TL Roberts, RJ Norman, et al. (2013) Rice and soybean response to short- and long-term phosphorus and potassium fertilization rate. In: RJ Norman, and KAK Moldenhauer, B.R. Wells Arkansas Rice Research Studies, 2012. University of Arkansas Division of Agriculture Cooperative Extension Service, Fayetteville, AR, USA, 332-338.
- Slaton NA, JT Hardke, TL Roberts (2017) Evaluation of Mehlich-3 extraction of field-moist and oven-dried soil from long-term fertilization trials. In: NA Slaton, Wayne E. Sabbe Arkansas Soil Fertility Studies, 2016. Res Series 642: 29-33.
- Slaton NA, RJ Norman, J Hardke, et al. (2018) Summary of crop yield and soil-test phosphorus and potassium responses to long-term fertilization rate. In: RJ Norman, KAK Moldenhauer, B.R. Wells Arkansas Rice Research Studies, 2017. University of Arkansas System, Fayetteville, AR, USA, 341-348.
- Parvej M, NA Slaton, L Purcell, et al. (2016) Critical trifoliate leaf and petiole potassium concentrations during the reproductive stages of soybeans. Agron J 108: 2502-2518.
- National Oceanic & Atmospheric Administration (NOAA) (2015) National Environmental Satellite, Data, and Information Service. Annual Climatological Summary (2015). National Centers for Environmental Information, US Department of Commerce, Asheville, NC.
- Humphreys J, KR Brye, C Rector, et al. (2018) Water management and cultivar effects on methane emissions from direct-seeded, delayed-flood rice production in Arkansas. J Rice Res Dev 1: 14-24.
- Livingston G, G Hutchinson (1995) Enclosure-based measurement of trace gas exchange: Applications and sources of error. In: PA Matso, RC Harriss, Biogenic trace gases measuring emissions from soil and water. Blackwell Science, Oxford [England]; Cambridge, MA, USA, 14-51.
- Parkin TB, RT Venterea (2010) Sampling protocols. In: RF Follet, USDA-ARS GRACEnet Project Protocols, editor Chapter 3. Chamber-Based Trace Gas Flux Measurements, 3-39.
- Havlin JL, SL Tisdale, WL Nelson, JD Beaton (2014) Soil Fertility and Fertilizers: An introduction to nutrient management. (8th edn), Pearson Education Inc, Upper Saddle River, NJ, USA, 516.
- Brye KR, CW Rogers, AD Smartt, et al. (2013) Soil texture effects on methane emissions from direct-seeded, delayed-flood rice production in Arkansas. Soil Sci 178: 519-529.
- Smartt AD, KR Brye, CW Rogers, et al. (2016) Characterization of methane emissions from rice production on a clay soil in Arkansas. Soil Sci 181: 57-67.
- Smith KA, T Ball, F Conen, et al. (2003) Exchange of greenhouse gases between soil and atmosphere: interactions of soil physical factors and biological processes. Eur J Soil Sci 54: 779-791.
- Hardke JT (2014) Introduction. In: JT Hardke, Arkansas Rice Production Handbook. University of Arkansas Division of Agriculture, Cooperative Extension Service, Little Rock, AR, USA, 1.
- Patrick WH, RP Gambrell, SP Faulkner (1996) Redox measurements of soils. In: DL Sparks, Methods of Soil Analysis. Part 3 - Chemical Methods. (3rd edn), SSSA, Madison, WI, USA, 1255-1273.
- Brye KR, LL Nalley, JB Tack, et al. (2016) Factors affecting methane emissions from rice production in the Lower Mississippi river valley, USA. Geod Reg 7: 223-229.
- Butterbach-Bahl K, H Papen, H Rennenberg (1997) Impact of gas transport through rice cultivars on methane emission from rice paddy fields. Plant Cell Environ 997: 1175-1183.
Corresponding Author
Dr. Kristofor R Brye, Department of Crop, Soil, and Environmental Sciences, 115 Plant Sciences Building, University of Arkansas, Fayetteville, AR 72701, USA.
Copyright
© 2018 Humphreys J, et al. This is an open-access article distributed under the terms of the Creative Commons Attribution License, which permits unrestricted use, distribution, and reproduction in any medium, provided the original author and source are credited.