Diurnal Variation of Trace Gas Fluxes during the Vegetative Lag Phase in Furrow-Irrigated Rice Production
Abstract
Studies on diurnal variations of greenhouse gas (GHG) fluxes in rice (Oryza sativa L.) production systems have been limited to flooded, or variations of flooded, soil conditions. This study aimed to quantify hourly CO2, CH4, and N2O fluxes over a period of 20 hours and the effects of site position (up-, mid-, and down-slope) and tillage practice [conventional tillage (CT) and no-tillage (NT)] during the vegetative lag phase in a furrow-irrigated rice field on a silt-loam soil in eastern Arkansas. In July 2018 and 2019, using the closed-chamber method, gas sample collection occurred at 1600, 2000, and 2400 hours on the first day and at 0400, 0800, and 1200 hours the second day, for a total of six gas collections at 4-h intervals over a 20-h time period. Hourly CO2-fluxes differed (P < 0.005) among year-position-sample time treatment combination, while hourly CH4 and N2O fluxes differed (P < 0.001) among year-tillage-position-sample time combinations. Temporal analyses showed peak maxima occurred in the late afternoon and minima occurred in the early morning for all the GHGs. Global warming potential was highly variable among chambers, differed (P < 0.001) among year-site position combinations, and was numerically greatest at the down-slope position in 2019. Environmental factors and agricultural practices showed to have temporal and significant effects on the production and release of the GHGs. Results from the current study can provide useful tools to address mitigation practices that aim to reduce the environmental impact in rice fields, while attempting to maintain optimal production.
Keywords
Diurnal fluxes, Tillage, Global warming potential, Furrow-irrigated rice
Introduction
Analysis of greenhouse gas (GHG) budgets, particularly carbon dioxide (CO2), methane (CH4), and nitrous oxide (N2O), provides important information on where over- or under-estimations are more prominent and how to improve current methods to enhance the reliability of GHG budget estimations [1-5]. Total CO2 emissions in 2019 amounted to 11.5 Gt of C per year, which were partitioned between fossil-fuel burning (81%) and land-use changes (19%) [1].
The estimated global CH4 emissions between 2000 and 2012 were 550 CH4 Tg yr-1, which represented only 4% of global anthropogenic GHG emissions, but contributed more than 20% to the additional radiative forcing in the troposphere since the preindustrial era [6]. Agricultural activities, specifically livestock and rice (Oryza sativa L.) cultivation, fossil fuel usage, and waste sectors, such as landfill sites, constitute the main human activities responsible for the increase in CH4 concentrations in the lower atmosphere [6].
Nitrous oxide represents the third most relevant contributor to radiative forcing in the atmosphere [3]. With 17 Tg yr-1 globally, N2O represents slightly more than 6% of global GHG emissions but constitutes more than 17% of the total radiative forcing [7]. Recent emissions from the agricultural sector alone have been estimated around 5.8 Tg yr-1 [8], although intergovernmental panel on climate change (IPCC) analyses reported slightly lower emissions (i.e., 5.3 Tg N2O yr-1) [7].
Greenhouse gas fluxes are not spatially or temporally constant and are affected by many factors. Consequently, many biases and uncertainties in global GHG budgets have been evaluated at the local level, specifically in sampling protocols and temporal variations of GHG fluxes [9]. Emissions of CO2 from terrestrial ecosystems have been evaluated in different biomes, although agricultural fields, specifically rice production systems, are still lacking complete and accurate datasets to improve the reliability of emissions estimations and interpolations [10]. At the regional level, micrometeorological and chamber-based, direct field measurement methods are considered more suitable than top-down models to estimate total emissions (i.e., CO2, CH4, and N2O) from cropping systems [9]. However, spatial and temporal variability issues related to the chamber-based technique commonly lead to an overestimation of season-long emissions [9]. Often times, GHG flux measurements over a 1-h time period have been used to interpolate between weekly samplings to estimate season-long emissions [11-14], making the choice of location in a field, time of day, and measurement duration important to capture GHG fluxes representing daily averages rather than minima or maxima.
Studies on diurnal variations of GHG fluxes in rice production systems have been limited to flooded, or variations of flooded, soil conditions [12], particularly in Arkansas, which is consistently the leading rice-producing state in the US [15]. Soil submergence in a flood-irrigated rice field can lead to significant reductions in CO2 fluxes and emissions compared to upland crop production [10]. Reports on daily CO2 fluxes in rice paddies generally describe a decreasing trend during daytime followed by an increasing trend during nighttime [16].
Daily variations in flooded rice paddies generally showed minimum CH4 fluxes in the early morning and maximum fluxes in the late afternoon [17]. Given the wide daily oscillations of fluxes, hourly measurements that are assumed to represent daily flux averages can under- or over-estimate actual CH4 release [18]. Summarizing the general patterns observed in previous studies, the International Atomic Energy Agency (IAEA) created a series of recommendations for the closed-chamber method in the analysis of daily and seasonal CH4 fluxes from flooded rice paddies, suggesting the time periods between 0600 and 0800 and 1300 and 1500 hours as ideal to capture the baseline flux intended to represent the daily average flux [19]. In Arkansas, Brye, et al. (2017) evaluated diurnal CH4 fluxes as affected by cultivar in a delayed-flood rice production system. Results showed that texture and rice growth stage can affect the time of the day when maximum, minimum, and daily average CH4 fluxes are measured [20]. Late morning to mid-day was suggested as the optimal time window to measure the mean daily CH4 flux [20].
Similar to CO2 and CH4, the sampling frequency for N2O can alter the measured variation of fluxes [21]. Weekly hourly samplings are often used to interpolate between and estimate season-long emissions [11-14] with more intensified sampling frequency following certain events, like fertilization, that can cause peak of N2O fluxes [21]. In most environments, N2O formation is influenced by available nitrogen (N), carbon (C), and soil oxygen (O2) concentrations and temperature [22]. On a daily basis, soil N and C are not expected to vary greatly, while O2 concentration and temperature follow diurnal fluctuations that are strongly affected by rainfall events and irrigation applications [22]. Sampling interval and measurement time of the day represent the two main issues with accurate N2O emissions estimates [9]. Long sampling intervals can mis-represent long-term variation and episodic events, increasing the potential impact of outliers [9]. Sampling protocols for N2O suggest weekly gas collection, avoiding the time period between 1100 and 2000 hours when peak daily fluxes and largest flux variations have been reported [9]. Furthermore, N2O fluxes measured at 1000, 1900, and 2000 hours represented intermediate measurements, but close to the daily flux average [22]. Recommendations indicate the time window between 0800 and 1200 hours as ideal to capture the daily N2O flux average [22].
Though most of the prior work on diurnal variations in GHG fluxes from rice production have been conducted for CH4 from flooded-soil conditions, for a variety of reasons, different water regimes other than flood-irrigation have been developed for rice production in the past decade, namely furrow-irrigation [10,23]. Della Lunga, et al. (2020b) recently reported on the differential soil moisture and oxidation-reduction (redox) potential conditions that occur throughout a production-scale, furrow-irrigated rice field in east-central Arkansas. Though constant-flooded conditions facilitate CH4 emissions, with little to no CO2 or N2O emissions, frequent soil moisture oscillations between saturated and near-saturated conditions facilitate CO2 and N2O emissions, with little to no CH4 emissions [13,24]. Consequently, the spatially variable soil moisture and redox conditions associated with furrow-irrigated rice production may create an environment where diurnal variations in GHG fluxes may differ from those measured under flooded-soil conditions, thus warranting investigation.
To date, no studies have simultaneously measured CO2, CH4, and N2O fluxes at various periods in the diurnal cycle in a furrow-irrigated production system in Arkansas or in the US. Therefore, the main objective of this study was to simultaneously quantify hourly CO2, CH4, and N2O fluxes at multiple intervals over a period of 20 hours in a furrow-irrigated rice field on a silt-loam soil in eastern Arkansas during the vegetative lag phase. A secondary objective was to evaluate the effects of site position (up-, mid-, and down-slope) and tillage practice [conventional tillage (CT) and no-tillage (NT)] on CO2, CH4, and N2O fluxes measured at multiple intervals over the same 20-hour period and estimated GHG emissions. It was hypothesized that GHG fluxes will differ over the diurnal cycle, with greater CO2, N2O and CH4 fluxes in the middle of the day than in the early morning or nighttime hours, due to the greater air temperatures in the second half of the day. It was also hypothesized that hourly fluxes, and resulting daily CH4 emissions estimates, will be largest at the down-slope position due to the prevalence of anaerobic conditions [24]; hourly fluxes and daily N2O emissions estimates will be largest at the up-slope position due to the prevalence of aerobic conditions [24]; and hourly fluxes and daily CO2 emissions estimates will be largest at the mid-slope position due to frequent alternating wet and dry cycles [24]. In addition, it was hypothesized that hourly fluxes and daily emissions for the three gases combined will be greater under NT than CT due to the greater availability of C and N substrate from the presence of crop residues.
Materials and Methods
Site description
Research was conducted at the University of Arkansas Rice Research and Extension Center (RREC) (34.46 °N, -91.46 °W) near Stuttgart, AR in Arkansas County in July 2018 and 2019. The study area was approximately 400-m long and 12-m wide, with an average slope of 2% oriented in the north-south direction. DeWitt silt loam (fine, smectitic, thermic Typical Albaqualfs) [25,26] is mapped throughout the study area that has been under cultivated agriculture for at least 15 years [24,27].
The climate in the region is warm and moist and is classified as Humid Subtropical (Cfa) by the Koppen Classification System [28]. Within the study region, the 30-yr (1981-2010) mean annual air temperature is 16.5 ℃, while the 30-yr mean annual precipitation is 125.2 cm [29]. Air temperature, relative humidity, and barometric pressure data were measured during each gas sampling procedure using a portable meteorological station (S/N: 182090284, Control Company, Webster, TX). Evapotranspiration (ET), rainfall, and solar radiation data were obtained from a micrometeorological weather station near the RREC. Irrigation data were obtained via a meter installed in the major pipeline to which the irrigation system for the study area was connected.
Initial, pre-plant soil properties in the top 10 cm in 2018 have been characterized and reported in several recent studies [14,24,27]. Soil particle-size analyses confirmed a silt-loam textural class throughout the entire study area, with silt ranging from 0.70 to 0.75 g g-1 and clay ranging from 0.11 to 0.15 g g-1 [24,27]. Soil organic matter (SOM) and total nitrogen (TN) contents ranged from 20.4 to 28.5 Mg ha-1 and 0.9 to 1.2 Mg ha-1, respectively [24,27]. Initial soil pH was within the 5.0 to 6.75 soil pH range for optimal rice growth [24,27,30]. Additional initial, pre-plant soil physical and chemical properties in the top 10 cm were measured and reported in Della Lunga, et al. [24,27].
Field management and continuous soil measurements
One 6-m-wide strip along the entire 400 m field length was prepared with CT, while an adjacent 6-m-wide strip was prepared without tillage as a stale-seedbed approach, which will be referred to hereafter as NT, prior to rice planting in late Spring 2018 and 2019. Each tillage strip contained six raised beds for a total of 12 beds that made up the whole study area. Measurement areas at an up-, mid-, down-slope position were established [24,27].
On 17 May 2018, the study area was planted with the hybrid cultivar CL7311 (RiceTec, Alvin, TX). On 30 April 2019 the study area was planted with a similar hybrid cultivar 214-Gemini (RiceTec). After planting each year, the study area was mechanically broadcast-amended with 101 kg ha-1 of potassium as muriate of potash and 67 kg ha-1 of phosphorous applied as diammonium phosphate, while 168 kg ha-1 of N applied as coated urea were applied at the 4- to 5-leaf stage.
Furrow-irrigation occurred approximately once per week each year during the growing season using a lay-flat poly pipe laid out at the up-slope field boundary. Once the down-slope portion of the field developed ponded conditions, a tail water recovery pump, installed at the lower end of the field, ran continuously to maintain a constant presence of water in the down-slope portion of the study area. Herbicides were applied as needed at various times each year to control weeds following recommendations for rice grown under flooded conditions [31]. Additional field management details were reported in Della Lunga, et al. [14,24,27].
Volumetric soil water content (VWC; reflectometer model CS616, Campbell Scientific, Inc., Logan, UT), soil temperature (thermocouple Type E, chromel-constantan), and soil redox potential (Eh) (sensor model S65OKD-ORP, Sensorex, Garden Grove, CA) were continuously measured at the 7.5 cm depth on top of the raised beds from before gas sampling began through the end of the GHG sampling period. Detailed results of the temporal soil measurements over the whole growing season were reported in Della Lunga, et al. [14,24,27].
Gas sampling and analyses
After rice emergence each growing season, three, 30-cm-diameter, 30-cm-tall, poly vinyl chloride base collars were installed on top of the raised beds in each of the six site position-tillage treatment combinations within the study area, for a total of 18 base collars for GHG measurements [14]. Base collars were manually installed in every other bed to a depth of 12 cm [14]. Irrigation water freely flowed into and out of the base collars through four holes drilled into the bottoms of each collar [14]. Base collars were installed such that each collar contained portions of two rice rows [14].
Gas sampling occurred on 23 and 24 July in 2018 and 2019, which corresponded to 67 and 68 and 84 and 85 days after planting (DAP), respectively, each year. The stage of the plants during gas sampling, the vegetative lag phase, was selected for the slow growth rate, characteristics of the period of the growing season between vegetative and reproductive stages [31]. Gas sample collection occurred at 1600, 2000, and 2400 hours on the first day and at 0400, 0800, and 1200 hours the second day, for a total of six gas collections at 4-h intervals over a 20-h time period. Following procedure used in previous studies [11-13], gas samples were collected at 20-minute intervals (0, 20, 40, 60 minutes) over a 1-h period. Gas samples were analyzed with a Shimadzu GC-2014 ATFSPL 115V gas chromatograph (GC; Shimadzu North America/Shimadzu Scientific Instruments, Inc., Columbia, MD) using a flame ionization detector for CH4 and CO2 and an electron capture detector for N2O. Gas sample analyses in both years were completed within two weeks of sample collection in the field. Additional gas sample vials were prepared and tested over a period of three weeks to ensure that no leaks occurred once gas samples were injected in the vials [27].
Following procedure used in previous studies [11-13], hourly fluxes were calculated based on linear regressions conducted across the four gas concentrations measured over the 1-h sampling period and GHG emissions for the 20-h measurement period, referred to hereafter as daily emissions, were estimated by summing linear interpolations between measured hourly fluxes. Only measured fluxes ≥ 0 were considered for this study [11-13]. Measurements of CO2 fluxes and calculated emissions in the current study were intended to represent the net sum of soil respiration from roots and microbes, dark plant respiration, and CO2 uptake from photosynthesis without distinction among processes. Global warming potential (GWP) was determined on a chamber-by-chamber basis using conversion factors of 298 and 34 for N2O and CH4, respectively, to obtain CO2 equivalents [13]. Additional gas sampling and analysis details were reported in Della Lunga, et al. [14].
Statistical analyses
Following similar analyses used recently [24,27], based on a split-split-split-plot design, a four-factor analysis of variance (ANOVA) was conducted using PROC GLIMMIX in SAS (version 9.4, SAS Institute, Inc., Cary, NC), with a gamma data distribution, to evaluate the effects of year (2018 and 2019), tillage (NT and CT), site position (up-, mid-, and down-slope), sampling time (1600, 2000, 2400, 0400, 0800, and 1200 hours), and their interactions on CO2, CH4, and N2O fluxes. The whole-plot factor was year, the split-plot factor was tillage, the split-split plot factor was site position, and the split-split-split-plot factor was sampling time. A three-factor ANOVA was performed using PROC GLIMMIX, with a gamma distribution, to evaluate the effects of year, tillage, site position, and their interactions on estimated daily CO2, CH4, N2O emissions. Each of the three replicate measurements within the six tillage-site position treatment combinations were assumed to represent independent observations. Raw residuals for each analyzed variable were plotted and visually evaluated for degree of skewedness. Significant treatment effects were judged at P < 0.05. When appropriate, means were separated by least significant difference at the 0.05 level.
Results and Discussion
Meteorological and environmental conditions
Characterization of meteorological parameters depicted similar conditions in the 2018 and 2019 rice growing seasons (Table 1). The difference in the length of the growing seasons (122 days in 2018 and 131 days in 2019) along with the slightly different characteristics of the planted cultivars [32] determined the timing of similar growing stages, such as the lag vegetative phase, at different temporal points in the two growing seasons. Although the 2019 growing season was overall wetter than the 2018 growing season, during the three days preceding the gas samplings, the study area in 2018 received eight times more rainfall than in 2019 (Table 1) [24]. Due to lower rainfall in 2019, irrigation was applied during the day preceding (83 DAP) and during the morning of the first day (84 DAP) of the GHG sampling, while, in 2018, the study area did not receive any irrigation during the 48 hours preceding or during GHG sampling (Table 1).
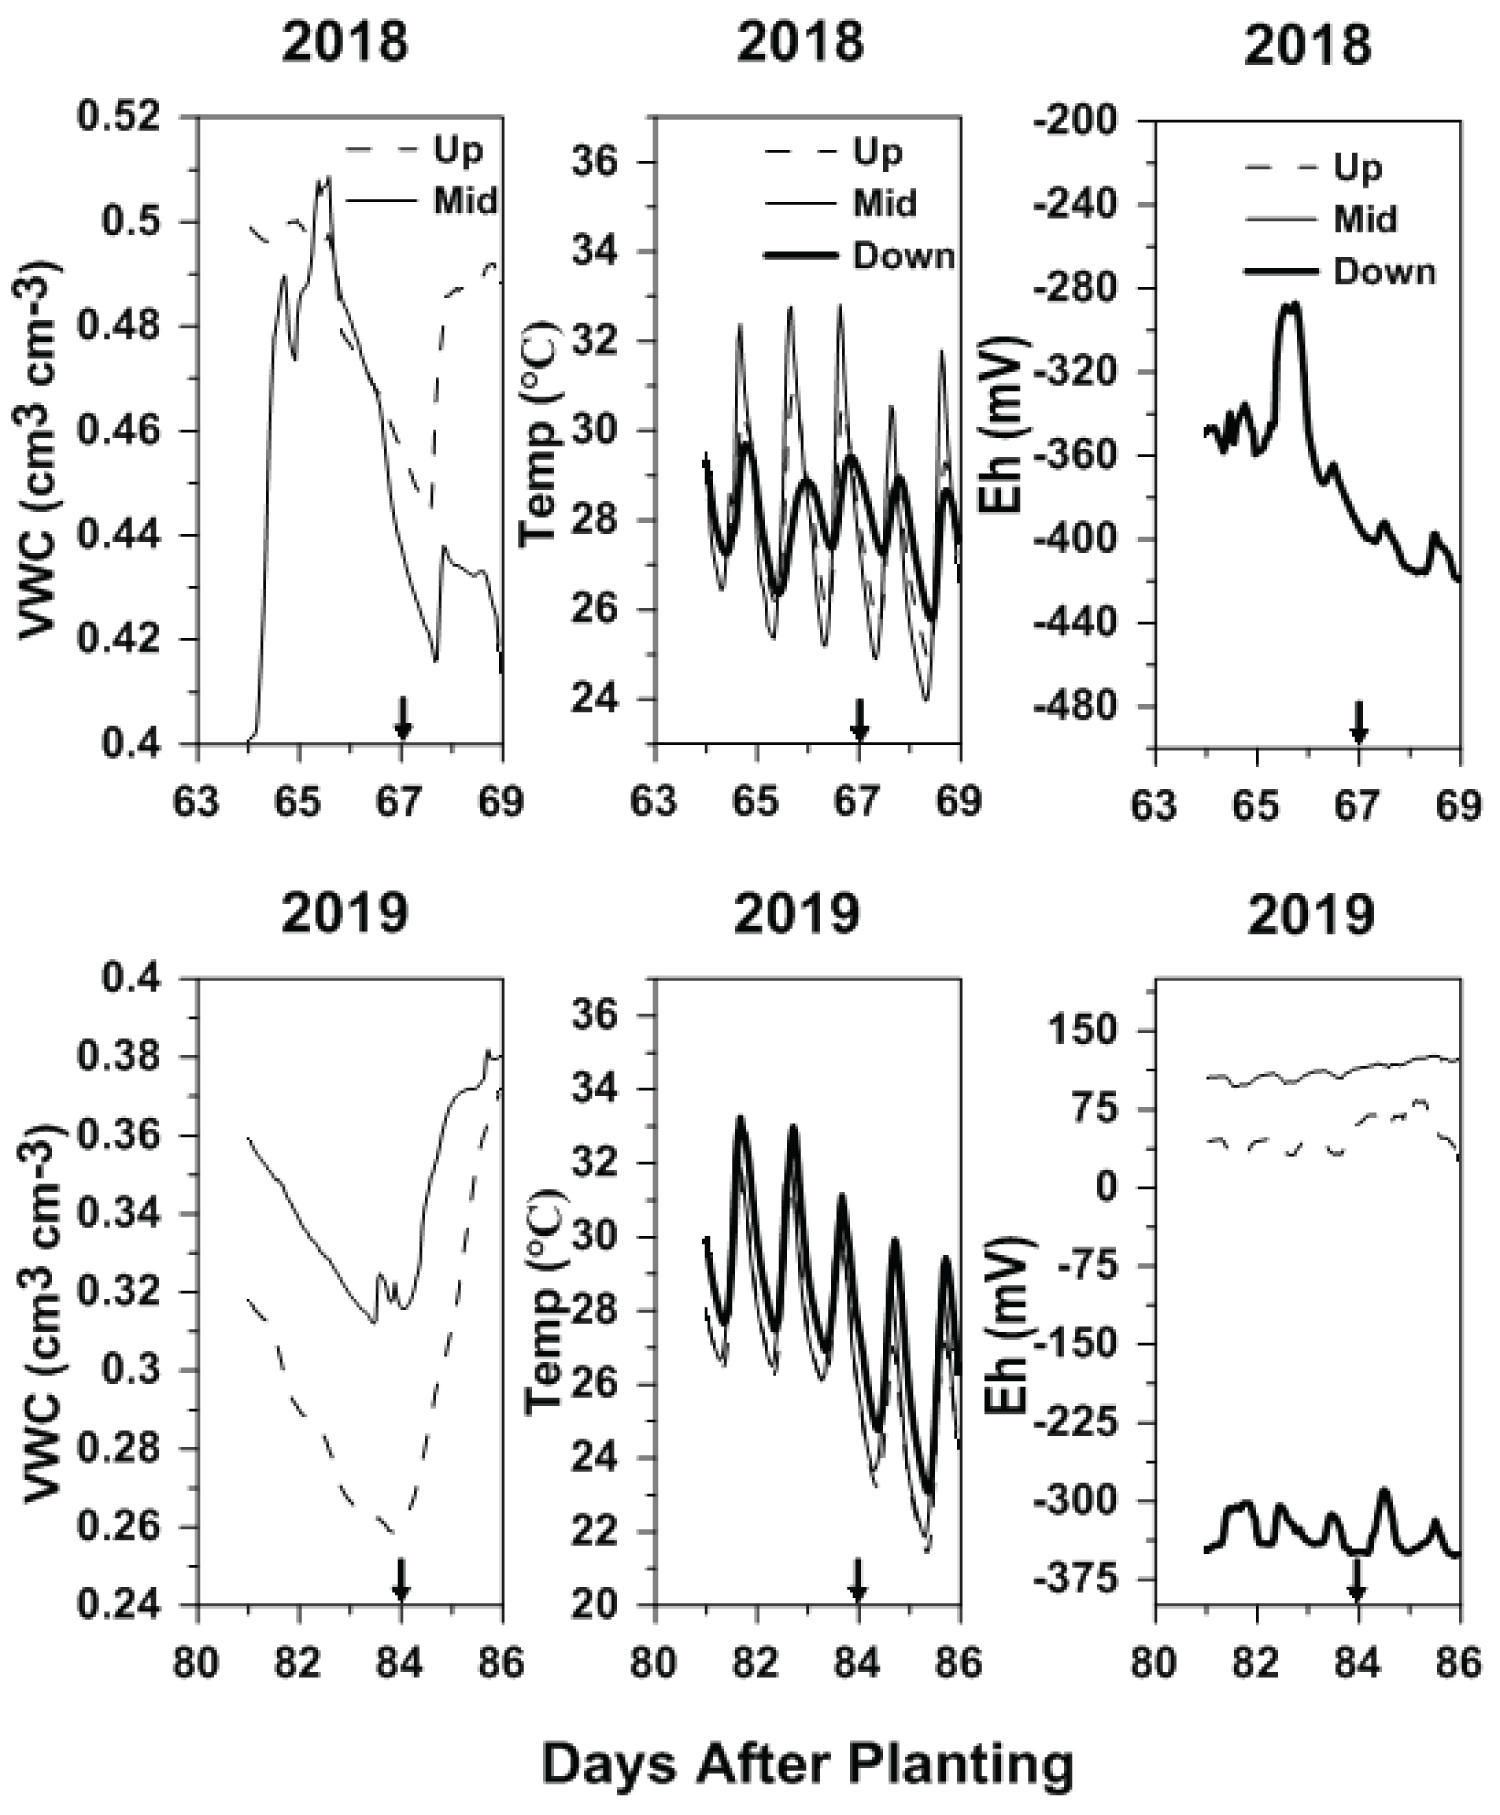
Air temperature, air pressure, solar radiation, and evapotranspiration showed similar ranges in both growing seasons, reinforcing the validity of the result of the current study (Table 1). All the meteorological parameters showed ranges within the normals calculated as daily averages over the 30-years period between 1981 to 2010 [33]. Environmental parameters, such as soil temperature, VWC, and soil Eh, however, depicted somewhat different conditions in the two growing seasons (Figure 1).
Although no formal statistical analysis was performed to evaluate difference between years and site-position, soil VWCs were numerically greater in 2018 than in 2019 in both up- and mid-slope positions averaged across tillage treatments (Figure 1). Soil VWC in 2018 ranged from 0.44 to 0.50 cm3 cm-3 and from 0.40 to 0.51 cm3 cm-3 in the up- and mid-slope positions, respectively, while in 2019 VWC ranged from 0.26 to 0.36 cm3 cm-3 and from 0.31 to 0.38 cm3 cm-3 in the up- and mid-slope positions, respectively (Figure 1). Irrigation and rainfall events were likely responsible for the difference in VWC between years (Table 1 and Figure 1). Across the 5 days prior to GHG sampling during which environmental parameters were considered, in both years, the up- and mid-slope positions never reached saturation (i.e., ~0.54 and 0.56 cm3 cm-3, respectively), while the down-slope position was considered in saturated conditions due to the extended presence of ponded water.
Soil temperature was similar among the three site positions in both growing seasons (Figure 1). In 2018, soil temperature ranged from 25 to 31 ℃, from 24 to 33 ℃, and from 26 to 29 ℃ in the up-, mid-, and down-slope positions, respectively, while, in 2019, soil temperature ranged from 21 to 32 ℃, from 22 to 33 ℃, and from 23 to 33 ℃ in the up-, mid-, and down-slope positions, respectively (Figure 1). During the 24-hour period of gas sampling, soil temperature oscillated between values entirely within the optimal range (20 to 30 ℃) for microbial activity [34,35]. Soil redox potential in 2018 ranged from -287 to -419 mV at the down-slope position and from 26 to 83 mV, from 96 to 126 mV, and from -289 to -352 mV in 2019 at the up-, mid-, and down-slope positions, respectively (Figure 1).
In both years, the down-slope position experienced anaerobic (< -150 mV) [36] and reducing conditions during the 5-day period prior to GHG sampling (Figure 1). The negative trend of Eh observed at the down-slope position in 2018 was most likely related to rainfall events and irrigation applications that occurred in the several days prior to GHG collection (Figure 1 and Table 1). Soil Eh at the up- and mid-slope positions in 2019 depicted O2-deficient (from -150 to 200 mV) conditions for the entire 5-day period prior to GHG sampling (Figure 1) [24,36]. The characterization of environmental parameters, such as soil temperature, VWC, and soil Eh, allows for the delineation of the conditions in which microbial processes, like nitrification, denitrification, or methanogenesis, take place [37,38]. A complete description of the season-long soil VWC, soil temperature, and soil Eh trends for 2018 and 2019 within the study field was described in Della Lunga, et al. [24].
Hourly fluxes
The wide variation of hourly GHG fluxes measured in both seasons indicates that several factors, like climate, soil properties, and agricultural practices, are involved in the production and release of GHGs [17]. Hourly CO2 fluxes differed (P < 0.005) among year-site position-sampling time treatment combinations, while hourly CH4 and N2O fluxes differed (P < 0.001) among year-tillage-site position-sampling time combinations (Table 2).
CO2
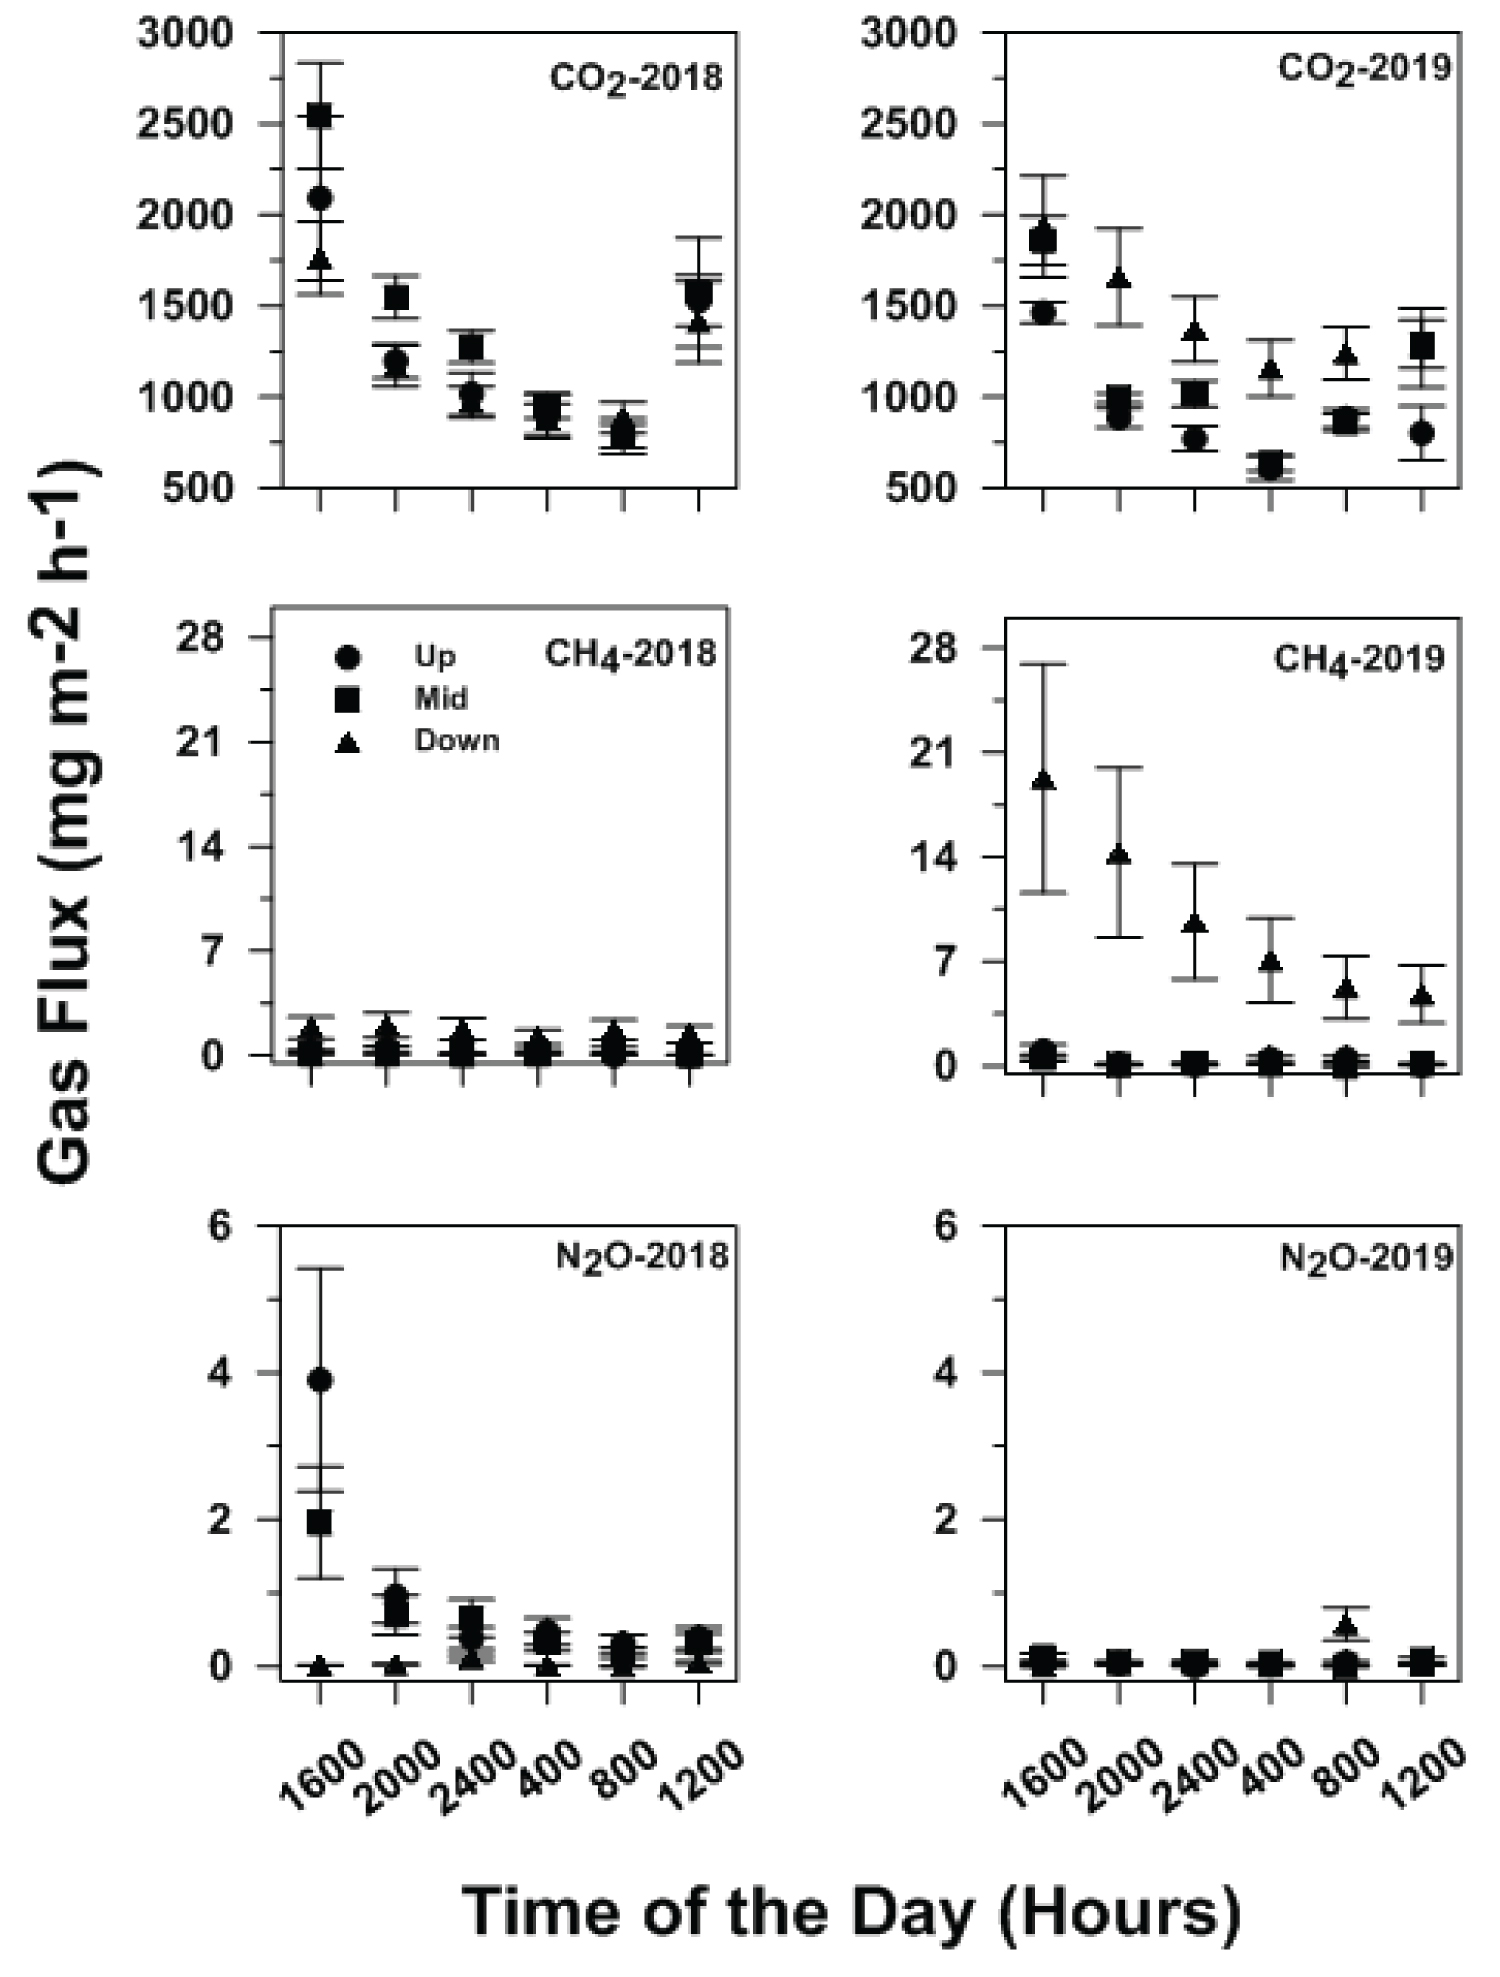
Averaged across tillage treatments, hourly CO2 fluxes, as hypothesized, were greatest for the 2018/mid-slope/1600-hour combination, which did not differ from the 2018/up-slope/1600-hour combination (Table 2 and Table 3). However, hourly CO2 fluxes were lowest for the 2019/up-slope/0400-hour combination, which did not differ from the 2019/mid-slope/0400-, 2018/up- and mid-slope/0800-, and the 2019/up-slope/2400-hour combinations (Table 2 and Table 3). The combination of large air temperature during the mid-day and the greater number of wet-dry cycles at the mid-slope position [24] likely enhanced soil respiration and CO2 release [14].
Among the environmental parameters, air temperature variation and solar radiation oscillations likely played a fundamental role in enhancing or reducing CO2 fluxes (Figure 2). Temporal CO2 flux tended to decrease from 1600 one day to 0800 hours the next day and tended to increase from 0800 to 1200 hours in both years (Figure 1 and Figure 2). Although not clearly evident in this study, a bimodal pattern of CO2 fluxes in rice fields has been described in previous studies [39]. Many C3 plants, including rice, showed a mid-day depression of photosynthesis, related to an increase in photorespiration due to photoinhibition and reduced stomatal conductance [39]. However, large-yielding hybrid rice showed a greater resistance to photoinhibition due to the capacity to maintain large photosynthetic rates even at large solar irradiance and air temperatures [40].
Generally, CO2 fluxes closely followed the daily soil temperature oscillations (Figure 2). In a study conducted in 2008 in Japan, continuous measurements for CO2 were taken during the entirety of the growing season in rice paddies characterized with a clay-loam topsoil [10].
Results showed small diurnal variations during the submergence of the soil with negative fluxes (i.e., CO2 uptake) during nighttime [10]. However, during the draining period in the middle of the growing season, a significant correlation between CO2 efflux and soil temperature was observed, although a lag time between daily maximum temperature and daily maximum CO2 flux was present [10]. In a multi-approach study conducted on rice paddies in China in 2009, canopy CO2 fluxes closely followed PAR variations, with maximum fluxes measured around noon [41]. Results showed that light intensity constituted a main controlling factor of CO2 uptake via photosynthesis [41]. However, the relevance of light in CO2 fluxes was shown to decline with rice plants' development toward senescence [41].
In a furrow-irrigated system in eastern Arkansas, along the predominant slope, multiple environmental settings are present, affecting the potential control of meteorological conditions on GHG fluxes [24]. Of the 12 measurements per site position across years and sampling times, the up- and mid-slope positions significantly differed only for the 2019/2400- and 2019/1200-hour combinations, while in all other treatment combinations there was no difference between the up- and mid-slope positions (Table 3). In contrast, a significant difference between up- and mid-slope positions occurred in 50% of the treatment combinations across years and sampling times (Table 3). Generally, within a site position, the down-slope position experienced fewer significant differences than the up- and mid-slope positions, likely due to the presence, although not continuous, of ponded water (Table 3). The presence of the flood at the down-slope position, in conjunction with the specific heat of water, likely maintained narrower soil temperature fluctuations, particularly in 2018, than at the up- and mid-slope position, which affected CO2 production and release (Table 3 and Figure 1) [24].
The adaptive capacity of the different hybrid cultivars grown each year likely contributed to the absence of CO2 flux differences between tillage treatments (Table 2). The hybrid cultivars developed in the last decade have enhanced growth under different tillage treatments and water management regimes [42]. Tillage practices increase the availability of soil organic carbon (SOC) that can be oxidized by increasing the surface area for microbial action [43]. The mechanical agitation during tillage practices destroys the aggregation of particles that were protecting organic material from further decomposition [43]. In a study conducted in West Africa on loamy soils cultivated with the same rice variety, CO2 fluxes and emissions were two times greater in fields with CT than with NT practices early in the growing season; however, by two weeks after tilling, CO2 emissions from the two tillage treatments did not differ [43]. The more advanced growth stage in the season during which GHG fluxes were assessed could have masked the early season tillage effect on production and release of CO2.
CH4
Hourly CH4 flux trends somewhat differed from those for CO2 and appeared to be less related to soil temperature fluctuations (Table 3 and Figure 2). The decreasing temporal trend at the down-slope position in 2019 was likely related to the decreasing VWC recorded throughout the entire study area during the 24-hour period prior sampling (Figure 1 and Figure 2). Hourly CH4 fluxes, as hypothesized, were largest for the 2019/NT/down-slope/1600-hour combination and did not differ from that for the 2019/NT/down-slope/2000-, 2400-, 0400-, 0800, and 1200-hour combinations and from the 2019/CT/down-slope/1600-hour combination (Table 4). The lowest hourly CH4 flux was recorded for the 2018/NT/up-slope/0800-hour combination and did not differ from the 2018/NT/mid-slope/1200- and 2019/NT/mid-slope/0800-hour combinations (Table 4). The greater magnitude of hourly fluxes observed at the down-slope position in 2019 was likely related to the relatively continuous presence of ponded water that created ideal conditions for anaerobic environments and methanogenesis [24].
Spatial and temporal CH4 flux variability has been often associated with the complex nature of the soil environment [17]. Previous studies in rice paddies reported maximum daily CH4 fluxes between 1100 and 1500 hours [44], 1600 and 1900 hours [45], and between 2000 and 2200 hours [46]. Methanogenesis and methanotrophic processes can be directly and indirectly affected by air, soil, and water temperature, and plant eco-physiological characteristics [18]. The driving factors for CH4 production can vary hourly, weekly, and/or seasonally, leading to wide CH4 flux variations [18].
In a study conducted at the International Rice Research Institute (IRRI) on diurnal GHG variations in rice paddies on clay soils, CH4 fluxes were strongly correlated (r = 0.78) to 7.5 cm depth soil temperature [47]. However, in a study on a paddy rice field in Japan, diurnal CH4 fluxes were significantly correlated to 2-cm soil temperature, but not to 10 cm soil temperature [47]. In contrast to the results of the current study, Brye, et al. (2017) reported maximum CH4 fluxes at night and minimum fluxes during late afternoon in a study conducted at the RREC in 2014 on a silt-loam soil under delayed-flood rice production practices. In the current study, the combination of soil temperature and particularly soil Eh likely played fundamental roles in CH4 flux variations among site positions (Figure 1 and Figure 2). Mid-morning-measured CH4 fluxes examined over the entire 2018 and 2019 growing seasons were indeed strongly correlated with soil Eh (r = -0.59) [14].
N2O
Hourly N2O fluxes showed somewhat opposite trends compared to CH4 fluxes (Table 4 and Figure 2). As hypothesized, hourly N2O fluxes were largest from the 2018/NT/up-slope/1600-hour treatment combination, which did not differ from the 2018/CT/mid-slope/1600-hour combination, while the lowest hourly N2O flux occurred from the 2019/NT/down-slope/1600-hour combination, which did not differ from the 2018/NT/down-slope/0800-, the 2019/NT/down-slope/0400-, and the 2019/NT/mid-slope/0800-hour combinations (Table 4). Similar results were obtained in previous studies conducted on fertilized soils in Scotland and in Argentina in 2008, where maximum N2O fluxes were reported at 1500 hours [22]. Generally, the up-slope position, especially in 2018, produced greater N2O fluxes than the mid- and down-slope positions due to relatively consistent aerobic conditions that enhanced nitrification [13,24]. The decreasing N2O fluxes over time at the up-slope position in 2018 were likely due to the decreasing VWC during the diurnal sampling intervals (Figure 1 and Figure 2).
The site position where peak N2O fluxes occurred and the observable temporal trends suggest that VWC and soil temperature, in this order, played a major role in regulating N2O production. Nitrous oxide flux trends in agricultural fields have been shown to exponentially increase with soil temperature and moisture content due to the expansion of anaerobic zones and to the acceleration of soil respiration [22]. Studies in rice paddies in the Philippines suggested that seasonal N2O variations were more prominent than diurnal fluctuations, likely due to the large range of daily fluxes due to N2O hotspot distribution [48]. However, in contrast to results of the current study, an opposite trend was observed in a study conducted on subtropical estuarine wetlands, where N2O fluxes measured over a 24-hour period increased significantly during the evening hours, reaching a peak around 2300 hours [49].
Using just the raw data acquired from direct measurements, the overall average hourly CO2, CH4, and N2O fluxes (i.e., 1220, 2.88, and 0.44 mg m-2 h-1, respectively) measured at 4-hour intervals over a 20-hour period was best represented by the fluxes measured at 0800 hours. The overall average hourly CO2, CH4, and N2O fluxes were within 15% of the direct measurements at 0800 hours. These results strengthen the validity of the method used to interpolate among hourly fluxes measured in the early to mid-morning in previous studies [11-13,20]. Additionally, flux measurements made at 2000 hours were intermediate and close to the average hourly fluxes, as observed in previous studies in rice paddies [9,22].
Daily emissions
Greenhouse gas emissions were estimated as interpolations between direct measurements, on a chamber-by-chamber basis, over the 20-hour study period across the two consecutive days each year and are hereafter referred to as daily emissions. Daily CO2 emissions differed (P = 0.005) among year-site position treatment combinations, daily CH4 emissions differed among year-tillage (P = 0.038), year-site position (P = 0.011), and tillage-site position (P < 0.001) treatment combinations, while daily N2O emissions differed among year-tillage-site position (P = 0.046) treatment combinations (Table 5). Global warming potential, as estimated from the sum of the daily CO2, CH4, and N2O emissions on a chamber-by-chamber basis, differed among year-site position treatment combinations (P = 0.001; Table 5).
Averaged across tillage treatments, daily CO2 emissions were greatest from the 2019/down-slope treatment combination and did not differ from the 2018/up-, mid-, and down-slope treatment combinations (Table 6). More treatment variations were observed in 2019 than in 2018. Daily CO2 emissions from the up- and mid-slope positions were low compared to all other year-site positions treatment combinations, but did not differ from each other (Table 6). The generally lower VWC throughout the entire 2018 season likely attenuated difference along the predominant slope of the field, while the wetter season in 2019 created a more prominent water movement along the slope and length of the study area, highlighting the difference between the relatively dry up-slope, the relatively moist mid-slope, and the saturated/flooded down-slope position (Table 6) [24].
In contrast to CO2 emissions, treatment effects on daily CH4 emissions were more complex (Table 6). Averaged across site positions, daily CH4 emissions were greatest from the 2019/NT and did not differ from the 2019/CT treatment combination, while the lowest daily CH4 emissions occurred from the 2018/NT, which did not differ from the 2018/CT treatment combination (Table 6). Although lower VWC was measured during gas sampling at the up- and mid-slope positions in 2019 than in 2018, the generally wetter conditions in 2019, specifically at the down-slope position, created more anaerobic/reducing soil conditions to enhance methanogenic activity [24]. Additionally, the more uniform soil Eh at the down-slope position in 2019 favored CH4 production and release (Figure 1). The difference between tillage treatments across years was likely related to the numerically greater VWC under CT in 2018 and under NT in 2019 [24].
Averaged across tillage, daily CH4 emissions were largest from the 2019/down-slope and lowest from the 2018/mid-slope treatment combination, which did not differ from the 2018/up- and 2019/mid-slope treatment combinations (Table 6). Daily CH4 emissions at the down-slope position represented 93 and 80% of the total CH4 daily emissions averaged across tillage treatments in 2019 and 2018, respectively (Table 6).
Averaged across years, daily CH4 emissions were largest from the NT/down- and lowest from the NT/mid-slope treatment combination (Table 6). Daily CH4 emissions measured at the down-slope position represented 95 and 74% of the total CH4 emissions averaged across years under NT and CT, respectively (Table 6). The extreme variability in environmental conditions encountered in a furrow-irrigated rice production system, specifically under NT where soil disturbance is reduced, is highlighted by the maximum and minimum daily CH4 emissions that occurred under NT (Table 6).
In contrast to daily CO2 and CH4 emissions, daily N2O emissions varied widely, confirming the dynamic nature of coupled nitrification-denitrification processes often associated with hotspots [13]. Daily N2O emissions were largest from the 2018/NT/up-, which did not differ from the 2018/CT/mid-slope treatment combination, while the lowest daily N2O emissions occurred from the 2019/NT/up-, which did not differ from the 2019/NT/mid-, 2019/CT/up-, and 2018/CT-NT/ down-slope treatment combinations (Table 6). The drier 2018 season and the greater aerobic conditions at the up-slope position created more optimal conditions for N2O production and release following nitrification processes [14]. The 2018 growing season generally had numerically greater N2O emissions than the 2019 growing season, likely due to the difference in VWC between the two years [24]. Surprisingly, the down-slope position under NT in 2019 had greater daily N2O emissions than the up- and mid-slope positions (Table 6). The TN content in the NT/down-slope treatment combination (26 Mg ha-1) was between 5 and 15% greater than in the other tillage-site position treatment combinations [27]. It is likely the greater TN content in the NT/down-slope treatment combination played a role providing greater substrate for microbial activity [27].
Daily global warming potential
The estimated daily GWP from diurnal measurements closely followed the CO2 emissions trends (Table 5, Table 6 and Table 7). The estimated daily GWP was largest for the 2019/down-, which did not differ from the 2018/mid- and up-slope treatment combinations, while estimated daily GWP was lowest for the 2019/up-, which did not differ from the 2019/mid-slope treatment combination (Table 7). The predominance and magnitude of daily CO2 emissions in the GWP estimation cause GWP to vary as daily CO2 emissions varied (Table 5, Table 6 and Table 7). However, results for estimated daily GWP clearly highlight the relevance of VWC in GHG evaluations. The different rainfall amounts, 36.2 and 59.3 cm in 2018 and 2019, respectively, and irrigation applications, 15 and 12 cm ha-1 in 2018 and 2019, respectively, each year created contrasting environmental conditions between years [24,27].
Implications
The large variety of GHG sources increases the uncertainties in estimating CO2, CH4, and N2O emissions at local and global scales [2]. The current study, using a bottom-up approach, attempted to reduce the level of uncertainties in GHG analyses in the relatively new furrow-irrigated rice production system. Although limited to a specific point in the growing seasons, the data obtained from the current study clearly established that hourly fluxes of GHG (i.e., CO2, CH4, and N2O) behaved similar to what has been reported in rice production systems under flooded conditions [9,20,22]. Although the overestimation issue, characteristic of bottom-up approaches, is still a factor in the current study, results strengthened the reliability of the closed-chamber method and the sampling protocols used to evaluated GHG fluxes and emissions in rice fields [11-13,20]. Environmental factors and agricultural practices clearly showed temporal and significant effects on GHG production and release, underlining the large degree of variability of the microbial community in general in an environment characterized by the coexistence of dry, moist and saturated conditions, such as in a furrow-irrigated rice field.
Conclusions
Based on results from two consecutive growing seasons in a furrow-irrigated rice production system under different tillage treatments in eastern Arkansas, hourly GHG fluxes differed among years, diurnal sampling times, tillage treatments, and site positions, while daily GHG emissions differed among years, tillage treatments, and site positions. Temporal analysis, although limited to a 20-hour period, clearly showed flux maxima in the late afternoon and flux minima in the early morning for CO2, CH4, and N2O, which was tightly connected with environmental parameter trends. Soil temperature and VWC likely drove magnitudes and temporal and spatial variability of hourly CO2 and N2O fluxes and daily emissions, while soil Eh played a major role in CH4 production and release. The optimum measurement time of the day to capture hourly GHG flux averages appeared to be close to the 0800-hour sampling time, strengthening the validity and reliability of the sampling protocols and procedures developed for rice fields under flooded conditions and used for environmental analysis in the relatively new furrow-irrigated rice production system. Results related to GWP suggested that agricultural practices aimed to control soil VWC could be used as effective tool to reduce GHGs emissions and enhance environmental sustainability of rice production.
Acknowledgments
Dustin Pickelmann, Vaishali Kandpal, Joshua Humphreys, Tyler Durre, Ryder Anderson, and Shelby Lebeau are gratefully acknowledged for assistance in the field or laboratory.
References
- Friedlingstein P, O'Sullivan M, Jones MW, et al. (2020) Global carbon budget 2020. Earth Syst Sci Data 12: 3269-3340.
- Saunois M, Bousquet P, Poulter B, et al. (2016) The global methane budget 2000-2012. Earth Syst Sci Data 8: 697-751.
- Syakila A, Kroeze C (2011) The global nitrous oxide budget revisited. GGMM 1: 17-26.
- Dlugokencky EJ, Bruhwiler L, White JWC, et al. (2009) Observational constraints on recent increases in the atmospheric CH4 burden. Geophys Res Lett 36: L18803.
- Mosier AR, Kroeze C, Nevison C, et al (1998) Closing the global N2O budget: Nitrous oxide emissions through the agricultural nitrogen cycle. Nutr Cycl Agroecosystems 52: 225-248.
- Ciais P, Sabine C, Bala G, et al. (2013) Carbon and Other Biogeochemical Cycles. In: Climate Change 2013-The Physical Science Basis, Contribution of Working Group I to the Fifth Assessment Report of the Intergovernmental Panel on Climate Change, Cambridge University Press, United Kingdom, 465-570.
- Intergovernmental Panel on Climate Change (IPCC) (2018) Global warming of 1.5℃. Cambridge University Press, Cambridge, United Kingdom.
- Davidson EA (2009) The contribution of manure and fertilizer nitrogen to atmospheric nitrous oxide since 1860. Nat Geosci 2: 659-662.
- Wood JD, Gordon RJ, Wagner-Riddle C (2013) Biases in discrete CH4 and N2O sampling protocols associated with temporal variation of gas fluxes from manure storage systems. Agric For Meteorol 171-172: 295-305.
- Nishimura S, Yonemura S, Minamikawa K, et al. (2015) Seasonal and diurnal variations in net carbon dioxide flux throughout the year from soil in paddy field. J Geophys Res Biogeosci 120: 63-76.
- Rogers CW, Brye KR, Smartt AD, et al. (2014) Cultivar and previous crop effects on methane emissions from drill-seeded, delayed-flood rice production on a silt-loam soil. Soil Sci 179: 28-36.
- Smartt AD, Brye KR, Rogers CW, et al. (2016) Previous crop and cultivar effects on methane emissions from drill-seeded, delayed-flood rice grown on a clay soil. Appl Environ Soil Sci 2016: 1-13.
- Rector C, Brye KR, Humphreys J, et al. (2018) Tillage and coated-urea effects on nitrous oxide emissions from direct-seeded, delayed-flood rice production in Arkansas. J Rice Res Dev 1: 25-37.
- Della Lunga D, Brye KR, Slayden JM, et al. (2021) Relationships among soil factors and greenhouse gas emissions from furrow-irrigated Rice in the mid-southern, USA. Geoderma Reg 24: e00365.
- (2012) Global anthropogenic non-CO2 greenhouse gas emissions: 1990-2030. EPA 430-R-12-006. United States Environmental Protection Agency.
- Yamagishi T, Okada K, Hayashi T, et al. (1980) Cycling of carbon in a paddy field: I. Carbon dioxide exchange between the surface of a paddy field and the atmosphere. Jpn J Crop Sci 49: 135-145.
- Yagi K , Minami K (1993) Spatial and temporal variations of methane flux from a rice paddy field. In: Ormeland RS, Biogeochemistry of Global Change. Springer, Boston, USA, 353-368.
- Seok-In Y, Woo-Jung C, Jae-Eul C, et al. (2013) High-time resolution analysis of diel variation in methane emission from flooded rice fields. Commun Soil Sci Plant Anal 44: 1620-1628.
- Buendia LV, Neue HU, Wassmann R, et al. (1998) An efficient sampling strategy for estimating methane emission from rice field. Chemosphere 36: 395-407.
- Brye KR, Smartt AD, Norman RJ, (2017) Diurnal methane fluxes as affected by cultivar from direct-seeded, delayed-flood rice production. J Environ Prot Sci 8: 957-973.
- Smith KA, Dobbie K (2001) The impact of sampling frequency and sampling times on chamber-based measurements of N2O emissions from fertilized soils. Glob Change Biol 7: 933-945.
- Alves BJR, Smith KA, Flores RA, et al. (2012) Selection of the most suitable sampling time for static chambers for the estimation of daily mean N2O flux from soils. Soil Biol Biochem 46: 129-135.
- He C (2010) Effects of furrow irrigation on the growth, production, and water use efficiency of direct sowing rice. Sci World J 10: 1483-1497.
- Della Lunga D, Brye KR, Slayden JM, et al. (2020) Soil moisture, temperature, and oxidation-reduction potential fluctuations across a furrow-irrigated rice field on a silt-loam soil. J Rice Res Dev 3: 103-114.
- (2019) Natural Resources Conservation Service (NRCS). Web soil survey. United States Department of Agriculture (USDA).
- (2014) Natural Resource Conservation Service (NRCS). Soil series. United States Department of Agriculture (USDA).
- Della Lunga D, Brye KR, Slayden JM, et al. (2020) Chamber effects on soil moisture and plant productivity in furrow-irrigated rice on a silt-loam soil in Arkansas. J Rice Res Dev 3: 66-73.
- Arnfield JA (2016) Koppen climate classification. Encyclopædia Britannica. Encyclopædia Britannica Inc.
- (2010) National Oceanic and Atmospheric Administration (NOAA). Data tools: 1981-2010 Climate Normals. National Centers for Environmental Information (NCEI).
- Havlin JL, Tisdale SL, Nelson WL, et al. (2014) Soil Fertility and Fertilizers: An Introduction to Nutrient Management. (8th edn), Pearson Education Inc, Upper Saddle River, New Jersey, USA.
- Norman RJ, Slaton NA, Roberts T, (2013) Soil fertility. In: Hardke JT, Rice Production Handbook. University of Arkansas, Division of Agriculture, Cooperative Extension Service, Fayetteville, Arkansas, USA, 69-101.
- (2019) Arkansas Rice Performance Trials (ARPT). Arkansas rice cultivar testing 2015-2017. No 177.
- (2010) Western Regional Climate Center (WRCC). Stuttgart, Arkansas.
- Lai TV, Denton MD (2017) N2O and N2 emissions from denitrification respond differently to temperature and nitrogen supply. J Soils Sediments 18: 1548-1557.
- Penning H, Conrad R (2007) Quantification of carbon flow from stable isotope fractionation in rice field soils with different organic matter content. Org Geochem 38: 2058-2069.
- Wang J, Bogena HR, Vereecken H, et al. (2018) Characterizing redox potential effects on greenhouse gas emissions induced by water-level changes. Vadose Zone J 17: 1-13.
- Gogoi N, Baruah KK, Gogoi B, et al. (2005) Methane emission characteristics and its relations with plant and soil parameters under irrigated rice ecosystem of northeast India. Chemosphere 59: 1677-1684.
- Bateman EJ, Baggs EM (2005) Contributions of nitrification and denitrification to N2O emissions from soils at different water-filled pore space. Biol Fertil Soils 41: 379-388.
- Panda D (2011) Diurnal variations in gas exchange and chlorophyll fluoresence in rice leaves: The cause for midday depression in CO2 photosynthetic rate. J Stress Physiol Biochem 4: 175-186.
- Wang QA, Lu CM, Zhang QD (2005) Midday photoinhibition of two newly developed super-rice hybrids. Photosynthetica 43: 277-281.
- Tong L, Wang X, Geng C, et al. (2011) Diurnal and phenological variations of O3 and CO2 fluxes of rice canopy expose to different O3 concentrations. Atmos Environ 45: 5621-5631.
- Food and Agriculture Organization (2011) Save and Grow: A policymaker's guide to the sustainable intensification of smallholder crop production. Food and Agriculture Organization of the United Nations. Rome, Italy.
- Dossou-Yovo ER, Bruggemann N, Ampofo E, et al. (2016) Combining no-tillage, rice straw mulch and nitrogen fertilizer application to increase the soil carbon balance of upland rice field in northern Benin. Soil Tillage Res 163: 152-159.
- Satphany SN, Rath AK, Ramakrishnan B, et al. (1997) Diurnal variation in methane efflux at different growth stages of tropical rice. Plant Soil 195: 267-271.
- Schütz H, Holzapfel-Pschorn A, Conrad R, et al. (1989) A three years continuous record on the influence of daytime, season, and fertilizer treatment on methane emissions rates from an Italian rice paddy field. J Geophys Res 94: 16405-16416.
- Seiler W, Holzapfel-Pschorn A, Conrad R, et al. (1984) Methane emissions from rice paddies. J Atmos Chem 1: 241-268.
- Wang HU, Neue HU, Samonte HP (1999) Factors controlling diel patterns of methane emissions via rice. Nutr Cycl Agroecosystems 53: 229-235.
- Weller S, Kraus D, Butterbach-Bahl K, et al. (2015) Diurnal patterns of methane emissions from paddy rice fields in the Philippines. J Soil Sci Plant Nutr 178: 755-767.
- Yang W, Yuan C, Tong C, et al. (2017) Diurnal variation of CO2, CH4, and N2O emissions fluxes continuously monitored in-situ in three environmental habitats in a subtropical estuarine wetland. Mar Pollut Bull 119: 289-298.
Corresponding Author
Diego Della Lunga, Research Assistant, Department of Crop, Soil, and Environmental Sciences, University of Arkansas, Fayetteville, AR 72701, USA.
Copyright
© 2021 Della Lunga D, et al. This is an open-access article distributed under the terms of the Creative Commons Attribution License, which permits unrestricted use, distribution, and reproduction in any medium, provided the original author and source are credited.