Description of a Tumefactive Demyelinating Lesion Studied with Advanced Magnetic Resonance Techniques: A Clinical Report and Review of Literature
Abstract
Tumefactive Demyelinating Lesions (TDL) is atypical presentation of various demyelinating diseases like Multiple Sclerosis (MS). They can mimic brain tumors in their clinical and radiological features and usually respond favorably to corticosteroid therapy. We report the case of a 17-years-old girl with a single TDL suddenly enlarging even under steroid therapy. She underwent a very strict follow-up with conventional Magnetic Resonance (MRI) and Diffusion Weighted Imaging (DWI), Perfusion Weighted Imaging (PWI), Proton Magnetic Resonance Spectroscopy (PMRS). The lesion imaging behavior during the follow up pose a diagnostic challenge as it enlarged, showed areas of restricted diffusion and high perfusion. Diagnosis of TDL was initially hypothesized but the aggressive behavior of the lesion required biopsy.
Keywords
Tumefactive demyelinating lesion, Brain tumor, MR diffusion, MR imaging perfusion, MR imaging spectroscopy
Keys Practice Point
• Advanced magnetic resonance imaging techniques might help in the differential diagnosis of challenging solitary brain masses.
• ADC values might be low in an inflammatory setting.
• During the very acute phase of an inflammatory process an increase of rCBV and rCBF ratios could be observed probably because of the vasodilatation.
• Cell breakdown of both glial and neural elements occurring in a demyelinating plaque leads to high concentration of glutamate and glutamine.
Introduction
Tumefactive Demyelinating Lesions (TDL), also named 'demyelinating pseudo tumors', are a rare subset of demyelinating manifestations. The exact pathogenesis of TDL is not clearly understood [1-4]. They can occur in isolation, as part of Multiple Sclerosis (MS), Acute Disseminated Encephalomyelitis (ADEM) or Neuromyelitis Optica Spectrum Disorder (NMOSD) [5]. Multiple Sclerosis (MS) accounts for most cases of TDL [3,6]. TDL might be single or multiple and may appear simultaneously at onset or sequentially. When they present as single mass lesion they might be mistaken as brain tumors [1-3]. Clinical presentations vary from asymptomatic lesions to headache, cognitive abnormalities, mental confusion, impaired consciousness, aphasia, apraxia, cerebellar symptoms, visual field defects and/or seizures [1,2,4]. Usually there is not any history of similar episodes in the past and they may present as the first demyelinating event in the course of MS [4,7,8]. Magnetic Resonance Imaging (MRI) is a critical tool in the diagnosis of this entity, although the overlap in the imaging appearance of TDL with the imaging appearances of brain neoplasms, such as primary CNS lymphoma and high-grade glioma often leads to surgical biopsy [1,2,9,10]. In general, TDL responds well to steroids that have been shown to reduce the lesions size on follow-up imaging [6,11,12]. However, in many cases the diagnosis remains uncertain and therefore biopsy is indicated [9-12].
Case Report
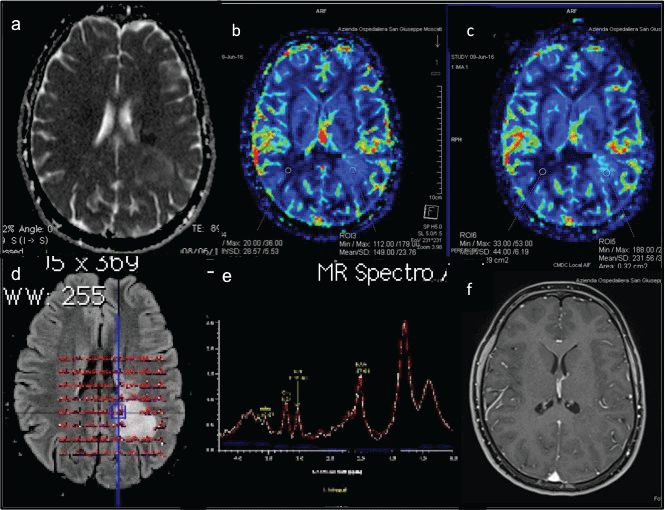
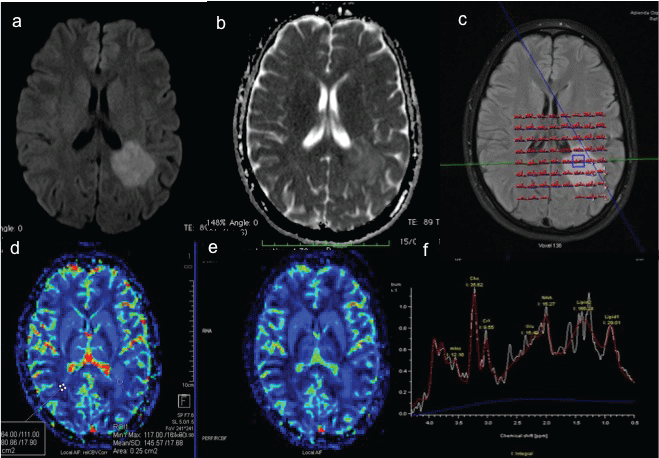
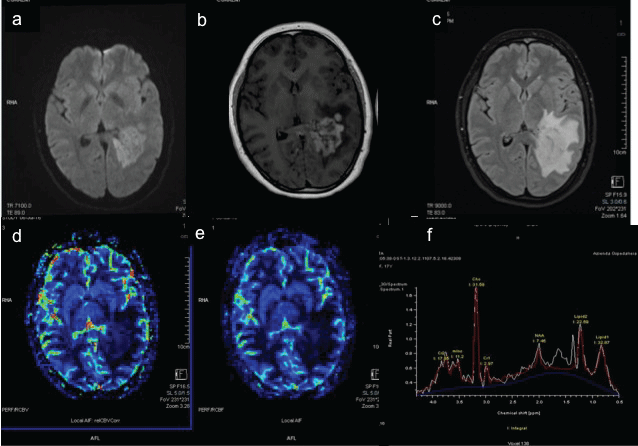
A 17-years-old Caucasian girl came to Emergency room of our Hospital for vertigo, aphasia and right leg weakness, referred from 5 days. The neurological examination revealed right brachio-crural hemiparesis (MRC2/5) reduction of right tendon reflexes and hypoanesthesia of right lower limb. She had no past medical history; she referred tetanus vaccine 3 months before. Brain Computed Tomography (CT) showed a large hypodense lesion, without mass effect, in left periventricular and paratrigonal zone. Immediately a brain MR was performed showing a left large periventricular and paratrigonal area of signal abnormality, hypointense on T1-weighted images, hyperintense on T2-weighted and Fluid-Attenuated Inversion Recovery (FLAIR) images, measuring 40 × 50 × 30 mm, with minimal perifocal edema and no mass effect. Diffusion Weighted Imaging (DWI) showed two areas of restricted diffusion within the lesion. Post-contrast administration no enhancement was seen; only on a much delayed scan (after 15 minutes of contrast administration) a faint enhancement was appreciated. Dynamic Susceptibility Contrast (DSC) Perfusion Weight Imaging (PWI) showed increased Relative Cerebral Blood Volume (rCBV) and Relative Cerebral Blood Flow (rCBF) and reduction of Mean Transit Time (MTT). Proton Multivoxel Magnetic Spectroscopy (PMRS) showed increase GLN/Cr, GSH/Cr, a peak of Lactate, reduction of mI/Cr (Figure 1). Following the suspect of a demyelinating lesion the study was extended to the spine revealing a small, peripheral non-enhancing, medullary lesion at D5 level. Based on these imaging features, a diagnosis of TDL was done. Low grade glioma was given as a less probable differential diagnosis. Screen for AQP4-IG, GAD-SSA-SSB, NMDA MOG-IG, anti‐nuclear antibodies, anti‐neutrophil cytoplasmic antibodies, anti‐cardiolipin antibodies, angiotensin converting enzyme, lysozyme and C‐reactive protein yielded negative results or normal values. An infection screen, including human immunodeficiency virus, treponemal and borrelia serology tests yielded negative results or results within the normal ranges. Cerebrospinal Fluid (CSF) was clear and showed normal biochemistry and cell counts. Fluorescence‐activated cell sorting analysis revealed no atypical cells. Oligoclonal bands were positive restricted to CSF. Somatosensory and visual evoked potentials were normal. Under the presumptive diagnosis of TDL treatment with methylprednisolone (1000 mg/day, intravenously) was started obtaining a prompt clinical response. After one week of therapy a follow-up MRI revealed a stable lesion dimension but a wide spread increased Apparent Diffusion Coefficient (ADC) values and the complete absence of enhancement (even after 1 hour from injection). PWI continued to show an increase of rCBV and rCBF but less high of previous examination. PMRS confirmed the increasing of Gln/Cr, GSH/Cr, Cho/Cr with the reduction of mI/Cr and NAA/Cr (Figure 2). The neurological examination improved (Brachio-crural hemiparesis MRC 4/5) and oral Prednisone therapy was continued (50 mg/day for two weeks, after 25 mg/day), but the MRI performed 3 weeks later showed an unexpected lesion's progression. In fact it increased in size, extending in the parietal and in the temporal lobe, with mass effect and midline shift. Also the perilesional edema was extended. Furthermore the lesion structure was changed with the appearance of necrotic components and intense and inhomogeneous enhancement. ADC values were high and PWI showed reduction of perfusion parameters (Figure 3). PMRS confirmed the spectral profile of previous examination. (All the results are reported in the Table 1). At this point the biopsy was necessary to made with certainly the diagnosis, because the neoplastic nature of the lesion could not be excluded. Histology showed demyelination, extensive macrophage invasion (CD68+), gliosis and necrosis. The patient is currently under interferon β1a (44 μg 3 times for week). The last follow up MRI showed no new lesions and the neurological examination is stable.
Discussion
A TDL is defined on MRI by the presence of large sized brain mass (≥ 2.0 cm in diameter) with edema and mass effect. The lesions more commonly involve the supratentorial compartment, mainly white matter tracts, in a periventricular distribution [1,2,4]. When there are multiple periventricular white matter lesions involving the major white matter tracts, such as corpus callosum and/or brachium pontis, associated to the presence of spinal cord lesions, the diagnosis of MS is straightforward [13]. However a solitary, inhomogeneous lesion can pose a considerable diagnostic challenge. Moreover the use of a contrast agent is of limited benefit because any pathologic process associated with disruption of the blood-brain barrier can result in enhancement on MRI [14,15]. Thus, advanced MRI techniques, such as DWI, PWI, PMRS may improve the characterization of solitary brain lesions [11,12]. In this study, we have observed and analyzed the evolution of a TDL, under corticosteroid therapy, with conventional and advanced MRI techniques. In our case the initial MRI showed two areas of restricted diffusion, with decreased ADC in the left paratrigonal and periventricular areas, without the classical peripheral distribution. Several recent case studies have reported reduced ADC values in acute demyelinating lesions and have emphasized their stroke-like ADC appearance [15-18]. Thus, in the early phase, those findings may reflect pathophysiological mechanisms, such as cytotoxic edema or localized hypercellularity and this is in keeping with the DWI lesion behavior during the follow up. In fact, afterwards, we saw a progressive increasing in ADC values, probably as a consequence of steroid therapy, inducing inflammation decrease and the transition from the acute to the sub acute phase. The ADC evolution reflected pathologic substrates like inflammatory vasogenic edema, assonal loss, and demyelination. The steroid induced pathophysiological changes may be the key to understand the perfusion parameters behavior too. In fact in the first study we found increased rCBV and rCBF ratios probably because of the vasodilatation of the inflammatory very acute phase [12,15]. At this stage the lesion was non-enhancing, since no blood brain barrier damage had occurred, while the faint enhancement found in a very delayed phase is most likely a venous engorgement [18].
Previous studies [11,13,19] reported that PWI might help in differential diagnosis of brain tumor and TDL because the latter usually displays lower rCBV values. This didn't happen in our case as we observed high rCBV and rCBF values on the first examination (probably because of the high inflammatory activity). These parameters gradually decreased, raising the normality, during the following weeks and this trend is not expected in a glioma just under steroid therapy, while can be explained in an inflammatory setting [13,19].
An acute giant demyelinating plaque could mimic a glioma on PMRS too. In fact acute demyelinating plaque may show elevated Cho and decreased NAA signal [20-22]. However the cell breakdown of both glial and neural elements occurring in a demyelinating plaque, leads to high concentration of glutamate and glutamine, which are not seen in gliomas [20,22]. In our case we observed this feature. Recently few works [23,24] have underlined the role of Glutathione (GSH) as an important indicator of oxidative status in human brain and oxidative stress has been strongly suggested to play an important role in the early, active phase of MS. The trend of GSH values in TDL has not been yet studied however in our case we found an increase of GSH/Cr ratio compared to the normal appearing white matter and this ratio further increased in the follow up studies.
In our case the restriction of oligoclonal bands to CSF and the presence of a small, peripheralspinal lesion addressed more for MS-like demyelinating process. In Neuromyelitis Optica (NMO) spinal lesions are more often extensive than those of MS, they often have central cord involvement and optic nerve lesions have a tendency to be more extensive in length. In our case optic nerve sheaths did not show any impairment [5]. Although the lack of prompt response to the corticosteroid therapy could not exclude atypical demyelinating syndromes as NMOSD, these entities are usually positive for a serum marker against aquoporina 4 (AQP4-IgG) and are less likely to have CSF-restricted oligoclonal bands [5,25]. Important autoantigen are also antibodies against Myelin Oligodendrocyte Glycoprotein (MOG-IgG) that are produced by the oligodendrocytes and are recognized in atypical demyelanitaning lesions as in NMSOD and ADEM and a in a selective subgroup of adult type II MS (antibody-mediated demyelination) [5,25]. Other autoantigens are anti-N-methyl-d-aspartate Receptor (anti-NMDA-R) autoantibodies, that are seen in autoimmune anti-NMDA-R encephalitis [5,26] Very few patients with anti-NMDA-R encephalitis can have concurrent, or later develop of TDL [5]. All of these autoantibodies were absent in our patient. Not all patient with TDL require stereotactic brain biopsy [27]. Despite the positive analysis of CSF for oligococlonal band (positive in up to 30% of cases of TDL in MS), the absence of multiple lesions on MRI at the time of the biopsy (present in up to 70% of patients with MS) and the suspicion of a coexistent tumour [12], clinicians decided, in a prudential way, to perform a stereotactic biopsy. It has been reported that lymphoma and malignant neoplasm can be inside the TDL and also can coexist [5,9,12,27]. Fluoro-Deoxyglucose Positron Emission Tomography (FDG- PET) scan might be useful in the investigation of TDL [27], however in our case considered the young patient's age we decided to not perform this kind of study.
The hystopathological examination revealed absence of Creutzfeldt-Peters cells. These cells are a frequent but not universal pathologic finding in active MS lesions and they were absent in NMO/NMOSD biopsies [5,28]. Creutzfeldt-Peters cells in MS may reflect astrocyte proliferation, whereas their absence in NMO may reflect astrocyte death or compromise [28].
In our case the presence of a brain enhancing lesion with a small un-enhancing spinal lesion, addressed the diagnosis more for a Clinically Isolated Syndrome (CIS) and it can be the first manifestation of MS. Treatment recommendations advise that patients should be treated as early as possible after a First Clinical Demyelinating Event (FCDE). It has been reported that in this case early treatment with interferon β could reduce the risk of developing MS and has beneficial effects in patients [29].
The pathogenesis of TDL may be associated with infections or vaccination [2,4]. In the study of Qui, et al. [2] was reported one case of TDL associated with history of hepatitis B vaccination. In our report the history of tetanus vaccination might be correlated to TDL although there is a lack of previous reports supporting this hypothesis. Previous vaccinations are more reported in ADEM. ADEM is an acute multifocal monophasic inflammatory demyelinating disorder of the brain and spinal cord, which should not progress beyond 3 months [4]. In the present case we excluded this entity from the differential diagnosis because the characteristic MRI features of ADEM include multifocal and diffuse hyperintense lesions, in the gray and white matter of the brain and spinal cord, on T2-weighted and FLAIR images and no gadolinium enhancement [4,30,31].
Conclusion
Currently there is not a single and absolute parameter or threshold that might define the diagnosis. Advanced MRI can be considered a valuable tool for defining pseudotumoral lesions' finding. In this case the presence of glutamate and also of gluthatione addressed the diagnosis more for a demyelinating process than for tumoral lesion. Nevertheless recent reports underline the needs for prudent interpretation of spectroscopic finding [12,20] because they may not allow a sure differentiation of TDL from brain tumors. So in a single case the synthesis of conventional and advanced MRI studies together with the careful evaluation of follow up variations should be considered in order to suggest the most likely diagnosis. A systematic study of TDL, with advanced MRI techniques, is necessary, to standardize their behavior in order to reduce the necessity of brain biopsy.
Financial Disclosures
The authors have no conflicts of interest to disclose. Informed consent from the person who is the subject of this case report was obtained.
References
- Lucchinetti CF, Gavrilova RH, Metz I, et al. (2008) Clinical and radiographic spectrucm of pathologically confirmed tumefactive multiplesclerosis. Brain 131: 1759-1775.
- Qi W, Jia GE, Wang X, et al. (2015) Cerebral tumefactive demyelinating Lesions. Oncol lett 10: 1763-1768.
- Renard D, Castelnovo G, Le Floch A, et al. (2016) Pseudotumoral brain lesions: MRI review. Act Neurol Belg 1-10.
- Hamed Sherifa A (2015) Variant of multiple sclerosis with dementia and tumefactive demyelinating brain lesions. World J Clin Cases 3: 525-532.
- Hardy TA, Reddel SW, Barnett MH, et al. (2016) Atypical inflammatory demyelinating syndromes of the CNS. Lancet Neurol 15: 967-981.
- Fallah A, Banglawala S, Ebrahim S, et al. (2010) Tumefactive demyelinating lesions: a diagnostic challenge. Can J Surg 53: 69-70.
- Bhargava A, Pujar GS, Banakar BF, et al. (2015) Recurrent tumefactive demyelination: An unusual presentation. J Pediatr Neurosci 10: 55-57.
- Jeong IH, Kim SH, Hyun JW, et al. (2015) Tumefactive demyelinating lesions as a first clinical event: Clinical, imaging, and follow-up observations. J Neurol Sci 358: 118-124.
- Yamada S, Yamada SM, Nakaguchi H, et al. (2012) Tumefactive multiple sclerosis requiring emergent biopsy and histological investigation to confirm the diagnosis: a case report. J Med Case Rep 6: 104.
- Geroge T, Cicilet S, Hoisal R, et al. (2016) Multifocal tumefactive demyelination mimicking intracranial neoplasm. J Clin Diagn Res 10: 10-11.
- Kilic AK, Kurne AT, Oguz KK, et al. (2013) Mass lesions in the brain: tumor or multiple sclerosis? Clinical and imaging characteristics and course from a single reference center. Turk Neurosurg 23: 728-735.
- Conforti R, Capasso R, Galasso R, et al. (2016) A challenging diagnosis of late-onset tumefactive multiple sclerosis associated to cervicodorsal syringomyelia: doubtful CT, MRI, and bioptic findings: Case report and literature review. Medicine (Baltimore) 95: e4585.
- Cha S, Pierce S, Knopp EA, et al. (2001) Dynamic contrast-enhanced T2-weighted MR imaging of tumefactive demyelinating lesions. AJNR Am J Neuroradiol 22: 1109-1116.
- Ferré JC, Shiroishi MS, Law M (2012) Advanced techniques using contrast media in neuroimaging. Magn Reson Imaging Clin N Am 20: 699-713.
- Przeklasa-Auth M, Ovbiagele B, Yim C, et al. (2010) Multiple sclerosis with initial stroke-like clinico radiologic features: case report and literature review. J Chil Neurol 25: 732-737.
- Hannoun S, Roch JA, Durand-Dubief F, et al. (2015) Weekly multimodal MRI follow‐up of two multiple sclerosis active lesions presenting a transient decrease in ADC. Brain Behav 5: e00307.
- Lo CP, Kao HW, Chen SY, et al. (2014) Comparison of diffusion-weighted imaging and contrast-enhanced T1-weighted imaging on a single baseline MRI for demonstrating dissemination in time in multiple sclerosis. BMC Neurol 14: 100.
- Eisele P, Szabo K, Griebe M, et al. (2012) Reduced diffusion in a subset of acute MS lesions: a serial multiparametric MRI study. AJNR Am J Neuroradiol 33: 1369-1373.
- Tsui EY, Leung WH, Chan JH, et al. (2002) Tumefactive demyelinating lesions by combined perfusion-weighted and diffusion weighted imaging. Comput Med Imaging Graph 26: 343-346.
- Cianfoni A, Niku S, Imbesi SG (2007) Metabolite findings in tumefactive demyelinating lesions utilizing short echo time proton magnetic resonance spectroscopy. AJNR Am J Neuroradiol 28: 272-277.
- Hourani R, Brant LJ, Rizk T, et al. (2008) Can proton MR spectroscopic and perfusion imaging differentiate between neoplastic and non neoplastic brain lesions in adults? AJNR Am J Neuroradiol 29: 366-372.
- Malhotra HS, Jain KK, Agarwal A, et al. (2009) Characterization of tumefactive demyelinating lesions using MR imaging and in-vivo proton MR spectroscopy. Mult Scler 15: 193-203.
- Srinivasan R, Ratiney H, Hammond-Rosenbluth KE, et al. (2010) MR spectroscopic imaging of glutathione in the white and gray matter at 7 T with an application to multiple sclerosis. Magn Reson Imaging 28: 163-170.
- Carvalho AN, Lim JL, Nijland PG, et al. (2014) Glutathione in multiple sclerosis: More than just an antioxidant? Mult Scler 20: 1425-1431.
- Abdullah S, Wong WF, Tan CT (2017) The Prevalence of Anti-Aquaporin 4 Antibody in Patients with Idiopathic Inflammatory Demyelinating Diseases Presented to a Tertiary Hospital in Malaysia: Presentation and Prognosis. Mult Scler Int 2017: 1359761.
- Qin K, Wu W, Huang Y, et al. (2017) Anti-N-methyl-D-aspartate receptor (NMDAR) antibody encephalitis presents in atypical types and coexists with neuromyelitis optica spectrum disorder or neurosyphilis. BMC Neurol 17: 1.
- Hardy TA, Chataway J (2013) Tumefactive demyelination: an approach to diagnosis and management. J Neurol Neurosurg Psychiatry 84: 1047-1053.
- Popescu BF, Guo Y, Jentoft ME, et al. (2015) Diagnostic utility of aquaporin-4 in the analysis of active demyelinating lesions. Neurology 84: 148-158.
- Comi G, Stefano ND, Freedman MS, et al. (2017) Subcutaneous interferon B-1a in the treatment of clinically isolated syndromes: 3 year and 5 year results of the phase III dosing frequency-blind multicentre reflexion study. J Neurol Neurosurg Psych 88: 285-294.
- Peche SS, Alshekhlee A, Kelly J, et al. (2013) A long-term follow-up study using IPMSSG criteria in children with CNS demyelination. Pediatr Neurol 49: 329-334.
- Jan-Mendelt T, Pirko I (2013) Neuroradiological evaluation of demyelinating disease. Ther Adv Neurol Disord 6: 249-268.
Corresponding Author
Marta De Simone, MD, Neuroradiology Unit, Department of Radiology, Hospital "San Giuseppe Moscati" Avellino, Cda Amoretta, 83100 Avellino, Italy, Tel: 0039-320-8470273, Fax: 0039-0825-203233.
Copyright
© 2017 De Simone M, et al. This is an open-access article distributed under the terms of the Creative Commons Attribution License, which permits unrestricted use, distribution, and reproduction in any medium, provided the original author and source are credited.


