Cognitive Behavioral Tests May Predict Eye Affection in High-Fat Diet Induced Pre-Obese Mice: Implications for Diabetic Retinopathy
Abstract
Background
Indicators of progression to diabetic retinopathy (DR) are needed in type 2 diabetes mellitus (T2DM) obese patients. We assessed the predictive power of cognitive function indicators for eye involvement in high fat diet (HFD)-induced pre-obese mice.
Methods
Male and female Swiss mice (N = 32) were fed HFD for 7 weeks, then submitted to a behavioral test battery assessing the visual memory and cognitive functions including novel object recognition test (NORT), open field test (OFT), and holeboard test (HBT). Following external eye and corneal examinations, animals were sacrificed. Histopathological studies were performed and immunohistochemical expressions of cell death markers Fas and caspase 3 were assessed in the retina.
Results
Eye affections were present in most HFD-fed mice (7/10 males and 9/10 females), and more severe in females. HFD-fed animals displayed significant changes in OFT and HBT cognitive indicators, and increased latency-to-exploration of novel objects differing in shape or in color in the NORT. Combined with fasting glycemia, NORT and OFT indicators predicted the marked decrease in eye aperture (R2 = 0.76, P < 0.01) and increase in retinal thickness (R2 = 0.79, P < 0.001) observed in HFD-fed mice.
Conclusions
Our findings suggest that changes in cognitive indicators may be useful for the prediction of eye involvement in HFD-induced pre-obese mice. They also suggest that eye affections start early in metabolic syndrome-associated diseases and are not mere complications.
Keywords
Diet-induced obesity, Type 2 diabetes mellitus, Retina, Mouse, Behavioral tests
Highlights
1. Eye affections start as early as pre-obese stages in mice.
2. Cognitive function indicators and blood glucose level predict eye affections.
3. Eye affections are more severe in females.
Introduction
Obesity-related type 2 diabetes mellitus (T2DM) is associated with a metabolic syndrome encompassing hyperglycemia and other detrimental systemic changes resulting in severe microvascular complications like diabetic retinopathy (DR) [1,2]. DR has two major stages: (i) Non-Proliferative DR (NPDR) that is associated with blood vessel malfunction resulting in edema and ischemia in the retina; and (ii) Proliferative DR (PDR) where an aberrant neovascularization is observed in the retina, leading to retinal detachment and vision loss [2,3]. DR is a leading cause of vision loss worldwide [4,5]. Poor blood pressure and glycemic control, systemic glucose intolerance, and diabetes duration are considered the major drivers of DR in T2DM context [6,7]. Early detection remains the best approach for effective treatment of DR and for morbidity reduction [4,8]. Considering that systematic screening is challenging and unpractical, biomarkers and indicators of DR development in T2DM patients and obese individuals are necessary for detecting people at risk. Such tools will allow dedicating resources and efforts for early detection like regular vision examination only on people at risk, reducing the high short-term and long-term costs to the health system and to the society.
Recent studies in people with T2DM-like metabolic syndrome provided evidence for associations between risk for developing DR and sex [9], genetic factors [10], mean platelet volume [11], changes in cardiac rhythm [12], cardiovascular disease [13], mild to moderate chronic kidney disease [14], and periodontal disease [15]. However, controversy remains on the validity of these indicators and markers. For instance, strikingly, a study using retinal images in T2DM patients suggested that higher body mass index (BMI), a common risk factor for most systemic diseases, may be associated with less severe DR, particularly in women [16]. Thus, more accurate and less expensive indicators and biomarkers are needed in the field considering the implications for diabetic patients' visual ability and given the ongoing global cost crisis in health care.
Studies in high-fat diet (HFD)-induced model of central obesity and T2DM revealed deficits in retinal light responses and electroretinogram associated with retinal neurogliosis after 3-months of HFD feeding [17-20]. These obese animals were pre-diabetic, given that in this model T2DM is observed after at least 12 weeks of feeding [21-23]. Not surprisingly, they did not display a drastically high fasting glycemia or even chronic disease [17-19]. Thus, retinal affections may start before the progression to T2DM-like disease in HFD-induced obese animals. We assessed the impact of HFD-induced pre-obesity on visual ability and memory, and sexes considering the implications for early detection of DR-like affections of the visual system.
Methods
Animals
Six-month-old (young adult) male (N = 16, 28.6 ± 3.9 g) and female (N = 16, 27.4 ± 2.9 g) Swiss mice were obtained from the animal facility of the College of Pharmacy, Qassim University. They were divided in two experimental groups per sex, and group-housed (N = 3). The first group was fed a solid-liquid palatable and obesogenic high-fat diet including ~4.5 kcal/g solid food (4% corn oil, 18% animal lard, 10% simple sugars, 28% polysaccharide, 23% protein [w/w]) supplemented with ~4 kcal/g sweetened condensed milk (8% fat, 55% simple sugar, and 8% protein [w/w], Nestle Middle East) [24,25]. The second group (N = 6) was fed mouse standard diet (chow) (~3.5 kcal/g, with 3% fat, 7% simple sugars, 50% polysaccharide, and 15% protein [w/w]. All animals had ad libitum access to tap water and were maintained under 12 h-12 h light-dark cycle (-23.4 ℃ room temperature).
All procedures were approved by the institutional review board (grant 2015/3233) and were performed in accordance with European Union directive 2010/63/EU of the European Parliament and of the Council of 22 September 2010 on the protection of animals used for scientific purposes.
Experimental procedures
Body weight and blood glucose level were monitored throughout the study. Blood glucose level was determined from tail vein blood, using a glucometer. Experimental groups were fed their respective diets throughout the study. All groups were submitted to a 5-day behavioral test battery when all HFD-fed animals reached 30% increase in body weight (this occurred after 6 weeks of feeding). The behavioral test battery included: (i) A modified version of the novel object recognition test (NORT), an established test validated for visual function and object memory assessment (object location, color, shape); and (ii) Two standard ethological tests commonly used for the assessment of cognitive functions in laboratory rodents, namely the open field test (OFT) and the hole board test (HBT).
At the end of the test battery in feeding week 7, fasting glycemia was determined in animals fasted for 12-h (from lights on). Two days after, external eye examination and corneal assessment were performed. Then, animals were sacrificed under deep gas anesthesia and both eyes were dissected out. Retinas were processed for histopathological studies aimed at assessing typical DR-like changes, and immunohistochemistry were performed to assess the expressions of apoptosis marker caspase 3 and of inflammation-mediated cell death marker Fas.
Behavioral test battery
Novel Object Recognition Test (NORT)
NORT is based on rodent natural tendency to explore novel objects. The test is typically performed with two phases [26,27].
Phase 1 (training day)
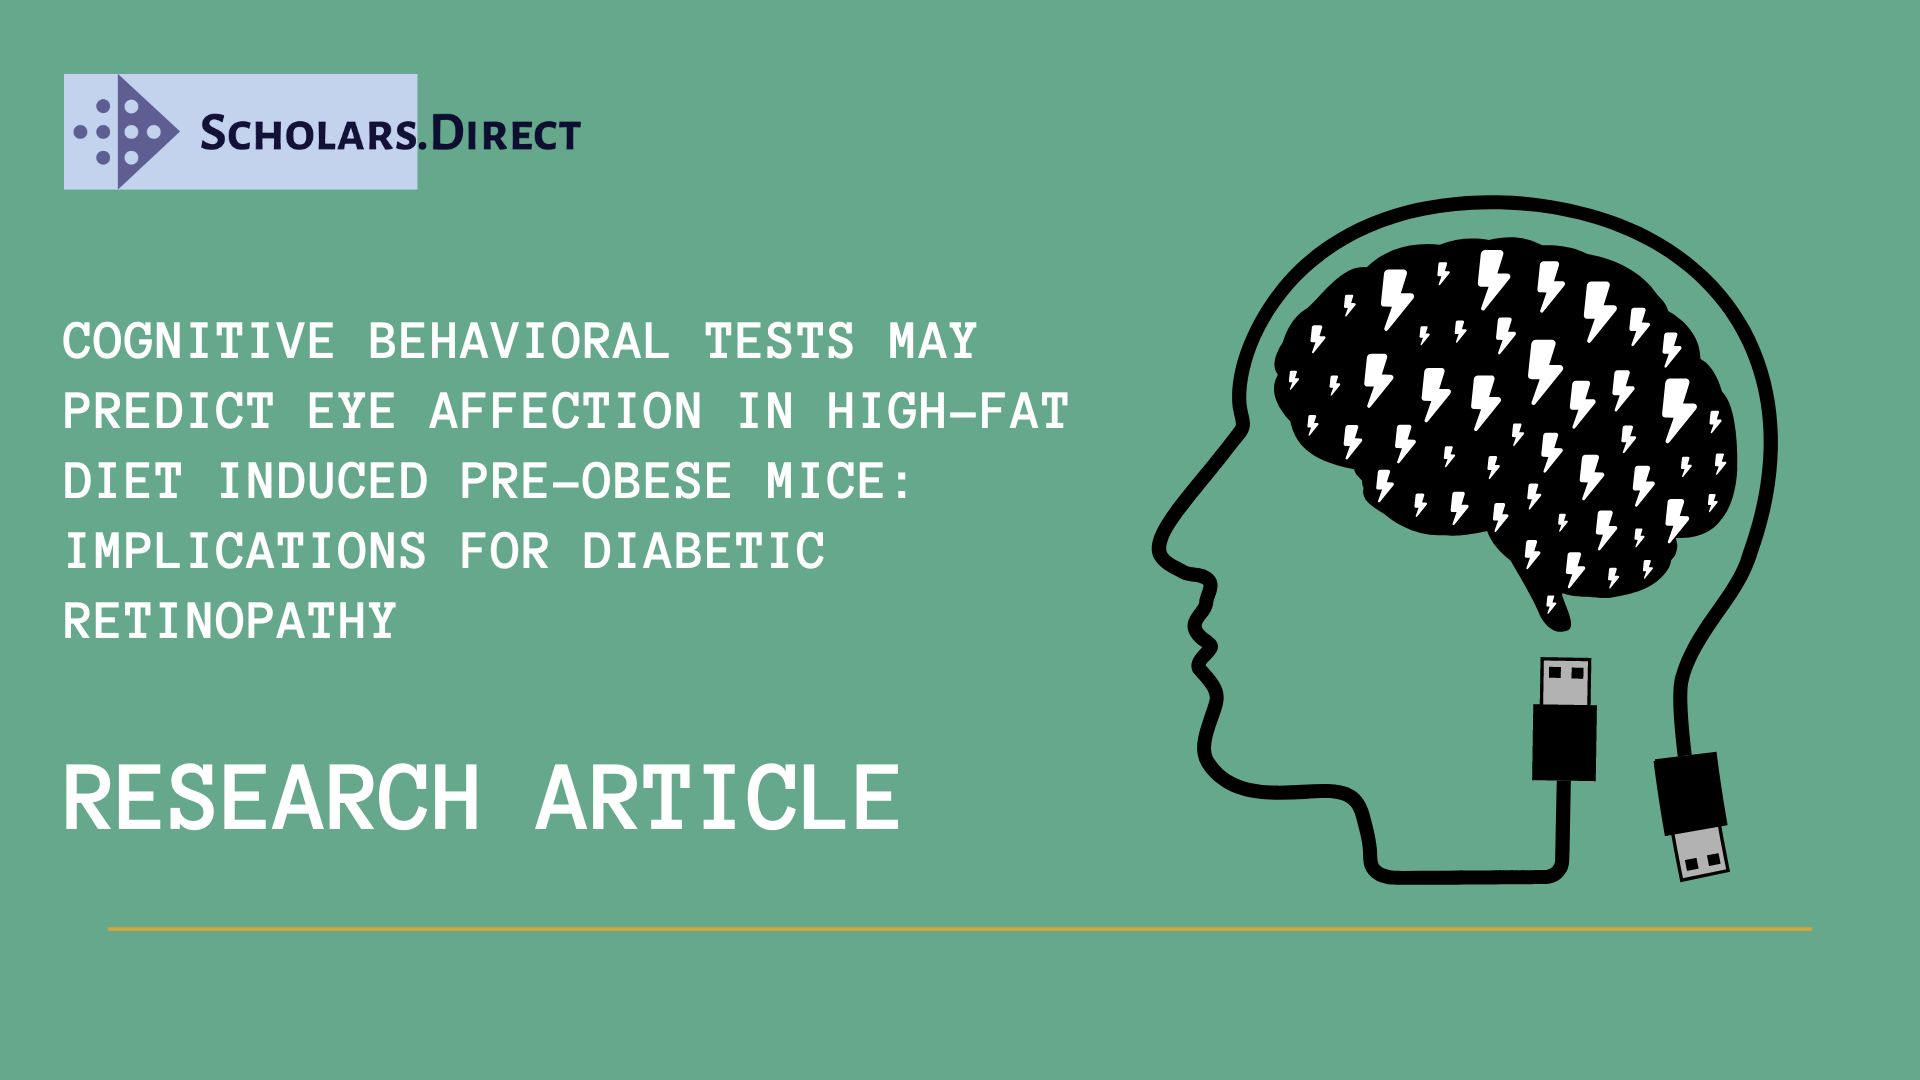
Animals were introduced to an open field arena with a video recording system, and allowed 10 min of free exploration. Afterwards two objects differing in shape were introduced in the arena: Object 1 closer to the animal and object 2 farther (Figure 1A). Following 10 min of object exploration, animals were returned to their cages. The second phase was performed 24-h later.
Phase 2 (test day)
Animals were introduced to the same arena, where two objects were placed in the same location as the day before: One familiar object (object 1) and a novel object with a different color (object 3) or shape (object 4) (Figure 1A). After 5 min of exploration, the test was ended. After each trial, the objects and the floor and walls of the arena are cleaned with 70% alcohol solution. Object exploration time and latencies to exploration of the closer and farther objects in the training day and of the novel object (differing in shape and color) in the test day, as well as the exploration times were determined from video recordings.
Open Field Test (OFT)
The OFT was used to assess the major components of the exploratory behavior in mice. The open field arena was a 40.6 cm × 40.6 cm × 38.1 cm transparent Plexiglas box whose floor (40.6 cm × 40.6 cm) was divided in a 20.2 cm × 20.2 cm central zone and a peripheral zone (area between the central zone and the walls). Standard procedures for testing were used. Briefly, at the start of the test a mouse was placed facing the wall in an angle of the arena and the activity of the animal was recorded for 10 min using a camera mounted on side. The camera was fixed at 50 cm from the floor and with an angle allowing good simultaneous capture of both vertical and horizontal activities. After each trial, the floor and walls of the arena were cleaned with 70% alcohol solution.
The distance traveled in the arena and time spent in the central zone and angles were determined using motion tracking in image sequences in MATLAB software (Math Works, Natick, MA). Characteristics of episodes of rearing, rearing against wall, freezing (more than 3 s immobility with characteristic posture), freezing, and grooming were scored from video recordings.
Holeboard Test (HBT)
The HBT uses rodent aversion for brightly lighted novel environments with tendency to escape (manifested here as head dipping episodes) to detect cognitive alterations [28,29]. The hole board arena was a transparent Plexiglas box (40.6 cm × 40.6 cm × 60 cm) with 16 holes (2.5 cm in diameter) equidistant from the wall and from one another, cut into the floor. Testing was performed under bright white lighting produced by fluorescent lamps (~500 lux vs. ~300 - 400 lux at home cage floor). The test was started by placing a mouse in a corner of the arena, facing the wall. Animal vertical and horizontal activities were video recorded for 10 min, using a computerized digital camera placed above the arena (with ~45-degree angle). Then, animals were returned to their home cages. After each trial, the floor and walls of the arena were cleaned with 70% alcohol solution. The latency to the first head dipping and the number of head dipping episodes were determined from video recordings.
Eye examination
External eye examination and corneal assessments were performed on both eyes. Signs of metabolic syndrome-induced severe eye affection were assessed during external examination of eyes, including the aperture and general aspect of the eye, the presence of ocular reflexes (mainly pupillary reflexes), the occurrence of discharges. Standard corneal examination was performed with a hand-held slit lamp biomicroscope by the Department of Optometry, Qassim University. Findings were confirmed with a good Transilluminator light source and a 20D magnifying lens.
Tissue processing, H&E and immunohistochemistry
Histopathological studies
Entire eyes were dissected out, post-fixed for 2-h, embedded in paraffin, and cut in the sagittal plane (thickness 5 µm). Sections were mounted in different slides to have a 20 µm distance between adjacent sections (4 slides simultaneously). A series of sections was processed for H&E staining using standard protocol. Histopathological analyses assessing signs of tissue damage and cell affections in the retina were performed using a computerized light microscope, under 20x, 40x, and 120x objectives. Retinal thickness was determined on 6 to 10 mid-eye sections.
Immunohistochemistry
Two other series of sections were processed for immunohistochemical labeling of inflammation-related cell death marker Fas and marker of apoptosis caspase-3, according to the instructions of the kit manufacturer (ABCAM, Cambridge, UK). Briefly, after deparaffinizing in xylene and rehydration, sections were incubated in 10% H2O2 to extinguish endogenous peroxidase activity, and Tris-EDTA buffer (1 mM EDTA solution, 10 mM Tris base, and 0.05% Tween 20 in distilled water, pH 9) was used for heat-induced antigen retrieval. Sections were incubated overnight in either goat anti-caspase 3 or goat anti-Fas antibody solution (1:100 in Tris-TBS buffer, Santa Cruz Biotechnology, CA), then in HRP-conjugated secondary antibody solution for 2-h. After incubation in 3,3′-diaminobenzidine hydrochloride (DAB) chromogen, sections were counterstained with hematoxylin, dehydrated in ethanol series, cleared in xylene, and mounted with glass cover slips. All rinsing steps were performed with Tris-TBS buffer (0.1% Tween 20 in Tris-buffered saline, pH = 7.6). Fas and caspase-3 expressions were observed under objectives 20x, 40x, and 120x of a light microscope.
Data analysis
Inter-group (sex, diet) differences in body weight, fasting glycemia, opened eye surface area, retinal thickness, and behavioral test parameters were assessed using Kruskal-Wallis ANOVA followed by Mann-Whitney U-test for inter couple comparisons (Origin Pro 8 software, Origin Lab Co, Northampton, MA). Differences with P < 0.05 were considered significant. Data were presented as mean ± SEM. Correlation was assessed between changes in body weight or fasting glycemia and eye aperture and retinal thickness. The potential of the body weight, fasting glycemia, and behavioral test parameters for the prediction of changes in opened eye aperture and retinal thickness was assessed using linear regression.
Results
Clinicopathological observations
Body weight and blood glucose level
HFD approximated daily intake was 33% simple sugars, 16% fat, and 15% protein. From 6 weeks onward, significant increases in body weight (34.7%, P < 0.01 in males, and 48.8%, P < 0.001 in females) (Figure 1B) and fasting glycemia (82.1%, P < 0.01 in males, and 49.8%, P < 0.001 in females) (Figure 1C) were observed. Females gained weight faster than males (Figure 1B), despite a slower increase in blood glucose level (Figure 1C).
External eye and corneal observations
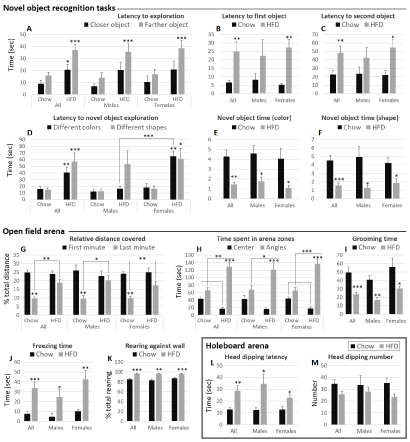
Eye examination confirmed the presence of pupillary reflexes in all animals in the present study (Table 1). Porphyrin discharges were present in 9/10 females, against 2/10 in males. Corneal opacity, inflammation, and ulcer were mainly found in females, while corneal edema and hemorrhage were more common in males (Table 1). Most animals presented with reduced eye aperture (70%) (Figures 1D, Figure 1E and Figure 1F) and watery eye (Table 1). Eye aperture was markedly decreased in both females and males (about two-fold), with less inter-individual variability in the first group (P < 0.001 and P < 0.05, respectively) (Figure 1F). Interestingly, ignoring the sex factor, inverse correlations were found between the opened eye surface area and both the increases in body weight (y = -6.1x + 59.9, r = - 0.54, p < 0.01) and in blood glucose level (y = -10x + 160.7, r = 0.63, p < 0.001) (Figure 1G). The correlation with the blood glucose level was stronger and blood glucose level grew faster with decreasing eye aperture (Figure 1G).
Visual memory and cognitive function evaluation
NORT
Latency to exploration of closer and farther objects
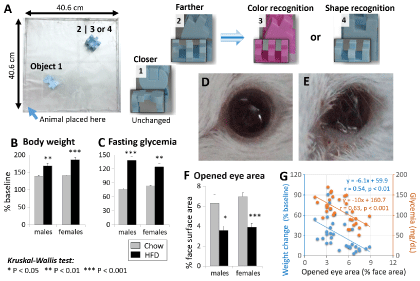
HFD-fed animals had a higher latency to exploration of closer (P < 0.05) and farther (P < 0.001) object than their chow-fed counterparts (Figure 2A). In sex groups, only the difference in exploration of farther object was statistically significant. This difference was higher in females (P < 0.001) than males (P < 0.05) (Figure 2A).
Latency to exploration of first and second objects
The latencies to first object (Figure 2B) and to second object (Figure 2C) exploration were increased in HFD-fed compared to chow-fed (P < 0.01). These increases were more marked in females (Figure 2B and Figure 2C).
Latency to novel object exploration
Increases in the latency to novel object exploration were observed for both novel objects of different color (P < 0.05) and different shape (P < 0.001) than the familiar object (Figure 2D). The change was more marked in HFD-females for both novel object types. Instead, HFD-males displayed comparable performances with their chow-fed counterparts for color recognition (Figure 2D).
Novel object time
The time spent exploring a novel object of different color (Figure 2E) and the time spent exploring a novel object of different shape (Figure 2F) than the familiar object were markedly decreased in HFD-fed male and female mice compared to chow-fed (P < 0.01 and P < 0.001, respectively).
OFT
Distance covered. The relative distance covered in the first minute in the arena was comparable between all experimental groups (Figure 2G). This relative distance covered was significantly decreased in the last minute spent in the arena in chow-fed animals, compared to their performance in the first minute (P < 0.01). This difference in performance between first and last minutes was not observed in HFD-fed male and female animals, which covered a significantly higher distance in the last minute (P < 0.05 males, P < 0.01 females) (Figure 2G).
Time in arena zones
HFD-fed male and female animals displayed increases (respectively, decreases) in the time spent in the arena angles (respectively, central zone) compared to chow-fed animals (P < 0.05 males, P < 0.001 females) (Figure 2H). Differences between the time spent in the central zone and the time spent in the angles of the arena were significant in HFD-fed but not chow-fed animals (Figure 2H).
Grooming and freezing episodes' time
HFD-fed mice spent a significantly lower time grooming than chow-fed animals (P < 0.001) (Figure 2I), and significantly more time in freezing behavior (P < 0.001) (Figure 2J).
Rearing against wall
The relative number of episodes of rearing against wall was increased in all HFD-fed groups compared to chow-fed (P < 0.01 males, P < 0.001 females) (Figure 2K).
HBT
HFD-fed animals displayed a significant increase in the latency to the first head dipping episode (P < 0.01) (Figure 2L). Male animals had a higher inter individual variability than females (Figure 2L). On the other hand, HFD-fed mice displayed decreases in head dipping episode number that were not statistically significant in the present study (Figure 2M).
Retinal tissue studies
Histopathological observations
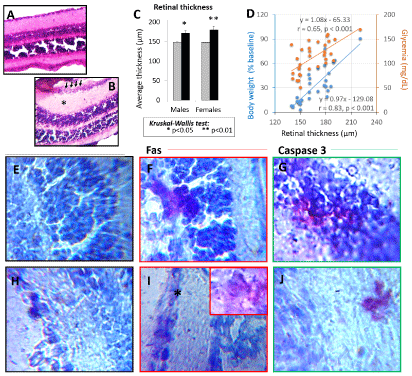
Figure 2A and Figure 2B show representative cases of animals fed chow (Figure 3A) and animals fed HFD (Figure 3B). The most common histopathological changes observed in HFD fed animals were (Figure 3A and Figure 3B): (i) Swelling, mainly in the inner plexiform layer; (iii) Thickening of the retina as consequence of swelling; (ii) Ganglion cell loss; and (iii) In few animals, infiltrating cells. Retinal thickness measurement confirmed these observations as significant increases were found in HFD-fed females (P < 0.001) (and in a lesser extent males, P < 0.05) (Figure 3C).
Positive linear correlations were found between the retinal thickness and both the increase in body weight (y = 0.97x - 129.08, r = 0.83, p < 0.001) and the increase in blood glucose level (y = 1.08x - 65.33, r = 0.65, p < 0.001) (Figure 3D). The correlation with the body weight was stronger, while the blood glucose level grew slightly faster with increasing retinal thickness (Figure 3D).
Fas and caspase 3 retinal expressions
Figure 3E, Figure 3F, Figure 3G, Figure 3H, Figure 3I, Figure 3J show: (i) A representative case of chow-fed animals, where no immunoreactivity to Fas and caspase 3 were observed in the outer nuclear layer (Figure 3E) and in the ganglion cell layers (Figure 3H); and (ii) A female representative case of affected HFD-fed mice with Fas expression in the outer nuclear layer (Figure 3F) and ganglion cell layer (Figure 3I), as well as caspase 3 expression in the outer nuclear layer (Figure 3G) and in the photoreceptor inner segment (Figure 3J). Most HFD-fed mice (particularly females) displayed sparse expressions of caspase 3, while Fas was expressed all over the ganglion cell layer. No chow-fed mouse expressed these cell death markers.
Regression analysis
As shown in (Tables 2 and Table 3), behavioral and physiological parameters predicted the occurrence of marked decrease in eye aperture and significant increase in retinal thickness (R2 = 0.76, P < 0.01 and R2 = 0.79, P < 0.001, respectively). The collective of predictive parameters common to these disease-related changes in eye aperture and in retinal thickness included: (i) The fasting glycemia; (ii) NORT parameters like the latency to novel object exploration, the novel-to-familiar object ratio; and (iii) OFT parameters like the relative number of episodes of rearing against wall, the time spent in freezing behavior, the arena central zone time, the time spent in the arena angles, the ratio of the central zone time to the time in the angles, and the relative distance covered in the last minute spent in the arena. In addition to these parameters, predictors of eye aperture decrease also included the body weight increase, the time spent grooming, and the total distance covered in the OFT. Instead, additional predictors of retinal thickness included latencies to closer and farther objects, and to the first object explored in the NORT. HBT parameters had a poor predictive power in this study (not shown).
Discussion
In the present study, changes in physiological factors and behavioral parameters predicted the occurrence of the eye affections assessed.
Cognitive function indicators revealed by the open field test (OFT) had a good predictive power for eye aperture decrease and retinal thickening. Notably, HFD-fed animals kept on exploring the open field arena intensely when their counterparts had already decreased the intensity of their exploration, indicating that habituation to the arena was slower in HFD-fed animals. Cognitive affections were suggested by depression indicators like decreases in grooming episodes, and anxiety indicators like increases in arena angle time, decreases in central zone time, and increases in freezing episode time commonly reported in induced-diabetes models [13,30-33]. Increased numbers of rearing against wall episodes in the OFT, as well as the higher latency to head dipping and decreases in the number of head dipping episodes in the hole board arena were also indicative of cognitive impairment. These findings suggest that changes in cognitive function indicators occur concomitantly with visual system components' affection and functional impairment in pre-obese mice, at least in HFD-induced model.
Besides, novel object recognition test (NORT)-based indicators of visual memory assessed had a good predictive power for retinal thickening and reduction in eye aperture as well. This was expected considering that visual function is determinant for NORT. Major changes in NORT parameters suggested visual impairment. Notably, considering that rodents are naturally driven to explore novel objects [26,27], increases in the latencies to novel objects' exploration in test days indicate that HFD-animals had to come closer to the objects during their exploration of the arena to see and then explore them. Similarly, the far more marked increases in farther object exploration compared to increases in closer object exploration in the training day in HFD-fed mice also indicate poor vision. Visual system affection in these pre-obese animals was also confirmed by corneal signs, histopathological observation of ganglion cell loss, and immunohistochemical signs like Fas and caspase 3 expressions.
Moreover, fasting glycemia had a stronger predictive power than body weight, although both parameters correlated well with decreases in eye aperture and increases in retinal thickness. This observation is not surprising considering that poor glycemic control is a well-established major driver of severe T2DM and DR in both patients and experimental models [2,3,6,7]. Hyperglycemia is a major component of the metabolic syndrome that mediates blood vessel leakage and the resulting fluid accumulation in organs leading to eyelid swelling, retinal thickening and damage in obese T2DM patients and DR experimental models [34-36].
HFD-fed females gained weight faster than males, although they displayed a slower increase in blood glucose level. This finding can be explained by the higher metabolic turn over in male animals due to sex differences in gonadal steroids and energy metabolism [37-39]. These factors probably contributed to sex disparities observed in the corneal signs found in the present study, namely more corneal opacity, inflammation, and ulcer in females, against more corneal edema and hemorrhage in males. Alarmingly, marked eye affections were present in almost all HFD-induced animals, suggesting that eye involvement may not be just a complication of metabolic syndrome-associated conditions as currently thought [1-3], but a pathological event starting early with metabolic disease and increasing in severity with disease progression and time, at least in mice. Other groups also reported the early occurrence of eye affections in HFD-induced obese models of T2DM [17-20].
Conclusions
The findings of the present study suggest that physiological parameters and behavioral indicators of cognitive impairment can be used as predictors of eye affections in metabolically challenged mice. Considering that most HFD-induced pre-obese mice displayed ganglion cell loss, retinal thickening, corneal signs, porphyrin deposits and other signs of eye affections in this study, it appears that eye involvement may start as early as obesity-related metabolic syndrome. Thus, although these findings need to be confirmed in humans, eye care should be included in routine management of obese individuals and T2DM patients. Future studies should assess the current findings in other T2DM models and in patients, considering the implications for the prevention of DR and subsequent vision loss.
Acknowledgements
This study was partly supported by Qassim University Research Deanship grant 2015/3233. The author thanks: (i) Qassim University College of Pharmacy for kindly providing the animals used in the study; (ii) Prof. Eltuhami Abdelmageed of Qassim University College of Medicine for his support in the histopathological studies; (iii) Drs. Uchenna Attowa and Ambrose Dibia of the Department of Optometry, CAMS, Qassim University for performing the corneal and external eye examinations; and (iv) Colleagues of Qassim University College of Applied Medical Sciences for proof-reading.
References
- Shih KC, Lam KS, Tong L (2017) A systematic review on the impact of diabetes mellitus on the ocular surface. Nutr Diabetes 7: e251.
- Schorr SG, Hammes HP, Muller UA, et al. (2016) The prevention and treatment of retinal complications in diabetes. Dtsch Arztebl Int 113: 816-823.
- Golubovic-Arsovska M (2006) Correlation of diabetic maculopathy and level of diabetic retinopathy. Prilozi 27: 139-150.
- Kollias AN, Ulbig MW (2010) Diabetic retinopathy: Early diagnosis and effective treatment. Dtsch Arztebl Int 107: 75-83.
- Liu E, Craig JE, Burdon K (2017) Diabetic macular oedema: Clinical risk factors and emerging genetic influences. Clin Exp Optom 100: 569-576.
- Yau JW, Rogers SL, Kawasaki R, et al. (2012) Global prevalence and major risk factors of diabetic retinopathy. Diabetes Care 35: 556-564.
- Wat N, Wong RL, Wong IY (2016) Associations between diabetic retinopathy and systemic risk factors. Hong Kong Med J 22: 589-599.
- Gardner TW, Sundstrom JM (2017) A proposal for early and personalized treatment of diabetic retinopathy based on clinical pathophysiology and molecular phenotyping. Vision Res 139: 153-160.
- Maric-Bilkan C (2017) Sex differences in micro- and macro-vascular complications of diabetes mellitus. Clin Sci (Lond) 131: 833-846.
- Chong YH, Fan Q, Tham YC, et al. (2017) Type 2 Diabetes genetic variants and risk of diabetic retinopathy. Ophthalmology 124: 336-342.
- Gungor AA, Gursoy G, Gungor F, et al. (2016) The relationship of mean platelet volume with retinopathy in type 2 diabetes mellitus. Turk J Med Sci 46: 1292-1299.
- Khandoker AH, Al-Angari HM, Khalaf K, et al. (2017) Association of diabetes related complications with heart rate variability among a diabetic population in the UAE. PLoS One 12: e0168584.
- Rebolledo-Solleiro D, Roldan-Roldan G, Diaz D, et al. (2017) Increased anxiety-like behavior is associated with the metabolic syndrome in non-stressed rats. PLoS One 12: e0176554.
- Chen CY, Dai CS, Lee CC, et al. (2017) Association between macular degeneration and mild to moderate chronic kidney disease: A nationwide population-based study. Medicine (Baltimore) 96: e6405.
- Song SJ, Lee SS, Han K, et al. (2017) Periodontitis is associated with diabetic retinopathy in non-obese adults. Endocrine 56: 82-89.
- Man RE, Sabanayagam C, Chiang PP, et al. (2016) Differential association of generalized and abdominal obesity with diabetic retinopathy in asian patients with Type 2 Diabetes. JAMA Ophthalmol 134: 251-257.
- Chang RC, Shi L, Huang CC, et al. (2015) High-Fat diet-induced retinal dysfunction. Invest Ophthalmol Vis Sci 56: 2367-2380.
- Rajagopal R, Bligard GW, Zhang S, et al. (2016) Functional deficits precede structural lesions in mice with high-fat diet-induced diabetic retinopathy. Diabetes 65: 1072-1084.
- Hammoum I, Mbarek S, Dellaa A, et al. (2017) Study of retinal alterations in a high fat diet-induced type ii diabetes rodent: Meriones shawi. Acta Histochem 119: 1-9.
- Chang LY, Lee AC, Sue W (2017) Prevalence of diabetic retinopathy at first presentation to the retinal screening service in the greater Wellington region of New Zealand 2006-2015, and implications for models of retinal screening. N Z Med J 130: 78-88.
- De Winther MP, Gijbels MJ, Van Dijk KW, et al. (2000) Transgenic mouse models to study the role of the macrophage scavenger receptor class A in atherosclerosis. Int J Tissue React 22: 85-91.
- Hirotani Y, Ozaki N, Tsuji Y, et al. (2015) Effects of eicosapentaenoic acid on hepatic dyslipidemia and oxidative stress in high fat diet-induced steatosis. Int J Food Sci Nutr 66: 569-573.
- Sun J, Qiao Y, Qi C, et al. (2016) High-fat-diet-induced obesity is associated with decreased antiinflammatory Lactobacillus reuteri sensitive to oxidative stress in mouse Peyer's patches. Nutrition 32: 265-272.
- Carter P, Achana F, Troughton J, et al. (2014) A Mediterranean diet improves HbA1c but not fasting blood glucose compared to alternative dietary strategies: A network meta-analysis. J Hum Nutr Diet 27: 280-297.
- Blackmore HL, Niu Y, Fernandez-Twinn DS, et al. (2014) Maternal diet-induced obesity programs cardiovascular dysfunction in adult male mouse offspring independent of current body weight. Endocrinology 155: 3970-3980.
- Bailey KR, Crawley JN (2009) Anxiety-Related Behaviors in Mice.
- Campos AC, Fogaca MV, Aguiar DC, et al. (2013) Animal models of anxiety disorders and stress. Rev Bras Psiquiatr 35: S101-S111.
- Adamec RE, Sayin U, Brown A (1991) The effects of corticotrophin releasing factor (CRF) and handling stress on behavior in the elevated plus-maze test of anxiety. J Psychopharmacol 5: 175-186.
- Brown GR, Nemes C (2008) The exploratory behaviour of rats in the hole-board apparatus: Is head-dipping a valid measure of neophilia? Behav Processes 78: 442-448.
- Seke Etet PF, Farahna M, Satti GMH, et al. (2017) Garcinia kola seeds may prevent cognitive and motor dysfunctions in a type 1 diabetes mellitus rat model by mitigating neuroinflammation. J Complement Integr Med 14.
- Santos CJ, Ferreira AV, Oliveira AL, et al. (2018) Carbohydrate-enriched diet predispose to anxiety and depression-like behavior after stress in mice. Nutr Neurosci 21: 33-39.
- Andre C, Dinel AL, Ferreira G, et al. (2014) Diet-induced obesity progressively alters cognition, anxiety-like behavior and lipopolysaccharide-induced depressive-like behavior: focus on brain indoleamine 2,3-dioxygenase activation. Brain Behav Immun 41: 10-21.
- Jia YF, Song NN, Mao RR, et al. (2014) Abnormal anxiety- and depression-like behaviors in mice lacking both central serotonergic neurons and pancreatic islet cells. Front Behav Neurosci 8: 325.
- Kang MK, Park SH, Kim YH, et al. (2016) Dietary compound chrysin inhibits retinal neovascularization with abnormal capillaries in db/db mice. Nutrients 8.
- Rajashekhar G, Ramadan A, Abburi C, et al. (2014) Regenerative therapeutic potential of adipose stromal cells in early stage diabetic retinopathy. PLoS One 9: e84671.
- Wisniewska-Kruk J, Klaassen I, Vogels IM, et al. (2014) Molecular analysis of blood-retinal barrier loss in the Akimba mouse, a model of advanced diabetic retinopathy. Exp Eye Res 122: 123-131.
- Schwartz JB (2003) The influence of sex on pharmacokinetics. Clin Pharmacokinet 42: 107-121.
- Chowen JA, Argente-Arizon P, Freire-Regatillo A, et al. (2017) Sex differences in the neuroendocrine control of metabolism and the implication of astrocytes. Front Neuroendocrinol 48: 3-12.
- Valencak TG, Osterrieder A, Schulz TJ (2017) Sex matters: The effects of biological sex on adipose tissue biology and energy metabolism. Redox Biol 12: 806-813.
Corresponding Author
Maurizio Santomauro, MD, FESC, FHRS, Department of Cardiovascular Emergency, Internal Medicine and Geriatric, School of Medicine, Federico II University, Via Sergio Pansini 5-80131, Naples, Italy.
Copyright
© 2019 Santomauro M, et al. This is an open-access article distributed under the terms of the Creative Commons Attribution License, which permits unrestricted use, distribution, and reproduction in any medium, provided the original author and source are credited.