Perceived Exertion is Lower in Running than Walking at the Same Heart Rate and Lactate Level
Abstract
The purpose of this study was to examine perceived effort at various intensities in human walking and running. Fifteen male subjects participated in this study. Two progressive protocols were randomized, starting at a treadmill speed of 3 Metabolic Equivalents (METs) to Measure Ratings of Perceived Exertion (RPE), Heart Rate (HR) and blood lactate concentration. From these data, RPE was estimated at an intensity corresponding to Fixed Heart Rate (FHR; 120, 130, 140, 150 bpm) and Fixed Blood Lactate Concentrations (FBLCs; 2 and 3 mM) from the individual regression line. RPE in running was significantly lower than in walking at FHRs of 120, 130, 140 and 150 bpm (p < 0.01 for all). For blood lactate, RPE in running was significantly lower than in walking at FBLCs of 2 and 3 mM, (p < 0.05, 12.6 ± 1.7 vs. 14.0 ± 1.7 and 15.1 ± 1.4 vs. 16.9 ± 2.4, respectively). Running may be performed more easily than walking with the same physiological demand. Factors other than blood lactate concentration may affect the perception of exertion during walking.
Keywords
Perceived exertion, Blood lactate, Heart rate, Exercise mode, Running, Walking
Introduction
Borg Rating of Perceived Exertion scale (RPE scale) has been widely used to quantify individual degree of physical effort [1]. The scale has been constructed by Gunnar Borg so that the lowest rating of 6 would correspond to a heart rate of 60, and the maximal RPE of 20 should compare to 200 bpm in the age of 20's. Therefore, RPE is also a useful predictor for heart rate. Some studies demonstrated that at the speed, which locomotion mode is transitioned preferably from walking to running (preferred transition speed or PTS), RPE values in running were significantly lower than those in walking even if higher physiological demand (i.e. Vo2 or heart rate) was imposed in running than in walking [2,3]. We also showed an equal RPE with significantly higher Vo2 and heart rate in running at the speed of 3-6 km/h when compared with walking, but at 7-8 km/h RPE in running were significantly lower than that in walking [4]. Hetzler, et al. demonstrated that a strong relationship exists between RPE and blood lactate levels during a graded exercise test by using a bicycle ergometer and running [5]. Furthermore, they demonstrated that RPE at Fixed Blood Lactate Concentration (FBLC) is stable regardless of exercise mode.
There have been numerous studies comparing different modes of exercise in terms of the degree of perceived fatigue they cause [5-7]. Walking and running are among most basic and easily accessible exercise modes. Walking is generally thought to be light and pleasant and running is often associated with more exerting effort. While exertion for running has been compared with cycling in previous studies [5], there has been no comparison with walking so far. If their notion is applied to other exercise modes, RPE at FBLC should also be comparably stable when walking is compared with running.
For community-dwelling people, walking has been advocated as an effective way to prevent obesity and arteriosclerosis [8,9]. However, normal walking has only a minor effect in terms of improving health problems because it is difficult to reach the minimal intensity required to increase aerobic power [10]. Running often seems to be perceived as a strenuous activity. However, if carried out at a slow pace, like walking, it need not be unduly effortful. There have been no studies involving young adults so far, but it has been reported that slow jogging at a speed corresponding to the Lactate Threshold (LT) could improve aerobic power and thigh muscle mass in community-dwelling older people [11,12]. Knowing how hard running feels compared to walking on the RPE scale would be very interesting.
To test the hypothesis that RPE at FBLC is stable regardless of exercise mode, we compared blood lactate, heart rate and RPE during graded exercise tests using the two exercise modes that haven't yet been compared: walking and running. Quantifying the perceived effort for walking and running at the same lactate concentration and HR intensity will allow to understand whether there are indeed reasons to believe running is a harder exercise than walking. This is of great importance in developing training programs, especially for those who cannot perform high intensity exercise.
Methods
Subjects
Fifteen untrained male subjects participated in this study. Subject characteristics were as follows (mean ± SD): age (yrs) = 23.1 ± 2.9; body mass (kg) = 61.9 ± 7.5; height (cm) = 168.4 ± 7.0; BMI (kg/m2) = 21.8 ± 2.1. The purpose, procedures, and risks of the study were explained to each participant and all gave their written informed consent before participating in the study. The Ethics Committee of Fukuoka University (Fukuoka, Japan) approved the study.
Progressive exercise test
Two progressive protocols of walking and running were randomized, starting at a treadmill (Senoh X Labordo 2200, Chiba, Japan) speed of 3 Mets. The speed of 3 METs for walking was determined based on METs vs walking speed formula: y = 0.23x2 - 1.32x + 5.01, where y is METs and x is walking speed. The formula for running is: y = 0.84x + 1.38, where y is METs and x is running speed [4]. The speed was increased by 1 METs per 3 minutes. The heart rate was measured 5-6 times starting at 2:30 min mark and averaged. Polar HR monitor (Polar FT1, Kempele, Finland) was used. RPE was enquired once at each stage, between 2:30~2:45 min marks. Blood samples were obtained to measure the blood lactate concentration just after each stage. The treadmill was paused for blood sampling for around 1 min between stages. The actual speeds of both gaits were as follows: 2.8, 4.8, 5.7, 6.4, 6.9, 7.4, 7.9, 8.3, 8.7 and 9.1 km/h for walking and 1.9, 3.1, 4.3, 5.5, 6.7, 7.8, 9.0, 10.2, 11.5 and 12.6 km/h for running. Both tests were terminated when the subject could not complete a given speed. Subjects were instructed to report their perceived exertion according to the Borg 6-20 RPE scale [1].
Lactate threshold
Blood samples were obtained from the earlobe, and evaluated using a lactate analyzer (Arkray Lactate Pro 2, Kyoto, Japan). The speed at the first breaking point of the blood lactate level was used to determine the Lactate Threshold (LT) [13], and five trained staff members visually checked the results using log-log (speed-lactic acid levels) graph paper, and after excluding the minimal and maximal value the mean value from three members out of the five members was taken.
Statistical analysis
The data are expressed as the mean ± SD. RPE at LT, FBLCs of 2 and 3 mM, and Fixed HR (FHR) of 120, 130, 140 and 150 bpm were compared between exercise modes. Differences between RPE at each lactate level and FHR were analyzed using Student's T-test (pair-wise T-test): walking RPE value for a subject was compared to the running value for the same subject. For HR, repeated measures Analysis of Covariance (ANCOVA) was used for determining differences. The statistical analyses were performed using SPSS version 18.0 software package (IBM SPSS Inc., ArmonkNY, USA). Statistical significance was set as p = 0.05.
Results
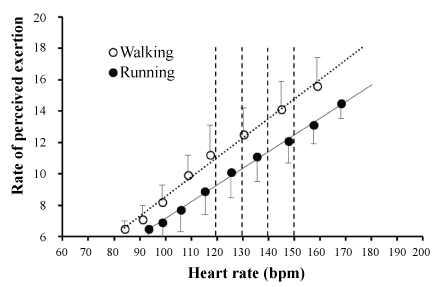
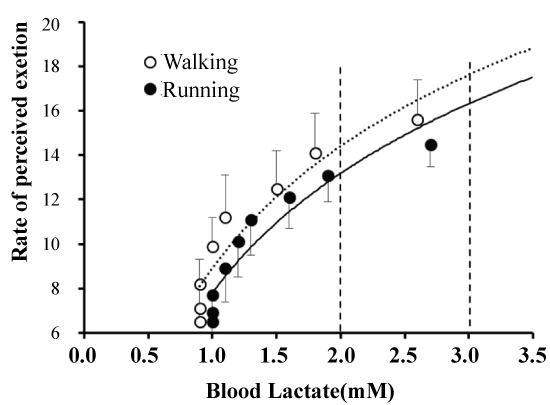
Figure 1 and Figure 2 show RPE responses plotted against various heart rates and blood lactate concentrations. RPE at FHR for walking and running is shown in Table 1. RPE in running was significantly lower than in walking at FHRs of 120, 130, 140 and 150 bpm, respectively (p < 0.01 for all). No significant difference in LT was found between both exercise modes. However, RPE in running was significantly lower than in walking at FBLCs of 2 and 3 mM, (Table 2, p < 0.05, 12.6 ± 1.7 vs. 14.0 ± 1.7 and 15.1 ± 1.4 vs. 16.9 ± 2.4 respectively).
Discussion
We have been using exercise prescription at the intensity of lactate threshold in prevention of various illnesses such as hypertension, diabetes and dyslipidemia [14-16]. It is easy to set individual target intensity for bench stepping or cycle ergometer after a graded test. However, jogging has difficulty in keeping the speed optimal. That's why we use a term "pace with a smile" to describe the "easy" intensity of lactate threshold and RPE 10-12. We defined running below PTS as "slow jogging" which is running at "pace with a smile" and recommend it to the elderly as well as those with low fitness level [11]. As we know from the study of Hetzler, et al. lactate is a sensitive measure of RPE. While there are individual studies of RPE in running and walking, there hasn't been any comparing these two exercise modes at the same HR and blood lactate concentration.
Verifying RPE for walking and running at the same lactate concentration and HR intensity was the main target of this study. The major finding was that perceived exertion is lower in running than walking at FBLCs of 2 and 3 mM. These results suggested that running could be performed more easily than walking above LT intensity. Thus, the notion that RPE at FBLC is stable regardless of exercise mode was not supported by the present results.
In our study we measured RPE for walking and running at heart rate of 120, 130, 140 and 150 bpm. For walking the relationship between RPE and heart rate was close to the Borg's RPE definition where 20 on RPE scale is equivalent to 200 bpm. For running it was 1.6-1.9 lower. Even at the heart rate of 150 the RPE for running was only 12.8, which means that compared to walking it can be relatively easy to exceed lactate threshold. We concluded that for the same heart rate the RPE of running is lower than the RPE of walking. There is a study comparing electromyogram in lower extremities for both walking and running at different speeds ranging from 1.25 m/s (4.5 km/h) to 2.25 m/s (8.1 km/h) [17]. In running the gain in vastus medialis electromyogram is 2-1.5 times higher and it also mobilizes big muscle groups [17]. Prilutsky, et al. studied the changes in electromyogram of lower extremities for running and walking at velocities from 55% to 145% where the PTS is 100% [18]. For running at all velocities the average of electromyogram in 7 muscle groups (tibialis anterior, biceps femoris, rectus femoris, soleus, gastrocnemius, vastus medialis and gluteus maximus) increased linearly. Meanwhile, walking faster than PTS strongly activates swing-related muscle groups such as tibialis anterior, rectus femoris and biceps femoris and its average electromyogram is significantly higher compared to running. Hreljac, et al. investigated further the RPE of walking and running at PTS. They reported that even though the oxygen consumption at PTS is higher for running than for walking, RPE for running was lower (walking; 13.54, running; 10.00) [2]. We can suppose that the increase in oxygen consumption for walking and running results from mobilization of different muscle groups and in the case of running the workload is distributed in the above mentioned muscle groups causing increased oxygen consumption. Heart rate and oxygen consumption are highly correlated and both increase linearly with workload [10]. Thus, we can expect the RPE for running to be lower than for walking even at the same heart rate.
In the relation between RPE and lactate concentration, no significant differences in RPE at LT speed were found between running and walking. With a gradual increase in speed after LT, at 2 mM of lactate concentration RPE in running and walking were 12.6 ± 1.1 and 14.0 ± 1.7, respectively (p < 0.05), and at 3 mM of lactate concentration RPE in running and walking were 15.1 ± 1.4 and 16.9 ± 2.4, respectively (p < 0.05). The results turned out lower RPE in running than walking. However, Hetzler, et al. have shown that no significant differences in RPE were found between cycle ergometer and running at LT, lactate concentration of 2.0, 2.5 and 4.0 mM [5]. These contradictory results may be responsible for the differences in exercise mode. This data indicated that factors other than blood lactate affected RPE during leg exercise. In above mentioned studies on activated muscle groups during both locomotion, muscle mobilization during walking faster than PTS was mainly tibialis anterior, rectus femoris and biceps femoris, and more restricted muscles used than running [18]. On the other hand, running was performed by more distributed muscle groups [18]. Thus, we speculated that lactate production is derived from these muscle groups in each exercise modes, resulting in lower RPE value in running than walking despite the same blood lactate concentrations.
It has been well established that energy expenditure increases quadratically with walking speed, and increases linearly with running speed [5]. As walking speed increases, energy efficiency abruptly increases and intersects with the energy efficiency of running. The speed at the intersection of these lines represents the Energetically Optimal Transition Speed (EOTS). Previous researchers have shown that EOTS ranged from 7.89 to 8.10 km/h [5-7], which was not influenced by training status [6]. In light of these data, an abrupt increase in energy inefficiency during walking above LT, which occurred at 7.2 km/h in this study, may have augmented RPE response.
In conclusion, the present findings do not support the notion that RPE is stable at fixed blood lactate concentration regardless of exercise mode. Since the sample is quite small and homogenous, it would be interesting to see the results for a bigger number of more diverse subjects. The results also indicate that running above LT intensity may be psychologically less stressful than walking above LT intensity, allowing subjects to easily exceed the aerobic training threshold. Understanding that running doesn't have to be strenuous could also help change the attitude towards exercise and contribute to a healthier society.
Acknowledgement
We thank the members of the Laboratory of Exercise Physiology, Fukuoka University, Fukuoka, Japan, and we are also grateful to the participants in this study. The work was funded by a JSPS Grant-in-Aid for Scientific Research (A) (25242065).
References
- Bruce J Noble, Robert J Robertson (1996) Perceived Exertion, Human Kinetics.
- Hreljac A (1993) Preferred and energetically optimal gait transition speeds in human locomotion. Med Sci Sports Exerc 25: 1158-1162.
- Rotstein A, Inbar O, Berginsky T, et al. (2005) Preferred transition speed between walking and running: effects of training status. Med Sci Sports Exerc 37: 1864-1870.
- Kitajima Y, Sasaki Y, Tanaka H (2014) Similar perceived exertion during slow jogging at walking speed. J Running Sci 25: 19-27.
- Hetzler RK, Seip RL, Boutcher SH, et al. (1991) Effect of exercise modality on ratings of perceived exertion at various lactate concentrations. Med Sci Sports Exerc 23: 88-92.
- Steed J, Gaesser GA, Weltman A (1994) Rating of perceived exertion and blood lactate concentration during submaximal running. Med Sci. Sorts Exerc 26: 797-803.
- Borg G, Hassmén P, Lagerström M (1987) Perceived exertion related to heart rate and blood lactate during arm and leg exercise. Eur J Appl Physiol Occup Physiol 56: 679-685.
- Masuo K, Rakugi H, Ogihara T, et al. (2012) Different mechanisms in weight loss-induced blood pressure reduction between a calorie-restricted diet and exercise. Hypertens Res 35: 41-47.
- Ohkawara K, Tanaka S, Miyachi M, et al. (2007) A dose-response relation between aerobic exercise and visceral fat reduction: systematic review of clinical trials. Int J Obes (Lond) 31: 1786-1797.
- Nishida Y, Tanaka H, Tobina T, et al. (2010) Regulation of muscle genes by moderate exercise. Int J Sports Med 31: 656-670.
- Ikenaga M, Yamada Y, Kose Y, et al. (2017) Effects of a 12-week, short-interval, intermitten, low-intensity, slow-jogging program on skeletal muscle, fat infiltration and fitness in older adults: randomized controlled trial. Eur J Appl Physiol 117: 7-15.
- Michishita R, Tanaka H, Kumahara H, et al. (2014) Effects of lifestyle modifications on improvement in the blood lipid profiles in patients with dyslipidemia. J Metabolic synd.
- Beaver WL, Wasserman K, Whipp BJ (1985) Improved detection of lactate threshould during exercise using a log-log transformation. J Appl Physiol (1985) 59: 1936-1940.
- Kinoshita A, Urata H, Tanabe Y, et al. (1988) What types of hypertensives respond better to mild exercise therapy? J Hypertens Suppl 6: S631-S633.
- Motoyama M, Sunami Y, Kinoshita F, et al. (1995) The effects of long-term low intensity aerobic training and detraining on serum lipid and lipoprotein concentrations in elderly men and women. Eur J Appl Physiol Occup Physiol 70: 126-131.
- Sunami Y, Motoyama M, Kinoshita F, et al. (1999) Effects of low-intensity aerobic training on the high-density lipoprotein cholesterol concentration in healthy elderly subjects. Metabolism 48: 984-988.
- Gazendam MG, Hof AL (2007) Average EMG profiles in jogging and running at different speeds. In: Gait Posture. 25: 604-614.
- Prilutsky BI, Gregor RJ (2001) Swing- and support-related muscle actions differentially trigger human walk-run and run-walk transitions. J Exp Biol 204: 2277-2287.
Corresponding Author
Hiroaki Tanaka, Ph.D, Faculty of Sports and Health Science, Fukuoka University, Institute for Physical Activity, 8-19-1 Nanakuma Jonan-ku Fukuoka 814-0180, Japan, Tel: +81-92-871-6631, Ext: 6750, Fax: +81-92-862-3033.
Copyright
© 2017 Sakamoto M, et al. This is an open-access article distributed under the terms of the Creative Commons Attribution License, which permits unrestricted use, distribution, and reproduction in any medium, provided the original author and source are credited.


