Groundwater Evolutionary Processes and Quality Characterization: A Case of Olbanita Aquifer System, Lower Baringo Basin, Kenya Rift
Abstract
A hydro-geochemical relation has been hypothesized through the analyses of physico-chemical data of a fractured volcanic rock aquifer located in the Lower Baringo Basin, Kenyan Rift. Datasets included 15 individual metrics determined in forty-two dry and wet season water samples obtained from six boreholes in the area. Aquifer evolutionary theory was postulated using sequential Principal Component Analysis and Hierarchical Cluster Analysis. In order to eliminate effects of scale dimensionality, PCA decomposed the variable data into four factors namely electrical conductivity, salinity, alkalinity and carbonate equilibrium with external pH control for the dry season, and salinity, carbonate equilibrium with external pH control, alkalinity and electrical conductivity, for the wet season. The main result depicted a major shift in variability factor from electrolytic conductivity (34.8%) in the dry season to salinity (23.5%) in the wet season. Ward's linkage cluster analysis partitioned the aquifer into two spatially discrete associations; the western and the eastern entities respectively, in spite of their shared recharge area. These agglomerative scheduling validated in an integrative approach (with groundwater flow predictions using a calibrated petro-physical groundwater model for the area), linked the four factors to aquifer processes and three pathways: Fault permeability, weathering processes, and water-rock interaction. Statistical approaches are, therefore, useful in conceptualization of pollutant sources and their attenuation for effective groundwater quality management.
Keywords
Groundwater evolutionary processes, Water quality characterization, Olbanita, Kenya rift
Introduction
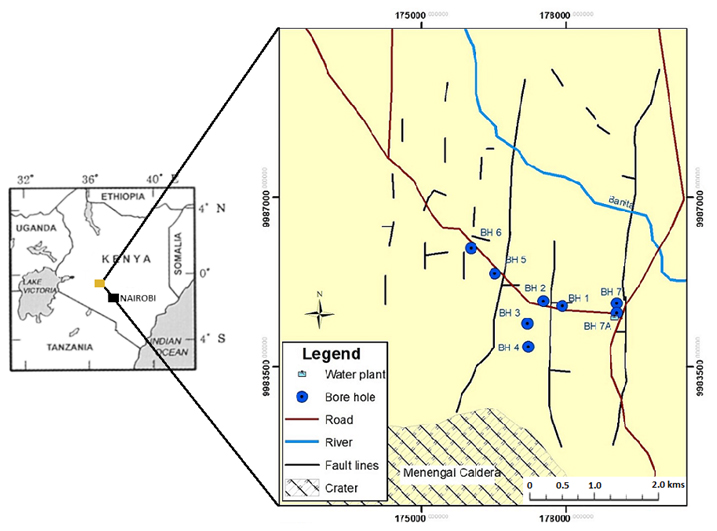
The Olbanita aquifer system is located in the lower Baringo basin of the Kenyan Rift. It's characterized by proximity to the equator and by its elevation which ranges from 1750 meters to 1880 meters a.s.l. Despite its semi-arid climate and open-faulted drainage, the occurrence of groundwater in it makes it indispensable for human subsistence. As noted by [1], water availability problems in the greater Nakuru and Baringo basins, had risen to an echelon whereby they negatively impacted on resident communities and the regional GDP. The hydrogeology of the area is comprised of fractured and weathered volcanic rocks, and lacustrine sediments. The weathered tuffs sandwiched between the Samburu basalts and the Wasagess flows (phonolites and trachytes) of the Rumuruti group form the best aquifers in Olbanita area. The near N-S trending fault systems provide groundwater high porosity pathways which interrupt the aquifer system at five sites.
The city of Nakuru, situated in the upper Lake Nakuru Basin in the south relies heavily on the eight wells drilled in the adjacent Lower Baringo basin for potable water supply. Despite the significance of groundwater in the region, a wide gap in knowledge exists on the aquifer processes that control the physical and chemical variability of groundwater quality [2] observed that sustainable development and management of the quality of groundwater resources in ASALs is achievable through improved understanding of geochemical evolution and groundwater processes.
Determination of groundwater evolutionally processes in relation to groundwater quality in fractured confined aquifers is complex [3], noted that interpretation of associations on the basis of graphical techniques is fraught with difficulties owing to the simultaneous nature of aquifer processes and their effects. Recent studies by [2,4,5] established the value of multivariate techniques such as Principal Component Analysis (PCA), and Hierarchical Clustering Analysis (HCA) in the provision of quantitative measures of correlation between water quality parameters and fundamental aquifer processes. PCA is widely utilized to characterize groundwater pollution sources [2], while HCA is used to deduce spatial variability amongst sampling sites [6]. An integrative application of PCA and HCA was employed by [5] to interpret processes affecting groundwater hydrochemistry and by [7] to evaluate evolutionary trends of groundwater dynamics and by [8] to assess spatial patterns of pollutants in water. A number of investigators [9,10] utilized z-score or log conversions to normalize physical and chemical data acquired from groundwater sources. However, [11] noted that such transformations could eliminate legitimate data values from the analysis. It is therefore suggested that Wards' Linkage agglomeration procedure could automatically re-scale metric data into a range and yield good recovery of clusters.
In this study, we postulate an evolutionary trend of the fractured volcanic aquifer based on multivariate statistics of groundwater quality data of the area. By way of these evaluations, we determine relationships amongst deep groundwater wells and major sources of field-scale groundwater quality variations.
Materials and Methods
The sampling design in this study involved 6 out of 8 sampling sites constituted of boreholes in the Olbanita aquifer system located in the Kenya Rift (Figure 1). The sampling sites were located using a Garmin GPSmap60CSx model. At each sampling site, 4 replicate samples were taken monthly in 250 ml high density plastic bottles which had already been pre-cleaned by using concentrated nitric acid and drenched in deionized water. The samples were screened through Millipore membrane filters of pore size 0.2 micrometers to remove suspended solids. Thereafter the water samples for sulphate analysis were precipitated using 0.2M Zn(CH3COO)2 while samples for metal analysis were acidified in concentrated HCl or HNO3- 1 mL per 100 mL sample. Insitu parameters (pH, Electrical conductivity and Total Dissolved Solids) were measured using Hanna Instruments multi-parameter meter model HI98194. Out of the 4 samples taken in plastic bottles, two replicate samples were stored in ice and taken to the laboratory for determination of geochemical parameters namely; Na+, K+, Ca2+, Cl-, F-, SO2-4, H2S, Total CO2, CO-23, HCO-3, H2CO3 and NH+4. The concentrations of sulphate and chloride components in this study were quantified using UV/VIS spectro-photometer model UV-1800 while the ions such as Na, F, Ca, K and NH3 were quantified using an Ion Selective Electrode (ISE) model ELIT 9801 as detailed in [12]. The concentrations of non-ionic components namely Total carbonate carbonate (TCC) and H2S were quantified using Titrimetric methods as also described in [12]. Prior to ISE analysis, the acidified samples were re-digested using a strong alkali solution. TCC was further speciated into CO32-, CO2, H2CO-3, and HCO3 components.
To evaluate the appropriateness of geochemical data for factor analysis, Kaiser-Mayer-Olkin (KMO) measure of sampling adequacy and Barlett's test of sphericity were performed [13,14]. The KMO index was found to be 0.6 indicating a moderate degree of correlation amongst the variables could be appropriately carried out. Additionally, the Barlett's test of sphericity was significant (Bartlett χ2 = 0.570, 66 df, p < 0.001); confirming the suitability of factor analysis on the data collected in this study. The results of the assessment depict a lower number of variables (factors) which may be used to elucidate the variability in the hydrochemical data. The correlation matrix was further inspected for correlation coefficients greater than 0.3 [15]. Statistically significant correlations in physical chemical data sets for each season were identified through application of the Spearman's rho for non-normally distributed data. Most of the correlation coefficients are over 0.3 indicating that factor analysis may be utilized to provide significant reductions in data dimensionality [16,17] warn about the dangers of such simplified substitutions for non-detectable concentrations (by using numerical surrogates such as one-half the detection limit). Data were, therefore, automatically re-scaled for HCA (because each predictor variable adopted a different scale of measurement), though exempted datasets for PCA. The laboratory geochemical datasets were utilized for PCA considering that the bottom-line correlation matrix (based on the Spearman rank) has the effect of standardizing the variable data [18]. Therefore, it is a more robust estimation technique which is less responsive to outliers compared to the widely used Pearson correlation matrix [18].
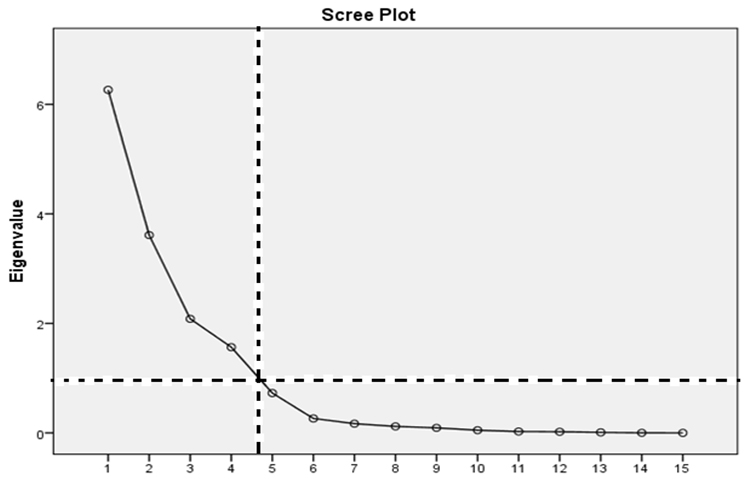
Groundwater quality data were further subjected to PCA and HCA. All statistical computations were executed using of MS Excel spreadsheet and SPSS software's version 20.0. For the PCA matrix, orthogonalization of factors was based on rotated varimax method (with significant eigen value loadings > ± 0.5) and a derived scree plot (with the criterion of eigen values > 1) were inspected for purposes of extracting varifactors [19]. For HCA, the software's algorithm utilized Euclidean distances and 'sum of squared errors' to minimize the criterion function.
Results and Discussions
General consideration of data sets
Based on the test of skewness which uses the arithmetic mean and standard deviation, the ions Cl-, Na+, F-, Ca+2, SO4, H2CO-3, CO32- and H2S are not considered to follow a normal frequency distribution across the study area and across the sampling seasons. On the other hand, the physical - chemical parameters such as TDS, pH, EC, as well as CO2 and NH4 depicted a Gaussian distribution (Table 1). The binomial nature of the former is an indication of natural substandard waters characterized by high mineralization. The super-saturation of Olbanita groundwater may be linked to processes like dissolution of halide, ion exchange and weathering of sodium-rich plagioclases (usually giving rise to clay mineralogy). The high concentration of H2S is an indication of very deep circulation attaining anoxic conditions accompanied with abundant bacterial activity.
To offset the effects on mineral dissolution caused by dilution by meteoric waters from the analyses, seasonal data sets were analyzed independently. The initial step in the analysis was to account for the extent of mutual variability between individual pairs of water quality variables during the separate seasons. The Inter-Item Correlation Matrix of the measured parameters during the dry season and wet season is provided in Table 2 and Table 3, respectively.
Generally, the rotated component matrix was found to contain both positive and negative loadings (Table 4 and Table 5). The work of [20] as enumerated in [21] observed that Eigen value loadings near ± 1 designate a strong association between a variable and a Principal Component (PC); Eigen values exceeding ± 0.75 represent strong correlation, eigen values between ± 0.5 and ± 0.74 represent moderate correlation and those approaching 0 depict weak correlations. Each PC was attributed to a process owing to which the corresponding variables are probably linearly linked. The underlying processes occurring within the aquifer as construed from the consequent Eigen value loadings are presented in Table 4 and Table 5.
Dry season water quality parameters
For the dry season data, the pairs; pH-F, TDS-EC, TDS-CO2, TDS-HCO3, EC-CO2, EC-HCO3, Cl-SO4, Ca-K, Ca-NH4, F-NH4, CO2-HCO3, as well as HCO3-CO3 showed strongly significant relationships. The pairs; pH-Na, pH-Ca, pH-H2CO3, pH-NH4, TDS-Na, EC-Na, K-Cl, Cl-CO2, Cl-HCO3, Na-F, Na-HCO3, SO4-CO2, SO4-HCO3, Ca-F, NH4-H2CO3 and HCO3-H2S depicted moderate correlations (Table 2).
Principal components extracted: On the basis of the eigen values > 1 criterion, four principal components explained variability in groundwater quality at the site (Figure 2).
Based on the Cumulative variance of the rotation sums of squared loadings of the dry season, the retained latent constructs account for 90.1% of the variance in the dataset (Table 6). PC1 with the largest Eigen value accounted for maximum of the total variability (34.8%). PC2 accounted for the total variation of 21%. The third PC explained 20.8% of the total variance. The fourth and final PC explained 13.6% of the remaining variation in the data. The observed Eigen value decomposition corresponds to earlier observations by [22] that after the first PC, the second PC explains the greatest of the residual variance and so forth.
The first principal component, PC1 (the conductivity component) is associated with significantly high concentrations of electrolytic ions indicated by TDS, EC, Na+, Cl-, SO-24, CO2 and HCO-3. TDS depicted a strong correlation with EC (+0.99, α = 0.01) due to the extensive range in solubility of/and mineral diversity within the aquifer system. Under sluggish flow during the dry season, ground water can attain chemical saturation with respect to TDS. Statistical analyses associate Na+ with the dissolution or chemical weathering of sodium-rich plagioclases (to produce clay minerals) or the dissolution of halide [5]. The moderate correlation observed between Na and F (+0.7) and Ca-F (-0.5) coupled with a relatively weak association between the pairs; Na-Cl (-0.4) supports partial derivation of electrolytic ions from weathering of Na-rich feldspathic rocks, dissolution of accessory mineral apatite as well as carbonate materials as opposed to dissolution of either halide rocks. The insoluble products of rock weathering such Cl-, and SO2-4 show a strong positive correlation (+0.84, α = 0.01) but cumulatively tend to inhibit electrical conductivity of groundwater. Within the hydro-geological framework, the pattern and therefore, provenance of weathering can be accounted for by the roughly N-S fracture-fissure zones (Figure 1).
The second principal component, PC2 (the salinity component) is depicted mainly by Cl-, SO-24, Ca+2 and K+ ions in water. The anomalous distribution of Cl-, SO-24, Ca+2 is attributable to ion exchange mechanisms in saturated aquifer zones. The relatively strong association between the pairs Cl-SO4 (+0.8), and the moderate association between the pairs Ca-F, K-Cl, SO4-CO2, Cl-HCO3, and SO4-HCO3, indicate that aquifer water salinity is chiefly attributed to geologic derivation. Additionally, agriculture is equally a major pollution source owing to the skewed distribution of Ca2+ which depicts strong correlations with K+ ions (+0.8) and NH-4 (+0.8) at α = 0.01.
The third principal component, PC3 is the alkalinity component as indicated by pH, and Na+, F-, H2CO3 and NH-3. The pH, Na and F have positive loadings whereas H2CO3 and NH3 have moderate negative loading on this PC. H2CO3 and NH3 are slightly broken down (that is, at about 25 ℃) to release H+, HCO3-, CO3= and NH3- thereby reducing the pH. Reduced pH significantly increases the rates of weathering introducing more Na and F from geologic sources.
The fourth PC represents Carbonate equilibrium with exogenic pH control. The external factor controlling pH is H2S. Sulphide in borehole waters is probably due to inorganic and bacterial changes in deep aquifer under low dissolved oxygen, optimum growth range in pH (between 5.5 and 8.5) and optimum temperature (between 24 ℃ and 42 ℃). Deeper depths within the bedrock which are readily flushed by low mobility, oxygen-deficient ground water; effects which are conditioned by low permeability at depth. The sulfate reducing bacteria, Desulfovibrio desulfuricans obtain energy via the inter-conversion between sulfates and sulphides within the larger sulphur cycle in the aquifer system [23,24]. Under these conditions, sulphates may be reduced to sulphides producing metallic sulphide which is again changed to H2S under the action of H2CO3. The dissociation of H2CO3 yields the CO3= and donate H+ which consequently reduce sulphates to sulphides.
Wet season water quality parameters
During the wet sampling season the pairs; pH-F, pH-H2CO3, pH-CO3, TDS-EC, Na-F, F-H2CO3, F-CO3, CO2-H2CO3, and H2CO3-CO3 showed strong positive correlations at α = 0.01 (Table 3). The pairs; pH-Na, pH-NH3, TDS-Cl, TDS-Na, TDS-F, EC-Cl, EC-Na, Cl-Na, K-Cl, Na-CO3, SO4-CO2, SO4-HCO3, SO4-H2S, Ca-F, Ca-CO2, and Ca-NH4, depicted moderate correlations at α = 0.01 (Table 3).
Principal components extracted: Based on the Cumulative variance of the rotation sums of squared loadings of the wet season, the retained latent constructs account for 91.1% of the variability of the data set (Table 7). PC1 with the largest Eigen value accounted for maximum of the total variability (23.5%). PC2 accounted for the total variation of 22.8% and corresponds in concept to the first PC. The third and fourth PCs explained 22.8% and 22% of the total variance, respectively. The Cattel's Scree test plot is presented in Figure 2.
The first principal component, PC1 (the salinity component) is depicted mainly by K+, Ca+2, Cl-, SO-24, H2S, and NH-4 ions in water. Since the component explains the largest variance in the data, it can be inferred that the groundwater in the study area is mainly saline. Abnormal distribution Ca+2, SO-24, and Cl- may be associated with the ion exchange mechanisms in saturated aquifer zones. At the wet season pH for instance, the divalent Ca+2 is depleted from groundwater as it substitutes for monovalent Na+ on exchangeable micro-pore surface-water interfaces. The ions SO-24 and H2S depict a strong positive correlation (+0.8 at α = 0.01) indicating their geologic provenance; probably due to deep circulation of oxygen saturated waters causing aerobic conditions. The moderate correlations within the pairs; NH4-Ca (+0.7) and NH4-H2CO3 (+0.6) imply anthropogenic contributions to the pH controls on aquifer water salinity. During the wet season, decreases in H+ causes a reduction on the water concentrations of K+, Ca+2, and Cl-. Aquifer salinity, therefore, is chiefly a construct of water-rock interactions and to a lesser extent anthropogenic inputs.
The second principal component, PC2 depicts carbonate equilibrium with external pH control. The dissociation of H2CO3 yields the ions CO3= and H+ which cause the reduction of sulphates to sulphides. The external factors controlling pH are SO-24 and H2S, which are strongly correlated (+0.8, α = 0.01). Sulphate and sulphide transformations in borehole waters are invariably mediated by bacterial changes under anaerobic conditions. Due to high mobility of oxygen-saturated water in the wet season, reduced dissociation of H2CO3 yielding less CO3= and H+ which consequently causes oxidation of sulphides to sulphates. Desulfovibrio desulfuricans may also produce H2S under conditions of the measured pH range (optimum growth range in pH is between 5.5 and 8.5) and optimum temperature between 24 ℃ and 42 ℃. Under these conditions, sulphides in the form of metal sulphide undergo oxidation to sulphates which is again converted to H2S under the action of H2CO3.
The third principal component, PC3 is the alkalinity component as indicated by pH, CO3=, H2CO3- and F- and NH-4. The pH, CO3= and F have positive loading whereas H2CO3- and NH-4 have negative loading on this PC. The PC explains the dissolution of fluoride through microbial activity releasing ammonia and thereby decreasing the pH. Additionally, weak acids such as H2CO3 ionize sequentially releasing CO3=, which raises the pH of water.
The fourth PC is the electrolytic conductivity component which is associated with significantly high concentrations of electrolytic ions indicated by TDS, EC, Na+ and F-. Statistical analyses (e.g. [2] associate F- with weathering of the fluoro-apatite and silicate mineralogy, whereas [5] linked Na+ with the dissolution or weathering of sodium-rich plagioclases (clay mineralogy) or the dissolution of halide. The strong correlation observed between Na and F (+0.9) and the weak association between Na and Cl (-0.6) supports weathering plagioclase feldspars as the chief source as opposed to dissolution of halide. Na and F ions are the intrinsic constructs responsible for electrolytic conduction, as supported by their strong correlations with TDS. Within the hydro-geological framework, the pattern and therefore, provenance of weathering can be accounted for by the roughly N-S fracture-fissure zones. The component accounts for the lowest variability because of reduced residence time of groundwater during the wet season exerting substantial reduction in TDS.
Spatial variability between sampling sites
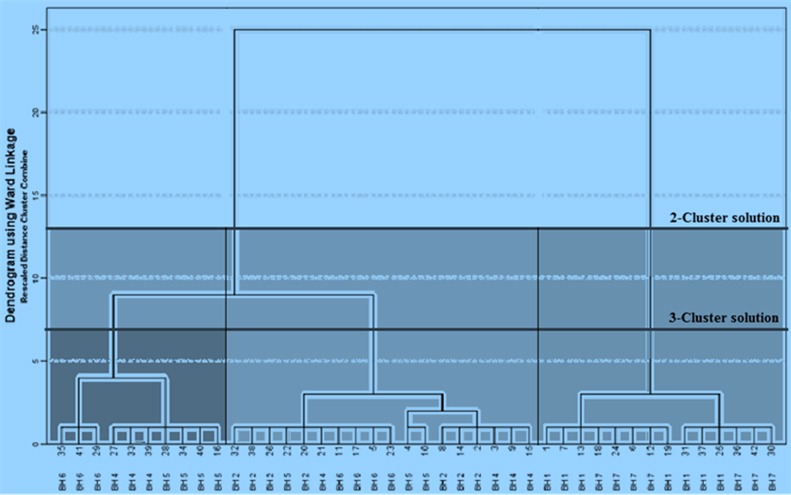
The results of hierarchical clustering procedures were discrete clusters presented graphically in the form of a dendrogram by an averaging algorithm (Figure 3). Based on rescaled Euclidean distances and the 'sums of squared errors', two borehole clusters (within cluster medium depict translational invariance in composition) are conspicuous in the area. The first cluster (forming the left-hand group) consists of the western zone cases (boreholes 2, 3, 4, 5 and 6) whereas the second cluster (forming the right-hand group) consists of the eastern zone borehole cases (boreholes 1, 7 and 7A). The former boreholes were deciphered to be hydraulically connected by a major inferred NW-SE fault which corresponds to a calibrated transmissivity-formation resistivity model for the aquifer. Intrinsic permeability was empirically elevated along major fracture traces, consequently increasing yields of the affected boreholes. Additionally, some wet season samples obtained from boreholes; 4 (sample Nos. 27 and 33), 5 (sample Nos. 28, 34 and 40) and 6 (sample Nos. 29, 35 and 41) formed a mini-cluster within former main group. The samples represent effects of a high permeability fault/fracture structure which accentuates deep circulation of oxygen saturated waters from recent precipitation events coupled with dilution within the corresponding season. We suggested low residence times of groundwater in the zone.
The latter cluster contains boreholes located in the eastern compartment of the aquifer. Elevated values of Cl-, SO-24, and exceptionally low values of EC, TDS, pH, Na+, T-CO2 and HCO-3 were recorded in these groundwater boreholes. However, values of EC, TDS, Na+, SO-24, and K+ depicted an upward trend, whereas those of Ca+2, T-CO2, CO=3 and HCO-3 showed a downward trend from the dry season towards the wet season for these boreholes. By contrast, boreholes in the zone are not hydraulically connected via major fault structures. We therefore suggested that pore-level adsorption/desorption processes in which vast quantities of monovalent ions such as Na+ and K+ are added groundwater in exchange for divalent ions control the observed variability in groundwater hydrochemistry in this zone. Lack of aquifer-scale hydraulic networks and presence of clay micropores imply extended groundwater residence time favouring ion exchange reactions in the zone. Borehole 8 drilled in this zone, dried-up after its completion because a clay layer was inadvertently targeted for production.
Conclusions
In this analysis, the joint applicability of two main advanced multivariate statistical methods for aquifer evolutionary structure has been established. PCA technique condensed the two huge data sets of (24 × 15) and (18 × 15) matrices into two matrices, each of (15 × 4), (that is, variables × factors). For the dry season data set, four principal factors were found to explain the highest cumulative variance (90.1%) in water quality. The principal factors were; electrolytic conductivity (34.8%), aquifer salinity (21%), water alkalinity (20.8%), and carbonate equilibrium with external pH (13.6%). On the other hand, the wet season water chemistry explained net variability at 91.1%. The principle processes underlying the variation in water chemistry were identified as aquifer salinity (23.5%), carbonate equilibrium with external pH (22.8%), water alkalinity (22.8%) and electrolytic conductivity (22%).
The dry to wet seasonal shift in variability from electrolytic conduction to salinity, respectively, is probably due to differential seasonal rates of weathering, flow and dilution processes in the aquifer. Significant correlations (at α = 0.01) in the pairs; Cl-SO4, Ca-K, Ca-NH4, F-NH4, CO2-HCO3, HCO3-CO3, Na-F and F-H2CO3, indicate that the water is alkaline to mildly acidic which are a manifestation of geogenic and to a lesser scale anthropogenic imprints. Key groundwater evolutionary trends suggest that; silicate, carbonate and/or accessory mineral apatite dissolution as well as ion exchange at sorption sites with clay-water interface are the central sources of variability in the groundwater chemistry of the aquifer. Ward's linkage cluster analysis partitioned the aquifer into two discrete spatial associations; the western and the eastern entities respectively, in spite of their indicated shared recharge area. These agglomerative scheduling validated in an integrative approach (with groundwater flow predictions using a calibrated petro-physical groundwater model for the area), linked the aquifer compartments to three pathways: fault permeability and rock dissolution processes in the western zone, and water-rock interaction through pore-level adsorption/desorption processes in the eastern zone. We incontrovertibly associate the western zone with diminutive residence periods and the eastern zone to protracted residence periods. It is convincingly essential, therefore, based on pH shifts per season (basic in dry and acidic in wet) to design a groundwater quality monitoring plan and policy that reduces the number of measured parameters provides an opportunity cost in terms of resources for measurements elsewhere. A sustainable alternative would be to measure EC during the dry season and K+, Ca2+ and Cl- during the wet seasons. These parameters can be used as surrogates for the presence of the remaining parameters for the respective periods. The additional analyses may be required during extended dry periods accompanied by upward trend in EC measurements.
Data Availability
The datasets used and generated in this study are available upon request to sosibenjamin@yahoo.com.
Author Contributions
"Conceptualization, B.S. and A.G.; methodology, B.S. and A.G.; software, B.S.; validation, B.S., A.G., S.M. and J.B.; formal analysis, B. S. and A.G.; investigation, B.S.; resources, A.G., S.M. and J.B.; data curation, B.S. and A.G.; writing-B.S., writing-review and editing, B.S., A.G., S. M. and J.B.; visualization, B.S. and A.G.; supervision, A.G., S.M. and J.B.; project administration, B.S. and S.M.; funding acquisition, A.G., S.M. and J.B.."
Funding
"This research was funded by Kenya Government and through the National Research Fund (website: http://www.nrf.go.ke), grant number NRF/R/2016/FORM-1A".
Conflicts of Interest
"The authors declare no conflict of interest". "The funders had no role in the design of the study; in the collection, analyses, or interpretation of data; in the writing of the manuscript, or in the decision to publish the results".
References
- (2004) Rift valley water supply and sanitation project appraisal report.
- Pazand K (2016) Geochemistry and multivariate statistical analysis for fluoride occurrence in groundwater in the Kuhbanan basin, Central Iran. Modeling Earth Systems and Environment 2: 72.
- Güler C, Thyne GD, Tağa H, et al. (2017) Processes governing alkaline groundwater chemistry within a fractured rock (ophiolitic melange) aquifer underlying a seasonally inhabited headwater area in the Aladağlar range (Adana, Turkey). Geofluids.
- Nwankwoala HO (2013) Interpretation of hydro hydro-geochemical characteristics of deep aquifers in parts of port harcourt, Eastern Niger Delta. Standard Scientific Research and Essays 1: 154-163.
- Moghimi H (2017) The study of processes affecting groundwater hydrochemistry by multivariate statistical analysis (Case study: Coastal aquifer of Ghaemshahr, NE-Iran). Open Journal of Geology 7: 830.
- Esmaeili S, Moghaddam AA, Barzegar R, et al. (2018) Multivariate statistics and hydrogeochemical modeling for source identification of major elements and heavy metals in the groundwater of Qareh-Ziaeddin plain, NW Iran. Arabian Journal of Geosciences 11: 5.
- Yidana SM, Bawoyobie P, Sakyi P, et al. (2018) Evolutionary analysis of groundwater flow: Application of multivariate statistical analysis to hydrochemical data in the Densu Basin, Ghana. Journal of African Earth Sciences 138: 167-176.
- Majeed S, Rashid S, Qadir A, et al. (2018) Spatial patterns of pollutants in water of metropolitan drain in Lahore, Pakistan, using multivariate statistical techniques. Environ Monit Assess 190: 128.
- Smeti EM, Golfinopoulos SK (2016) Characterization of the quality of a surface water resource by multivariate statistical analysis. Analytical Letters 49: 1032-1039.
- Cloutier V, Lefebvre R, Therrien R, et al. (2008) Multivariate statistical analysis of geochemical data as indicative of the hydrogeochemical evolution of groundwater in a sedimentary rock aquifer system. Journal of Hydrology 353: 294-313.
- Everitt BS, Landau S, Leese M, et al. (2011) Hierarchical clustering. Cluster analysis, 71-110.
- APHA (2009) Guidelines for quality water. Environmental Protection Agency, 2011, 1-6.
- Voza D, Vuković M (2018) The assessment and prediction of temporal variations in surface water quality-a case study. Environmental Monitoring and Assessment 190: 434.
- Joshi RR, Mulay P (2018) Deep incremental statistical closeness factor based algorithm (DIS-CFBA) to assess Diabetes Mellitus. International Research Journal of Engineering and Technology 5: 316-320.
- Tabachnick BG, Fidell LS, Using multivariate statistics. Boston: Pearson Education Inc.
- Helsel D (2010) Much ado about next to nothing: Incorporating nondetects in science. Ann Occup Hyg 54: 257-262.
- Rangeti I, Dzwairo B, Barratt GJ, et al. (2015) Validity and errors in water quality data-A review. In Research and Practices in Water Quality.
- US Department of Energy (2012) Multivariate statistical analysis of water chemistry in evaluating the origin of contamination in many devils wash, Shiprock, New Mexico.
- Costello AB, Osborne JW (2005) Best practices in exploratory factor analysis: Four recommendations for getting the most from your analysis. Practical Assessment Research & Evaluation 10: 1-9.
- Liu CW, Lin KH, Kuo YM (2003) Application of factor analysis in the assessment of groundwater quality in a blackfoot disease area in Taiwan. Sci Total Environ 313: 77-89.
- Mohapatra PK, Vijay R, Pujari PR, et al. (2011) Determination of processes affecting groundwater quality in the coastal aquifer beneath Puri city, India: A multivariate statistical approach. Water Sci Technol 64: 809-817.
- Hossain M, Patras A, Barry-Ryan C, et al. (2011) Analysis of principal component analysis, hierarchical cluster analysis to classify different spices based on in vitro antioxidant activity and individual polyphenolic antioxidant compound. Journal of Functional Food 3: 179-189.
- Stanley W, Southam G (2018) The effect of gram-positive (Desulfosporosinus orientis) and gram-negative (Desulfovibrio desulfuricans) sulfate-reducing bacteria on iron sulfide mineral precipitation. Can J Microbiol 64: 629-637.
- Anantharaman K, Brown CT, Hug LA, et al. (2016) Thousands of microbial genomes shed light on interconnected biogeochemical processes in an aquifer system. Nature Communications.
Corresponding Author
Benjamin Sosi, Department of Natural Resources, Kisii University, Kenya.
Copyright
© 2019 Sosi B, et al. This is an open-access article distributed under the terms of the Creative Commons Attribution License, which permits unrestricted use, distribution, and reproduction in any medium, provided the original author and source are credited.