Characterizing Sorption and Modeling Phosphorus Movement on Candler and Immokalee Fine Sand
Abstract
Laboratory and computer experiments were conducted to 1) determine the effect of supporting electrolyte on mass distribution coefficient (KD) for predicting P movement at 30- and 60-cm soil depths using HYDRUS-1D and 2) compare the temporal P concentrations as a function of soil type. The results on Candler fine sand at Lake Alfred showed that P contents for the KD estimated with 0.01 M KCl and 0.005 M CaCl2 were 10 to 15% higher than those predicted with a KD value measured with fertilizer mixture. The predictions on Immokalee fine sand showed that P contents for the KD estimated with fertilizer mixture and 0.005 M CaCl2 were 12 to 20% higher than those predicted with a KD value measured with 0.01 M KCl. The outputs with KD measured with 0.005 M CaCl2 appear to be close to those predicted with a KD measured with fertilizer mixture on Immokalee fine sand. However, the analysis of the KD values across all electrolytes on the two soils studied revealed that 0.01 M KCl is the electrolyte that yields KD values fairly close to fertilizer mixture on Candler fine sand and would be appropriate to use for the coated sand while 0.005 M CaCl2 was comparable with fertilizer mixture on Immokalee fine sand and would be an appropriate electrolyte to use for such uncoated sands. The results of study will help in improving estimation of KDs and description of P transport in citrus production systems of Florida sandy soils. This would provide necessary information for sustainable environmental management and reduce problems of eutrophication and prevent groundwater contamination.
Keywords
Phosphorus adsorption, Simulation modeling, Entisol, Spodosol
Introduction
Adsorption is the mechanism that soil cations and anions (including various phosphorus (P) compounds) are retained by soil particles. The adsorption process tends to restrict compound's mobility and bioavailability [1]. Thus, the procedure for determining the P sorption isotherms could then provide information on their mobility in the soil. The supporting electrolyte concentration is chosen to mimic that of soil solution. Most commonly 0.01 M CaCl2 [2,3], 0.01 N CaCl2 [4], 0.005 M CaCl2 [1], 0.1 to 3 mM KCl [5], 0.05 M KCl [6,7], and 0.01 M KCl [8,9] have been used as electrolytes in studies on P and K sorption. Nair, et al. (1984) [10] reported that P sorption varies with ionic strength and cation species of the supporting electrolyte. For example, [10] showed that P adsorption was generally lower with K+ as the supporting electrolyte cation compared with Ca2+. These studies and others have not explained the rationale behind use of a particular electrolyte other than equilibrating the solutions in deionized or tap water.
The chemical characteristics of soils dominating the Flatwoods and Ridge regions of Florida are well described in [11] and some were also determined in this study. The soil at the Flatwoods consists of nearly level and poorly drained on the Flatwoods classified as Immokalee fine sand (sandy, siliceous, hyperthemic Arenic Haplaquods) with the spodic horizon lying within 1 m from the soil surface. The soil at the Ridge, classified as Candler fine sand (hyperthermic, coated Typic Quartzipsamments) is a well-drained sandy soil with no continuous layer limiting vertical water movement [11]. The Immokalee and Candler fine sand are moderately acidic (pH ranging from 4.9 to 5.6) with > 94% sand textural composition, have low organic matter content (ranging from 0.41 to 0.61% on Immokalee fine sand and from 1.6 to 1.96% on Candler fine sand) and low cation exchange capacity (CEC) (ranging from 2 to 6 cmol (+) kg-1), have inorganic N in the range of 8.2 and 11.2 mg kg-1, moderate to very high P (in the range of 28.7 to 46.5 mg kg-1 for Immokalee sand and 112.8 to 115.8 mg kg-1 for Candler fine sand) and K in the range of 11.8 to 15.2 mg kg-1 for Immokalee fine sand and 23.0 to 29.7 mg kg-1 for Candler fine sand (Table 1) [12]. It has been accepted that soil CEC, particularly the CEC contribution from organic matter content (OMC) has a significant influence on the soil P movement [13]. This study sought to 1) determine the effect of supporting electrolyte on the mass distribution coefficient (KD) for predicting P movement at 30- and 60-cm soil depths using HYDRUS-1D; and 2) compare the P concentrations with time as a function of soil type.
Materials and Methods
Laboratory adsorption study
The baseline soil chemical and physical properties for soils used in the study are described in (Tables 1 and Table 2). Sorption isotherms on the disturbed soil samples (0-15 cm, 15-30 cm) were determined using the batch equilibration procedure [14]. The initial solution concentrations from potassium dihydrogen phosphate (KH2PO4) for P in 0.005 M CaCl2 were 10, 25, 50 mg PL-1. To determine P sorption isotherms, soil samples were obtained from 5 random positions per site at two depths giving a total of 10 samples. Each sample was weighed in triplicates plus a blank control. A 10 g air-dried, subsample of soil < 2 mm particle size was placed in a centrifuge tube and equilibrated with 20 ml (soil solution ratio 1:2) of 3 initial concentrations of P solutions. The centrifuge tubes were shaken for 24 h, centrifuged for 20 min, and filtered through a filter paper (Whatman, #42). All these procedures were done at room temperature ~25 ± 1 °C as recommended by [14] but the filtrate was later stored at < 4 °C until analyzed for P.
Phosphorus sorption isotherm determination
The solutions from the adsorption study were analyzed for P using ICP-AES and calibration standards of 10, 30 and 50 mg PL-1 preparation in fertilizer mixture (with additions of 0.027 mM NH4NO3 and 0.013 mM KCl), 0.01 M KCl and 0.005 M CaCl2. The amount of chemical sorbed to the soil was calculated from the difference between the initial and equilibrium solution concentration:
Where S is the adsorbed concentration (mg kg-1); Vo is the volume of initial solution (L); m is the soil mass (kg); Co is the initial concentration of the standard solution (mg L-1), and, Ce is the soil solution concentration at equilibrium (mg L-1).
Sorption isotherms for P were calculated using the Freundlich equation:
Where Kf is the Freundlich sorption coefficient (mg1-N kg-1 LN) and N is an empirical constant related to adsorption phenomena [15]. The linearized form of the Freundlich equation was used to calculate Kf and N:
Where S is the adsorbed equilibrium concentration (mg kg-1); Ce is the equilibrium concentration (mg L-1) and Cmax is the estimated maximum concentration (mg L-1) and Kf and N are calculated from the intercept and slope of Equation 3. To find average linearized KD for the Freundlich isotherm, the integrated form of the equation was used:
Concepts and governing equations for the simulations
The governing flow equations for water flow and nutrient transport are given by the [16] and convection-dispersion equations (CDE) [17-19]:
Where θ is the volumetric water content [L3L-3], h is the pressure head [L], xi (I = 1, 2) are the spatial coordinates [L], t is time [T], are components of a dimensionless anisotropy tensor (which reduces to the unit matrix when the medium is isotropic), K is the unsaturated hydraulic conductivity function (LT-1), and s is a sink/source term [L3L-3T-1], accounting for root water uptake (transpiration). The sink/source represents the volume of water removed per unit time from a unit volume of soil due to compensated citrus water uptake.
The equation (CDE) governing transport of independent solutes i.e. single-ion transport is given as:
Where c1 and c2 are solute concentrations in the solid (MM-1) and liquid (ML-3) phases, respectively; qi is the ith component of volumetric flux density (LT-1), Ф is the rate of change of mass per unit volume by chemical or biological reactions or other sources (negative) or sinks (positive) (ML-3T-1), respectively, providing connections between individual chain species, ρb is the soil bulk density (ML-3), Dij is the dispersion coefficient tensor for the liquid phase [L2T-1]. The term ra represents the root nutrient uptake (ML-3T-1) which is the sum of actual active and passive nutrient uptake. The solid phase concentration, c1, accounts for nutrient either sorbed in the solid phase or precipitated in various minerals. This is usually quantified by the adsorption isotherm relating c1 and c2 described by the linear equation of the form:
Where KD (L3 M-1) is the mass distribution coefficient of species 1. A tracer (e.g. bromide) are assumed to have a KD = 0 cm3 g-1. The first order decay constant ranges from 0.36-0.56 d-1 [20]. For P, KD is reportedly in the range of 19 to 185 cm3 g-1 [21,22]. Bulk density for the soil is in the range 1.59-1.72 g cm-3 (Immokalee) and 1.55-1.93 g cm-3 (Lake Alfred) (T.A. Obreza, unpublished).
The sink term, s, for the Richards equation represents the volume of water removed per unit time from a unit volume of soil due to plant water uptake. Thus, s is defined as:
Where the water stress response function is a prescribed dimensionless function of the soil water pressure head, b is the normalized water uptake distribution, Lt is the width of the soil surface associated with the transpiration process and Tp is the potential transpiration rate (LT-1) and w is the water stress index.
The nonlinear, predictive equations for the unsaturated hydraulic function in terms of soil water retention parameters are given by [23] as:
Where
Where θr, θs, Ks and l are residual water content (L3L-3), saturated water content (L3L-3), saturated hydraulic conductivity (LT-1), and pore connectivity parameter (estimated to be an average of 0.5 for many soils respectively). Parameters α (L-1) and n are empirical coefficients affecting the shape of the hydraulic functions [23]. We estimated the hydraulic functions α and n after fitting the water content and matric potential data using the van Genuchten model in Community Analyses System (CAS) 2007 [24] developed for determination of soil hydraulic functions (Table 3).
Cumulative flux and concentration
The P concentration and flux were predicted at 30 cm soil depth. Assuming isotropy and a homogeneous profile, the concentration and fluxes at 60 cm soil depth were also predicted.Results and Discussion
Characterizing the P isotherms
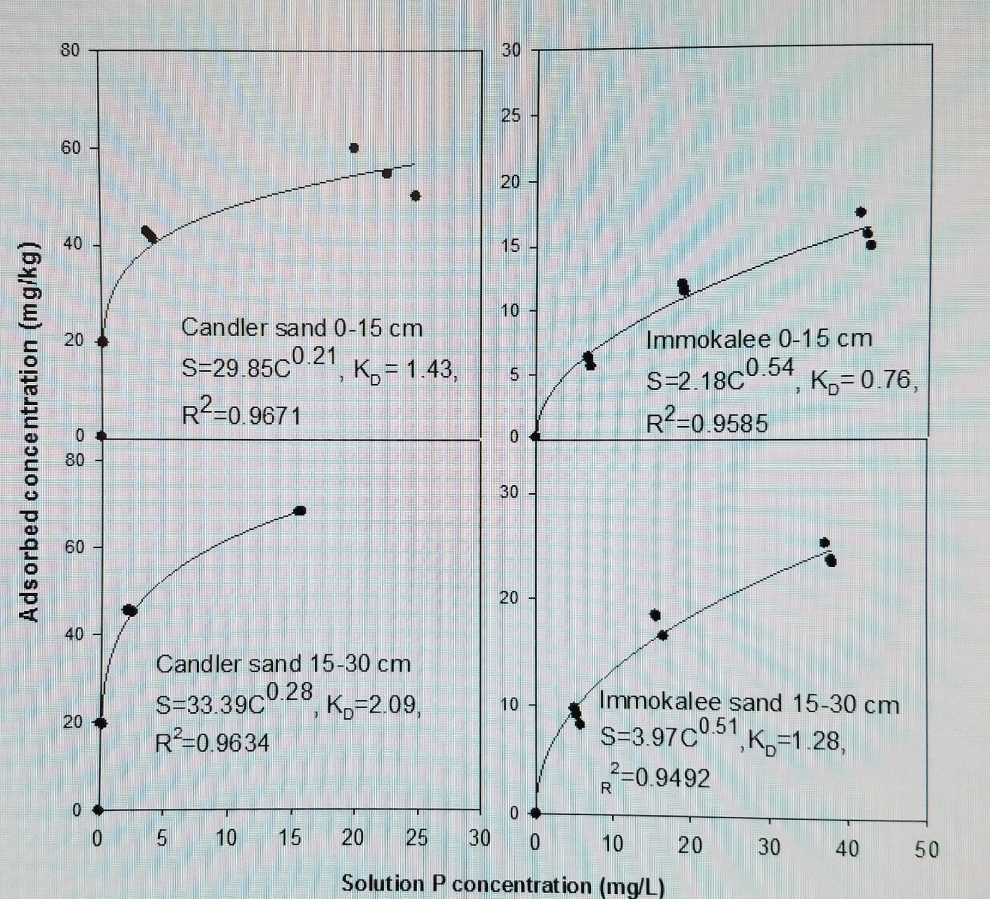
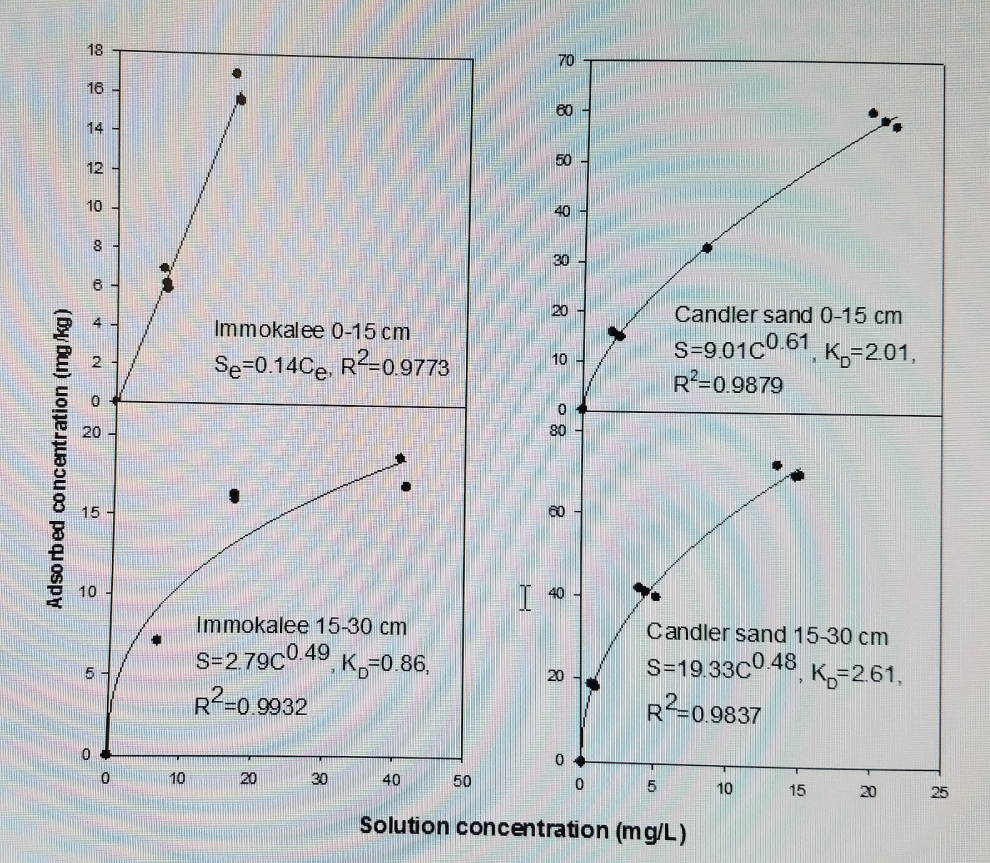
The results of P adsorption were described by a Freundlich model with linearized KD ranging from 0.50 ± 0.19 to 0.75 ± 0.13 kg L-1 for Immokalee fine sand and from 1.73 ± 0.15 to 4.43 ± 0.50 kg L-1 for Candler fine sand using a Cmax of 15 mg L-1 (Figure1 and Figure 2). Phosphorus adsorption was linear for the P concentration range (0 to 50 mg P L-1) studied on the Immokalee sand using fertilizer mixture with KD averaging about 0.44 ± 0.10 kg L-1 (Table 4). Freundlich sorption coefficients (Kf) were lower for Immokalee fine sand than for Candler. High coefficients were observed on Candler fine sand with Kf values eightfold greater than that of Immokalee fine sand. The Kf value obtained with 0.005 M CaCl2 was approximately twofold that obtained with 0.01 M KCl and threefold that obtained in the fertilizer mixture suggesting the influence of the cation effect on P adsorption than with water. According to [7], the lower Freundlich sorption coefficients (Kf), indicate low P retention capacity at low P concentrations suggesting that the potential risk of subsurface P movement and leaching would be high when the concentration of P in surface soils is high. The Kf and KD values reported in were generally lower than those reported for carbonatic soils in south Florida [7] where KD ranged from 14.8 to 76.3 L kg-1 and Kf from 12 to 58 mg1-N kg-1 LN. However, the results in this study agree with those of other researchers [10,13,25]. According to [13], divalent cations on the CEC enhance P adsorption relative to monovalent cations because they increase the accessibility of (+)-charged edges of clay minerals to P. This occurs at pH < 6.5 (the pH of our soils ranged from 4.9 to 5.6, Table 1, because at greater soil pH Ca-P minerals would precipitate while at lower pH (< 4.5), Al-P and Fe-P compounds dictate P adsorption. Barrow, et al. (1980) [25] also showed that at equal ionic strength below pH = 6, there was more phosphate adsorption from CaCl2 than from NaCl on goethite. This phenomenon, according to Barrow and colleagues [25], is caused because high concentration of positive charges near the negatively charged soil surface may be induced by replacing a monovalent cation with a divalent one and also if the added divalent cation has a specific affinity for the adsorption surface. Addition of cations from the supporting electrolyte, unlike using the fertilizer, induced a greater positive charge for phosphate (and orthophosphate anion) adsorption. The higher KDs for Candler fine sand might be due to high organic matter and some Fe/Al coatings that might bind P. The high Kf value in the top 0-15 cm than the 15-30 cm layer is ascribed to higher organic carbon and organic matter in the former layer resulting in increased P adsorption. Our results are comparable to those reported on Margate sand and Immokalee fine sand by Muwamba, et al. (2016) [26].
Phosphorus movement with microsprinkler irrigation as function of time
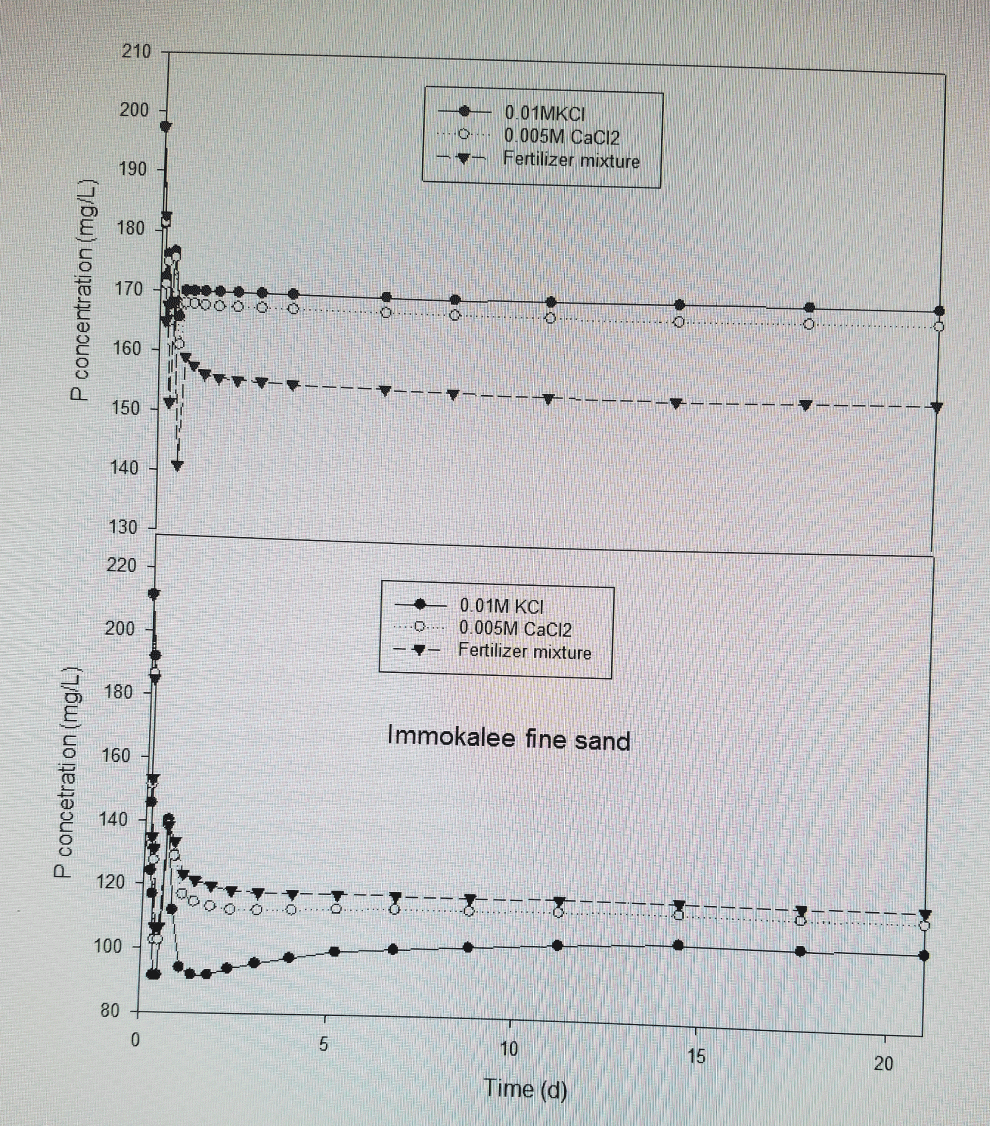
Phosphorus movement was predicted using three different KDs estimated with fertilizer mixture, 0.01 M KCl and 0.005 M CaCl2 for of 21 days, assuming no rainfall events (Figure 3). The assumption is that a KD value obtained using fertilizer mixture typifies that of field conditions with regard to chemical processes. The results on Candler fine sand at Lake Alfred showed that P contents for the KD estimated with 0.01 M KCl and 0.005 M CaCl2 were 10 to 15% higher than those predicted with a KD value measured with fertilizer mixture. The predictions on Immokalee fine sand showed that P contents for the KD estimated with fertilizer mixture and 0.005 M CaCl2 were 12 to 20% higher than those predicted with a KD value measured with 0.01 M KCl. The outputs with KD measured with 0.005 M CaCl2 appear to be close to those predicted with a KD measured with fertilizer mixture on Immokalee fine sand. Thus, the analysis of the KD values across all electrolytes on the two soils studied revealed that 0.01 M KCl is the electrolyte that yields KD values (0.42 to 0.69 L kg-1 on Immokalee fine sand and 0.42 to 1.06 L kg-1 on Candler fine sand) fairly close to fertilizer mixture on coated sands while 0.005 M CaCl2 tends to give KD values (2.44 to 4.66 L kg-1 on Immokalee fine sand and 2.81 to 4.93 L kg-1 on Candler fine sand) two to threefold in magnitude to those determined with fertilizer mixture on sands with Fe coatings. This suggests that 0.005 M CaCl2 would tend to overestimate P sorption and retardation during unsaturated or saturated flow on coated sand while estimating the adsorption process satisfactorily on uncoated sands than 0.01 M KCl. It appears the addition of a supporting electrolyte with a divalent or monovalent cation, unlike fertilizer mixture, increases the surface charge for adsorption of orthophosphate anions on sands with coatings. The use of 0.01 M KCl appears not to be influenced by presence of sand coatings compared with CaCl2 and, thus, would present an appropriate supporting electrolyte for Candler fine sand while CaCl2 would be appropriate for the Immokalee fine sand.
Conclusion
The results show that P adsorption in the top 0-15 cm was greater for Candler than Immokalee sand using the fertilizer mixture, 0.005 M CaCl2 and 0.01 M KCl. The mass distribution coefficients (KD) for P estimated using 0.01 M KCl were similar to values determined using fertilizer mixture for Candler fine sand. The KD values determined using 0.005 M CaCl2 as the supporting electrolyte were two- to threefold greater than the KD of the fertilizer mixture on Candler fine sand suggesting that divalent Ca might result in overestimation of P sorption on Candler sandy soils. On Immokalee fine sand, fertilizer mixture and 0.005 M CaCl2 were comparable and resulted in greater P adsorption than 0.01 M KCl. Thus, it would be appropriate to use 0.01 M KCl as supporting electrolyte for Florida's Candler fine sand and 0.005 M CaCl2 on Immokalee fine sand.
References
- Essington ME (2004) Soil and water chemistry: an integrative approach. CRC Press, Boca Raton, FL.
- Singh BB, Jones JP (1975) Use of sorption-isotherms for evaluating potassium requirements of plants. Soil Science Society America Journal 39: 881-886.
- Belmont MA, White JR, Reddy KR (2009) Phosphorus Sorption and Potential Phosphorus Storage in Sediments of Lake Istokpoga and the Upper Chain of Lakes, Florida, USA. J Environ Qual 38: 987-996.
- RS Bowman, ME Essington, GAO Connor (1981) Soil sorption of nickel-influence of solution composition. Soil Sci Soc Am J 45: 860-865.
- DL Sparks, LW Zelazny, DC Marten (1980) Kinetics of potassium exchange in a Paleudult from the coastal-plain of Virginia. Soil Science Society of America Journal 44: 37-40.
- WG Harris , RD Rhue, G Kidder, et al. (1996) Phosphorus retention as related to morphology of sandy coastal plain soil materials. Soil Science Society of America Journal 60: 1513-1521.
- Zhou M, Li Y (2001) Phosphorus-sorption characteristics of calcareous soils and limestone from the southern Everglades and adjacent farmlands. Soil Science Society of America Journal 65: 1404-1412.
- VD Nair, DA Graetz, KR Reddy (1998) Dairy manure influences on phosphorus retention capacity of Spodosols. Journal of Environmental Quality 27: 522-527.
- RR Villapando, DA Graetz (2001) Phosphorus sorption and desorption properties of the spodic horizon from selected Florida Spodosols. Soil Science Society of America Journal 65: 331-339.
- PS Nair, TJ Logan, AN Sharpley, et al. (1984) Interlaboratory comparison of a standardized phosphorus adsorption procedure. J Environ Qual 13: 591-595.
- TA Obreza, ME Collins (2008) Common soils used for citrus production in Florida. University of Florida Cooperative Extension Service, Gainesville, Florida.
- Kadyampakeni DM, Morgan KT, Mahmoud K, et al. (2014) Phosphorus and potassium distribution and adsorption on two Florida sandy soils. Soil Science Society of America Journal 78: 325-334.
- Havlin JL, Beaton JD, Tisdale SL, et al. (2005) Soil fertility and fertilizers: An introduction to nutrient management. (7th edn), Prentice Hall, New Jersey.
- Graetz DA, Nair VD (2009) Phosphorus sorption isotherm determination. In: Kovar JL, Pierzynski GM, Methods of P Analysis for Soils, Sediments, Residuals, and Waters, Virginia Tech University, Blacksburg, Virginia, 33-37.
- Bowman BT (1982) Conversion of Freundlich adsorption K values to the mole fraction format and the use of SY values to express relative adsorption of pesticides. Soil Science Society of America Journal 46: 740-743.
- Richards LA (1931) Capillary conduction of fluid through porous medium. American Institute of Physics 1: 318-333.
- Simunek J, Sejna M, van Genuchten MT (1999) The HYDRUS-2D software package for simulating two-dimensional movement of water, heat, and multiple solutes in variably-saturated media, International Groundwater Modeling Center, Colorado School of Mines, Golden.
- J Simunek, M Th van Genuchten, M Sejna (2007) The HYDRUS software package for simulating two- and three-dimensional movement of water, heat, and multiple solutes in variably-saturated media PC Progress, Prague, Czech Republic.
- Simunek J, Hopmans JW (2009) Modeling compensated root water and nutrient uptake. Ecological Modelling 220: 505-521.
- Ge Ling, Aly I E1-Kadi (1998) A lumped parameter model for nitrogen transformation in the unsaturated zone. Water Resources Resesearch 34: 203-212.
- Kadlec RH, Knight RL (1996) Treatment wetlands CRC Press, Boca Raton, FL, USA.
- Grosse W, Wissing F, Perfler R, et al. (1999) Biotechnological approach to water quality improvement in tropical and subtropical areas for reuse and rehabilitation of aquatic ecosystems. Cologne, Germany.
- Van Genuchten M (1980) A closed-form equation for predicting the hydraulic conductivity of unsaturated soils. Soil Sci Soc Am J 44: 892-898.
- Bloom SA (2009). Water release curve fitting using CAS. Gainesville, Florida, USA.
- Barrow N, Bowden J, Posner A, et al. (1980) Describing the effects of electrolyte on adsorption of phosphate by a variable charge surface. Australian Journal of Soil Research 18: 395-404.
- Muwamba A, Nkedi-Kizza P, Morgan KT (2016) Determination of sorption coefficient of phosphorus applied for sugarcane production in southwestern Florida. Journal of Environmental Quality 45: 1760-1768.
Corresponding Author
Davie M Kadyampakeni, Citrus Research and Education Center, University of Florida, 700 Experiment Station Road, Lake Alfred, FL 33850, USA, Tel: +1863-9568-843, Fax: +186-3956-4631.
Copyright
© 2017 Kadyampakeni DM, et al. This is an open-access article distributed under the terms of the Creative Commons Attribution License, which permits unrestricted use, distribution, and reproduction in any medium, provided the original author and source are credited.


