Electroencephalographic Changes on Amyotrophic Lateral Sclerosis
Abstract
Background: Amyotrophic lateral sclerosis (ALS) is a heterogeneous neurodegenerative disease. The advanced of Electroencephalogram (EEG) methods have been used frequently in neurosciences research. For this reason, we purposed to show abnormalities of brain electric activity on a group of ALS patients through EEG methods.
Methods: A total of 30 sporadic ALS patients and a control group consisted of 30 healthy subjects were recruited between 2020 and 2024. EEG technique was applied to them. We evaluated: visual analysis, Grand total electroencephalogram scale (GTE), spectral power, broad band measures, source analysis and connectivity analysis.
Results: ALS group showed highest GTE punctuation, decreased of alfa spectral power globally, increase of theta, delta and beta focally; broad band measures analysis showed decreased of alfa power globally, increase of theta, delta and beta focally. These parameters got worse when disease duration increased and when clinic score got worse. Source analysis showed increase of delta, theta and beta generators and connectivity analysis showed global hypersynchrony, predominantly in frontal and centro-parietal areas.
Conclusions: EEG parameters are affected on ALS patients, it demonstrated abnormal brain function predominantly in frontal and centro-parietal areas. It could be as biomarker of this disease.
Keywords
ALS, qEEG, GTE, Spectral analysis, Generators analysis, Connectivity analysis
Introduction
Amyotrophic lateral sclerosis (ALS) is a heterogeneous disease; it is the third more common neurodegenerative disorder. Initially it was described by Jean-Martin Charcot in 1869, it is targeting the motor neuron (MN) system required for voluntary movement [1].
Progressive degeneration of a large proportion of upper (corticospinal) and lower somatic MNs leads to spasticity, muscle atrophy and resulting weakness of skeletal muscles. The first symptoms typically arise in one or more limbs (spinal onset). About 20% of cases present with a bulbar onset, where speech and swallowing problems are noticed first [1].
Whereas spinal onset ALS is fatal at 3-5 years postdiagnosis, bulbar onset ALS patients has a worse prognosis with an average survival of only 2 years. Paralysis of respiratory muscles and subsequent respiratory dysfunction is the cause of death. In a small minority of patients (3-5%) onset of disease occurs in respiratory muscles [1].
The suspected culprits in the etiology of ALS include glutamate exitotoxicity, reactive oxygen species generation, protein misfolding and aggregation, mitochondrial dysfunction, endoplasmic reticulum stress, abnormal axon transport, neuro inflammation and metabolic stress. These dysfunctions uniformly favour increased excitation compared to inhibition ratios in motor neurons of V layer of the cortex and cortico-spinal tract [2,3]. It could be producing abnormalities on electroencephalographic activity on ALS patients.
The first research which applied electroencephalogram (EEG) technique to ALS patients was done by Guillain and col. in 1943, at this time they did not report any significance abnormality [4]. With the advances of EEG, it has been used more frequently in neurosciences research; it is an innocuous technique, low cost and represents a real time evaluation method, there are numerous papers on this field; the results have been contradictories. It could be influenced by the disease step [5,6].
Semi-quantitative EEG involves scores by expert subjective evaluations of EEG with standardized ratings that are later fully quantified employing statistical techniques, the usefulness of this method is also an established technique in clinical neuroscience [7,8].
Quantitative electroencephalogram (QEEG) is an objective method that quantifies the EEG through the power spectrum of activity at the channels or the sources. There are numerous researches that have demonstrated its accuracy for detecting brain abnormalities and subject classification [9-11]. For all reasons we decide to apply for first time in our country these EEG analysis method in the evaluation of ALS group of patients. We purposed to show abnormalities of brain electric activity on a group of ALS patients through EEG methods. Maybe it could be considered in a future as biomarkers of the disease.
Method
Sample characteristic
A total of 30 consecutive sporadic ALS patients were recruited between 2020 and 2024, according to the revised El Escorial criteria for clinically definite or probable. The control group consisted of 30 healthy subjects.
No clinical diagnosis of fronto-temporal dementia (FTD) and no cognitive impairment symptoms were found in these patients. We excluded persons with systemic or others neurological diseases or who deny participating.
Clinic evaluation
ALS Functional Rating Scale Reviewed (ALSFRS-R) was used to evaluate the functional status of ALS patients based on 12 items, functional disability scores range from 0 (maximum disability) to 48 (normal) points.
EEG recording
EEG recordings were obtained using Medicid 5 equipment, software Neuronic EEG recording, 7.2.1 version (Neuronic S.A), with the following technical parameters: sampling rate: 200 Hz, sampling velocity: 69.93 mm/sec, sampling period: 5 milliseconds, ganancy: 1000, band pass filter: 0.5-30 Hz, line filter: 60 Hz, sensibility: 50 μV/divisions.
We used standard protocols developed jointly by the Brain Research Laboratories, NYU, and the Cuban Neuroscience Center [9,11], and also, we used IFCN guidelines for resting-state EEG analysis (International Federation of Clinical Neurophysiology) [5]. The EEG acquisition protocol was as follows: Nineteen surface golden electrodes were placed (Fp1, Fp2, Fz, F3, F4, F7, F8, Cz, C3, C4, T3, T4, T5, T6, Pz, P3, P4, O1, and O2) according to the international 10-20 system, referenced to linked earlobes. The electrode impedance was kept below 5 kΩ. Subjects were lied down on a comfortable position in a bed, in a quiet, air-conditioned room and were instructed to stay awake and relaxed. Resting-state and close eyes EEGs were recorded for 10 min.
EEG analysis
Visual analysis: We used Neuronic EEG edition software, 7.1.7 version (Neuronic S.A). Data were visually inspected by a neurophysiologist, recordings were visually assessed at sensitivity of 50 μV, time constant of 0.3 sec and a time window of 10 sec per epoch. Windows artefacts free were selected by quantitative EEG (qEEG) processing, the windows width was fixed at 2.56 sec.
Semi quantitative analysis (Grad total EEG score): A modified version of GTE score from the original was implemented, which was composed of 13 items. Minimal value is 0 and maximal is 41 [7,8]. Shown on online information.
Quantitative analysis: We used Neuronic EEG quantitative and tomographic software, 6.2.3.0 version (Neuronic S.A).We processed the EEG windows previously selected, using the methods outlined in Bosch 2020 and Bosh 2022 [9,10]; EEGs were re-referenced to the average reference. To convert the time-domain scalp EEG signals to the frequency domain, we used the Fast Fourier Transform (FFT), we then calculated spectral matrices using EEG epochs. These calculations produced a spectral matrix with 48 frequency bins ranging from 0.78 Hz to 19.15 Hz. To correct the EEG spectra at the scalp and eliminate scale variability in the EEG signal that is not related to physiological sources, we used the Global Scale Factor (GSF). This step is beneficial when comparing recordings obtained from different hardware.
Furthermore, normative EEG norms of Bosch, et al. 2020 were applied to the log spectra. This process produced z scalp spectra for each channel and frequency [9].
We used mathematical models: narrow band (CROSS spectral), broad band (absolute power, relative power and mean frequency by frequencies bands). For the analysis of generators (electric tomographic analysis) we used VARETA method [9,11].
Connectivity analysis: We did connectivity analysis at electrode level. We used HERMES toolbox (available free in: https://hermes.med.ucm.es/), it runs on MATLAB 2017 a environment [12].
We introduced EEG windows in txt format. The analyzed parameters were: correlation, real coherency, imaginary coherency (classic measures), phase locking value (PLV), rho index, directionality phase indexes (DPI) (phase synchronization measures), synchronization likehood (SL) (based in generalized synchronization), Ganger causality (based in Ganger causality index), so mutual information (MI) and entropy transference (based in information theory index).
Statistical analysis
We used Neuronic statistic software, version 4.1.3.0 (Neuronic SA) for statistic comparison of narrow band, wide band and generators analysis parameters between ALS and healthy subject groups, through t- test, using alfa error fixed at 0.05 and threshold: -1.71 and 1.71. A regression analysis was done, with the aim of explore the relation between qEEG parameters and disease duration and ALSFRS-R score. For qEEG that resulted significance in this analysis we applied t-test, with the objective to compare two group of ALS patients in relation of disease duration (one group: patients < 6 months duration and the other group: patients > 6 months) and ALSFRS-R score (one group: patients < 40 points and the other group: patients > 40 points).
For statistical analysis of connectivity parameters of ALS patients and healthy subjects we used HERMES toolbox, Wilcoxon test was applied with multiple comparison tests: FDR (False Discovery Rate), CBPT (Cluster based on permutation tests), with maxima distribution: 1.5, clusters number: 10 and permutation number: 100; using alfa error fixed at 0.05.
Results
Sample characteristic
Participants’ characteristics are summarized in Table 1.
Visual EEG analysis
80 percent of ALS patients showed abnormalities of EEG. The most frequent was paroxystic activity on bilateral fronto-centro-temporal areas of light intensity (71.42%), followed by EEG organizational disorders (9.5%) and global slow activity (9.5%), shown in Figure 1.
Semi-quantitative analysis
ALS patients showed higher mean punctuation on GTE score (6.5) in relation with healthy subjects (3), p = 0.00. Its means highest EEG abnormalities on ALS group.
Quantitative analysis
Spectral power: ALS patients showed global diminished of spectral power of alfa band and increase of spectral power of theta (on fronto-temporal areas), delta (on fronto-central areas) and beta bands (on fronto-centro-temporal areas) in relation with healthy subjects, (p = 0.00), shown in Figure 2.
Broad band’s analysis
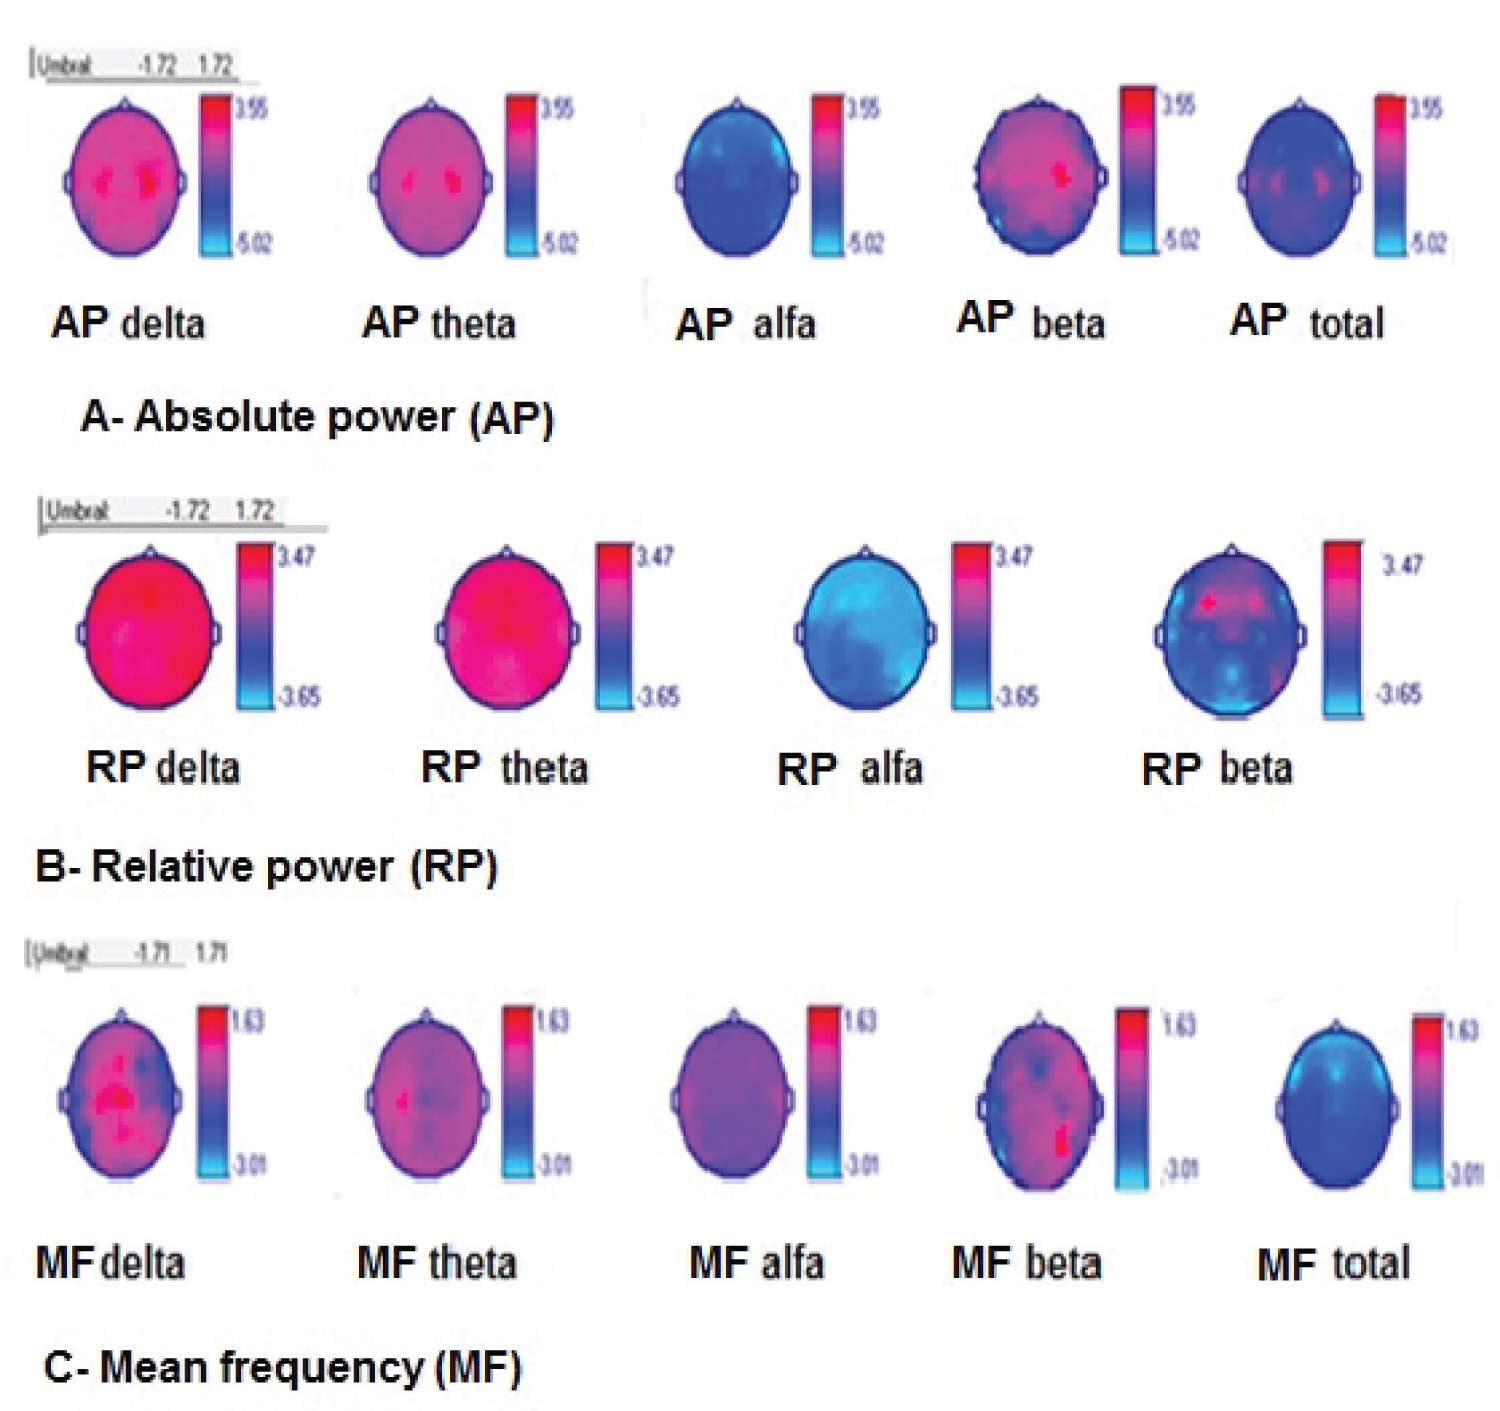
Absolute power (AP): ALS patients showed global decrease of alfa AP and total AP, increase of AP delta and beta on bilateral centro-temporal areas, and AP theta on bilateral central areas (p = 0.01), shown in Figure 3.
Relative power (RP): ALS patients showed global decrease of alfa RP, global increase of RP delta and theta, and also increase of RP of beta on fronto-central areas, (p = 0.03), shown in Figure 3.
Mean frequency (MF): ALS patients showed global decrease of total MF on bilateral fronto-centro-parietal areas, increase of MF of delta on bilateral temporal areas and increase of beta on left temporal area (p = 0.02), shown in Figure 3.
Sources generators analysis
We observed that ALS patients had an increase of source generators of delta (on centro-temporal areas), theta (on fronto-centro-temporal areas) and beta bands (on centro-parietal areas), (p = 0.02), shown in Figure 4.
Regression analysis
Spectral power/disease duration: Table 2 shows the significate spectral power variables from regression analysis with disease duration. We can summarize that as disease duration increases, alfa band spectral power decreased and increased delta and beta spectral power.
There was difference between some of these variables between patients with disease duration bellow and upper six months. Patients with disease duration upper six months showed increase of spectral power of delta band on right fronto-polar area, of beta band on fronto-centro-temporo-parietal areas and also decrease of spectral power of alfa band on central areas, (p < 0.05), shown in Figure 5.
Spectral power/ALSFRS-R score: Table 3 shows the significate spectral power variables from regression analysis with ALSFRS-R score. We can summarize that as clinical symptoms get worse (less points in the score), alfa band spectral power decreased and delta, theta and beta spectral power were increased.
There was difference between some of these variables between patients with ALSFRS-R score bellow and upper 40 points. Patients with highest clinical disability (< 40 points on ALSFRS-R score) showed increase of spectral power of delta band on parieto-occipital areas, of theta band on fronto-temporo-parietal areas and also of beta band on fronto-central areas, (p < 0.05), shown in Figure 6.
Broad band measures/disease duration: Table 4 shows the significate broad band variables from regression analysis with disease duration. We can summarize that as disease duration increases, total AP, total MF and alfa PA decreased; beta AP, RP and MF increased.
There was difference between some of these variables between patients with disease duration bellow and upper six months. Patients with disease duration upper six months showed decrease of AP of alfa band on left centro-parietal area, of total AP on parietal areas and also of total MF on right central area. They also showed increase of beta AP on fronto-central areas and of beta RP on fronto-centro-parietal areas, (p < 0.05), shown in Figure 7.
Broad band measures/ALSFRS-R score: Table 5 shows the significate broad band variables from regression analysis with ALSFRS-R score. We can summarize that as clinical symptoms get worse (less points in the score), AP of theta and delta bands increased and also MF of delta and beta bands increased. There was difference between MF of beta band between patients with ALSFRS-R score bellow and upper 40 points. Patients with ALSFRS-R score < 40 points showed MF of beta band increased on bilateral temporal areas, (p < 0.05).
In summary, qEEG on ALS group of patients:
- Global diminish of spectral power of alfa band, increase of delta (on fronto-central areas), theta (on fronto-temporal areas) and beta bands (on fronto-centro-temporal areas). These abnormalities were higher in patients with longer disease duration (being evident alfa and beta bands abnormalities from 6 months) and in patients with more clinical damage (being evident theta and beta bands abnormalities lower 40 points of the score).
- In relation of broad band variables, ALS group showed increase of AP, RP and MF of delta band (on centro-temporal areas), theta (on central areas) and beta (on centro-temporal areas). Also, they showed decrease of global AP and RP of alfa band. These abnormalities were higher in patients with longer disease duration (being evident abnormalities of alfa AP, RP of beta and MF of theta bands from 6 months) and in patients with more clinical damage (being evident beta bands abnormalities lower 40 points of the score).
- With respect to generators analysis, ALS group showed increase of the generators of delta band on centro-temporal areas, theta band on fronto-centro-temporal areas and beta band on centro-parietal areas.
Connectivity analysis
Statistical analysis of comparison connectivity parameters showed significance parameters: PLV, rho index, SL, Ganger causality, MI and ET. All of them were higher on ALS group of patients, (p < 0.05): PLV globally on alfa and beta bands, predominantly on frontal and centro-parietal electrodes, shown in Figure 8A (alfa band) and Figure 8B (beta band). Rho index globally on alfa and beta bands, predominantly on frontal and centro-parietal electrodes, shown in Figure 8C (alfa band) and Figure 8D (beta band). Ganger causality on frontal electrodes, shown in Figure 8E. SL on frontal electrodes, shown in Figure 8F. MI on frontal electrodes, shown in Figure 8G and ET on centro-temporo-parietal and occipital electrodes, shown in Figure 8H.
Discussion
In Cuba qEEG analysis has been applied on research of neurodegenerative diseases: Alzheimer disease and Parkinson disease, but not to motor neuron disease [13,14]. This research summarizes different methods of analysis of electrical brain activity with the aim of show functional brain changes on ALS that could be used as biomarker of the disease.
Spectral and broad band parameters analysis
Some authors have found decrease of alfa absolute power on ALS patients. The first one was Mai in 1998, who described decrease of this parameter on central (sensori-motor) areas, it had the disadvantage that he only used 8 EEG channels [15]. Other authors have applied scientific advances to EEG research in this field [16-25].
Alfa spectral power or absolute power decrease has been reported by Jayaram and another authors [17-22]. They described focal decrease and it has been attributed to loss of bodies’ neuron on V layer of the motor cortex and also loss of thalamo-cortex connections. We have to remember that alfa activity is generated in thalamo-cortical structures [26-36].
In our research we described global decreased of alfa spectral power and also decrease of alfa AP, RP and MF globally and we could demonstrate it get worse when disease duration increases and when clinical score deteriorates. It is in accordance with Deligani results [37].
In relation with slow band activities (theta and delta) we showed increase of them focally through different methods; predominantly on centro-temporal areas and also over frontal areas. There are some authors with similar results [25,26,31]. They have attributed it to abnormal activity on cerebral network, it was demonstrated through basic research in transgenic mouse models, which described this abnormality in initial steps of the disease [21,38].
For other hand Dukick in 2022, reported decrease of slow band activity on ALS patients [16].
We described increase of beta band activity predominantly on temporal areas but also on frontal and parietal areas.
Other authors also described focally increase of beta band activity on ALS patients. It has been suggested due to increase of cortico-striatal activity in ALS patients, it is considered an adaptation mechanism in motor function regulation after degeneration of motor structures on ALS [21,25,27].
According to Notturno 2023, in healthy subject beta activity is in relation with motor system stability and it represent a sign of an active process to keep the normal function of motor system. It is considerate a good marker to evaluate disease severity [27].
Briels 2020 results are very interesting, he reported decrease alfa band spectral power and increase of theta and delta band power in Alzheimer disease group of patients, very similar that ALS group of patients. It suggests that could be a common mechanism in some degenerative diseases [28].
Our results are in accordance with most authors and one important aspect, we demonstrate that these qEEG abnormalities get worse when disease progress and when clinical signs get worse. Six month of disease duration appears to be a good time to show the beginning of these abnormalities.
Connectivity
On papers that we consulted there is an imbalance in relation with results of connectivity analysis. The most of results refer to functional connectivity based on fMRI and few of them refer to connectivity based on EEG [37-44].
Our results show an increase of functional connectivity based on EEG on ALS group of patients, it was evidenced through increase of global synchronization of cerebral electrical activity of alfa and beta bands, predominantly on centro-parietal areas demonstrated through the most parameters. Other group of connectivity parameters demonstrated increase connectivity on frontal and temporo-parieto-occipital areas. In general, all of parameters are in accordance with areas with most affected parameters are centro-parietal and frontal electrodes.
Assenza 2015, raised that after a cerebral damage, is triggered plasticity cerebral mechanism, new neural networks are created, they started to oscillate in delta band range and after that in other frequency bands range, with hypersynchrony [22].
The increase of functional connectivity also has been attributed to loss of inhibitory intracortical influence, it has been evidenced from initial step of the disease [29]. Clark and col, in 2015, have supported this theory through the argument that in ALS there is a failure of the excitation-inhibition mechanisms, staying a neuronal hyperexcitability state; motor neurons generate a great number of action potentials with hypersynchrony, it causes neuronal death and when disease progress then neural hypoexcitability may occur. Increase of connectivity has been interpreted as compensatory activity in response to neural degeneration [18].
Blain Moraes, in 2013, just like us, reported increase of entropy transference in a group of patients with ALS [30].
Agosta 2011 and Mohammadi 2009 also reported increase of the connectivity on sensori- motor cortex, it was correlated with ALSFRS-R score [31,32]. McMackin 2019, reported increase of connectivity on parietal area.
We didn´t find statistical differences in coherence parameter between ALS patients and healthy subject, but other authors have found abnormalities of this parameter on ALS patients [23]. Deligani 2020, reported increase of the coherence of beta band on fronto-centro-parietal areas, these findings have been correlated with corticospinal tract and motor cortex degeneration through MRI [37]. Briels 2020, demonstrated increase of imaginary coherence of theta band on temporal electrodes [28]. McMackin 2019, reported increase of the coherence of theta and gamma bands on frontal area, he demonstrated it was increased with progression disease [23].
However other authors have reported decreased of functional connectivity. Fraschini 2018, reported global decrease of alfa band connectivity [33], Dukick 2022, described decrease of connectivity on beta band on temporal and frontal areas [16].
Proudfoot 2018, demonstrated decrease of connectivity on alfa and beta bands [42]. For his part Sorrentino 2018, demonstrated that there is a topological reorganization of neural network according with disease progression [45].
EEG parameters show abnormalities of brain electrical activity on ALS patients. It represents an innocuous and low-cost method that could be taken in account as a biomarker to the diagnosis and progression of ALS.
Conclusions
- In relation with spectral power: ALS patients showed decrease of SP of the alfa band globally, increase on delta (on fronto-central areas), theta (fronto-temporal areas) and beta bands (on fronto-centro-temporal areas) in comparison with healthy subjects.
- In relation of broad band measures: AP, RP and MF delta, theta and beta were increase, while AP and RP of alfa band were decrease on ALS patients.
- These abnormalities were highest when disease duration increased and when clinic score got worse. The EEG changes were evident upper 6 months of disease duration and lower of 40 points of ALSFRS score.
- With respect to sources analysis: ALS patients showed increase of generators of delta on centro-temporal areas, theta on fronto-centro-temporal and beta band on centro-parietal areas.
- Connectivity analysis appeared increase globally on alfa and beta bands, predominantly on frontal and centro-parietal electrodes. All of measures indicated electric activity hypersynchronization on frontal electrodes.
Statement of Ethics
This study involving human participants, it was reviewed and approved by Cuban Neuroscience Center Ethic Committee, informed consent was provided and signed by all participants when they were initially enrolled in the study. The work described has been carried out in accordance with the code of ethics of world medical association (Declaration of Helsinski) for experiments involving humans. The privacy rights of human subjects must always be observed.
Conflict of Interest Statement
There is not conflict of interest.
Funding Sources
There is not fund to support this research.
Author Contributions
Bárbara Aymeé Hernández: Conceptualization, data recording, formal analysis, investigation, methodology, writing and editing.
Data Availability Statement
All data generated or analyzed during this study are included in this article and its supplementary material files. Further enquiries can be directed to the corresponding author.
References
- Nijssen J, Comley LH, Hedlund E (2017) Motor neuron vulnerability and resistance in amyotrophic lateral sclerosis. Acta Neuropathol 133: 863-885.
- Forgarty M J (2019) Amyotrophic lateral sclerosis as a synaptopathy. Neural Regen Res 14: 189-192.
- Van den Bos MAJ, Higashihara M, Geevasinga N, et al. (2018) Imbalance of cortical facilitatory and inhibitory circuits underlies hyper excitability in ALS. Neurology 91: e1669-e1676.
- Guillain G, Bertrand I, Godet-Guillain J (1943) The Electroencephalogram in amyothrophic lateral sclerosis. Electroencephalogr Clin Neurophysiol 106: 383-386.
- Hernandez-Gonzalez G, Bringas-Vega ML, Galán-Garcia L, et al. (2011) Multimodal quantitative neuro imaging databases and methods: The cuban human brain mapping project. Clin EEG Neurosci 42: 149-159.
- Babiloni C, Barry RJ, Basar E, et al. (2020) International Federation of Clinical Neurophysiology (IFCN)- EEG research workgroup: Recommendations on frequency and topographic analysis of resting state EEG rhythms. Part 1: Applications in clinical research studies. Clin Neurophysiol 131: 285-307.
- Roks G, Korf ESC, Van der Flier WM, et al. (2008) The use of EEG in the diagnosis of dementia with lewy bodies. J Neurol Neurosurg Psychiatry 79: 377-380.
- Lee H, Brekelmans GJF, Roks G (2015) The EEG as a diagnostic tool in distinguishing between dementia with lewy bodies and alzheimer’s disease. Clin Neurophysiol 126: 1735-1739.
- Bosch-Bayard J, Galan L, Aubert Vazquez E, et al. (2020) Resting state healthy EEG: the first wave of the cuban normative database. Front Neurosci 14: 555119.
- Bosch-Bayard J, Razzaq FA, Lopez-Naranjo C, et al. (2022) Early protein energy malnutrition impacts life-long developmental trajectories of the sources of EEG rhythmic activity. Neuroimage 254: 119144.
- Bosch-Bayard J, Valdés-Sosa P, Virues-Alba T, et al. (2001) 3D statistical parametric mapping of EEG source spectra by means of variable resolution electromagnetic tomography. Clin Electroencephalogr 32: 47-61.
- Niso G, Bruña R, Pereda E, et al. (2013) HERMES: Towards an integrated toolbox to characterize functional and effective brain connectivity. Neuroinformatics 11: 405-434.
- Jacas-Cabrera A, Oduardo-Aguilar M, Verdecia-Aguilar M (2021) Alteraciones en el electroencefalograma cuantitativo en relación con la coherencia en pacientes con demencia Alzheimer. MULTIMED.
- Berrillo SH, Morales LM, Pedroso I, et al. (2022) Functional connectivity derived from electroencephalogram in Parkinson's disease without dementia. Cuban Journal of Neurology and Neurosurgery 12: e469.
- Mai R, Facchetti D, Micheli A, et al. (1998) QEEG in ALS. Electroencephalogr Clin Neurophysiol 106: 383-386.
- Dukic S, McMackin R, Costello E, et al. (2022) Resting-state EEG reveals four sub phenotypes of amyotrophic lateral sclerosis. Brain 145: 621-631.
- Jayaram V, Widmann N, Förster C, et al. (2015) Brain-computer interfacing in amyotrophic lateral sclerosis: Implications of a resting-state EEG analysis. Annu Int Conf IEEE Eng Med Biol Soc 2015: 6979-6982.
- Clark R, Blizzard C, Dickson T (2015) Inhibitory dysfunction in amyotrophic lateral sclerosis: Future therapeutic opportunities. Neurodegener Dis Manag 5: 511-525.
- Nasseroleslami B, Dukic S, Broderick M, et al. (2019) Characteristic increases in EEG connectivity correlate with changes of structural MRI in amyotrophic lateral sclerosis. Cerebral Cortex 29: 27-41.
- Santhosh J, Bhatia M, Sahu S, et al. (2005) Decreased ectroencephalogram alpha band [8-13 Hz] power in amyotrophic lateral sclerosis patients: A study of alpha activity in an awake relaxed state. Neurology India 53: 99-101.
- Vorobyov V, Deev A, Sengpiel F, et al. (2021) Cortical and striatal electroencephalograms and apomorphine effects in the FUS 1 mouse model of amyotrophic lateral sclerosis. J Alzheimers Dis 81: 1429-1443.
- Assenza G, Di Lazzaro V (2015) A useful electroencephalography (EEG) marker of brain plasticity: Delta waves. Neural Regen Res 10: 1216-1217.
- McMackin R, Dukic S, Broderick M, et al. (2019) Dysfunction of attention switching networks in amyotrophic lateral sclerosis. Neuroimage Clin 22: 101707.
- Maruyama Y, Yoshimura N, Rana A, et al. (2021) Electroencephalography of completely locked-in state patients with amyotrophic lateral sclerosis. Neurosci Res 162: 45-51.
- Tejaswini. C, Sreerama R, Cyril PRAJ (2020) EEG based BCI for ALS using complex wavelets and multi-layered neural networks. Journal of Theoretical and Applied Information Technology 98: 4028-4043.
- Iyer PM, Egan C, Pinto-Grau M, et al. (2015) Functional connectivity changes in resting-state EEG as potential biomarker for amyotrophic lateral sclerosis. PLoS One 10: e0128682.
- Notturno F, Croce P, Ornello R, et al. (2023) Yield of EEG features as markers of disease severity in amyotrophic lateral sclerosis: A pilot study. Amyothroph Lateral Scler Frontotemporal Degener 24: 295-303.
- Briels CT, Schoonhoven DN, Stam CJ, et al. (2020) Reproducibility of EEG functional connectivity in alzheimer’s disease. Alzheimer's Research & Therapy 12: 68.
- Govaarts R, Beeldman E, Fraschini M, et al. (2022) Cortical and sub cortical changes in resting-state neuronal activity and connectivity in early symptomatic ALS and advanced frontotemporal dementia. Neuroimage Clin 34: 102965.
- Blain-Moraes S, Mashour GA, Lee H, et al. (2013) Altered cortical communication in amyotrophic lateral sclerosis. Neurosci Lett 543: 172-176.
- Agosta F, Valsasina P, Absinta M, et al. (2011) Sensorimotor functional connectivity changes in amyotrophic lateral sclerosis. Cerebral Cortex 21: 2291-2298.
- Mohammadi B, Kollewe K, Samii A, et al. (2009) Changes of resting state brain networks in amyotrophic lateral sclerosis. Exp Neurol 217: 147-153.
- Fraschini M, Lai M, Demuru M, et al. (2018) Functional brain connectivity analysis in amyotrophic lateral sclerosis: An EEG source space study. Biomedical Physics and Engineering Express 4: 037004.
- Polverino A, Lopez ET, Minino R, et al. (2022) Flexibility of fast brain dynamics and disease severity in amyotrophic lateral sclerosis. Neurology 99: e2395-e2405.
- Matteo F, Matteo D, Arjan H, et al. (2016) EEG functional network topology is associated with disability in patients with amyotrophic lateral sclerosis. Sci Rep 6: 38653.
- Proudfoot M, Bede P, Turner MR (2019) Imaging cerebral activity in amyotrophic lateral sclerosis. Front Neurol 9: 1148.
- Deligani RJ, Hosni SI, Borgheai SB, et al. (2020) Electrical and hemodynamic neural functions in people with ALS: An EEG-fNIRS resting-state study. IEEE Trans Neural Syst Rehabil Eng 28: 3129-3139.
- Kasahara T, Terasaki K, Ogawa Y, et al. (2012) The correlation between motor impairments and event-related desynchronization during motor imagery in ALS patients. BMC Neurosci 13: 66.
- Secco A (2019) Longitudinal ALS study: Research of EEG biomarker during the progression of the disease [thesis]. Universita di Padova degli Studi Mgistrale in Bioingenieria. Italia.
- Bharti K J, Graham S, Benatar M, et al. (2022) Functional alterations in large-scale resting-state networks of amyotrophic lateral sclerosis: A multisite study across Canada and the United States. PLoS One 17: e0269154.
- Gatto RG, Amin M, Finkielsztein A, et al. (2019) Unveiling early cortical and sub cortical neuronal degeneration in ALS mice by ultra-high field diffusion MRI. Amyotroph Lateral Scler Frontotemporal Degener 20: 549-561.
- Proudfoot M, Colclough GL, Quinn A, et al. (2018) Increased cerebral functional connectivity in ALS: A resting state magneto encephalography study. Neurology 90: e1418-e1424.
- Meier JM, Van der Burgh HK, Nitert AD, et al. (2020) Connectome-based propagation model in amyotrophic lateral sclerosis. Ann Neurol 87: 725-738.
- Chen H, Hu Z, Ke Z, et al. (2023) Aberrant multimodal connectivity pattern involved in default mode network and limbic network in amyotrophic lateral sclerosis. Brain Sci 13: 803.
- Sorrentino P, Rucco R, Jacini F, et al. (2018) Brain functional networks become more connected as amyotrophic lateral sclerosis progresses: A source level magnetoencephalographic study. Neuroimage Clin 20: 564-571.
Corresponding Author
Bárbara Aymeé Hernández, Head of Clinical Neurophysiologic Service, Cuban Neuroscience Center, 190 Av and 25 Street, Cubanacán Playa, Havana, Cuba, Tel: 5372637100.
Copyright
© 2024 Hernández BA. This is an open-access article distributed under the terms of the Creative Commons Attribution License, which permits unrestricted use, distribution, and reproduction in any medium, provided the original author and source are credited.