Near Infrared Spectroscopy alike Magnetic Resonance Imaging: Complementary Data in Rat Brain after Cocaine Treatment
Summary
Magnetic Resonance Imaging (MRI) and Near Infrared Spectroscopy (NIRS) are two major in vivo non invasive methodologies more and more applied in research. The first more than the second is largely used also in clinical domain. Both techniques are more or less related to the effectiveness of oxygen levels and/or functionality in blood and this can be exploited to monitor the influence of various factors and conditions upon the living tissue, in particular the brain.
Here the complementarity of these two methodologies is challenged via comparison of the effect of cocaine treatment upon NIRS as well as MRI parameters monitored in vivo in rat brain.
The aim of the study is to further support recent data obtained with our early introduced NIRS prototype to monitor hematic changes in CNS showing that NIRS is allowing evaluating rat blood brain barrier penetration of exogenous agents and demonstrating parallel alteration of brain metabolism following alcohol intake in rodents and man. Positive evidence will further confirm the utility of such prototype for real time translational rodent-man in vivo non invasive studies.
The parallel MRI-NIRS data monitored confirm previous results obtained with these two non invasive methodologies and further support NIRS as a valuable tool for non invasive in vivo real time analysis of brain metabolism AND of drug treatments in the CNS.
Keywords
Magnetic Resonance Imaging (MRI), Near Infrared Spectroscopy (NIRS), Oxygen (O2), Oxygenated/Deoxygenated hemoglobin (HbO2/Hb), In vivo rat brain, Cocaine
Introduction
NIRS
In 1977, Franz Jöbsis first introduced near infrared spectroscopy (NIRS) for the in vivo monitoring of tissue oxygenation [1]. The technique is based on the principle that near-infrared light easily passes through biological tissues and is mainly absorbed by few tissue chromophores such as as hemoglobin water and lipid [2-4]. Importantly, the absorption spectra of near-infrared light differ for the oxygenating-deoxygenating states of hemoglobin (HbO2 vs. Hb, respectively) so that the two compounds can be directly monitored. The sum of Hb + HbO2 is considered = blood volume i.e. HbT [5,6]. Then NIRS has been rapidly improved at the level of theory and instrumentation for accurate qualitative and quantitative in vivo NIRS analysis [7-11].
Today, thanks to its penetration depth and high temporal resolution and biochemical specificity NIRS is becoming a widely used research non-invasive instrument to measure tissue oxygen (O2) status and can be applied to biomedical research and clinical environments to measure oxygenation in a variety of tissues including muscle, brain and connective tissue. More recently it has been used in the clinical setting to assess circulatory and metabolic abnormalities. Continuous-wave spectrometers are the most commonly used devices, which provide semi-quantitative changes in oxygenated and deoxygenated hemoglobin also in small blood vessels (arterioles, capillaries and venues) [12-14].
MRI
Functional Magnetic Resonance Imaging (fMRI) is a non invasive methodology. It is using radio frequency pulses in a strong static magnetic field and is mainly based upon changes in blood flow and delivery of oxygen following neuronal activation i.e. by nicotine [15-17]. fMRI has been extensively used to study the functional organization of the human brain in healthy and disease states [18].
Furthermore, fMRI is used to map spatial-temporal patterns of brain activity induced by pharmacological agents. The extension of this approach so called pharmacological MRI (phMRI) to animal models is a translational tool to bridge clinical and pre-clinical research [19]. It has provided a reliable device to resolve brain circuits and mechanism-specific functional changes produced by selective intervention in different neurotransmitter systems in vivo [20].
In the context of brain mapping approaches, as well as to confirm NIRS signals, simultaneous recording of cerebral blood oxygenation changes during human brain activation were performed using fMRI and NIRS [21,22].
These parallel NIRS and fMRI studies have shown good correlation between fMRI changes and NIRS measures. In particular, a linear correlation between the normalized MRI BOLD signal and the normalized deoxygenated hemoglobin (Hb-NIRS) was reported in the rat brain during modulation of inhaled oxygen concentration [23,24].
Similarly, in experiments using variation in inspired oxygen, quantitative agreement was observed between the changes in deoxyhemoglobin values derived from NIRS and the changes predicted with blood-oxygen-level-dependent (BOLD) MRI [25] as well as a high temporal correlation between the BOLD signal and Hb-NIRS in the motor cortex of human brain [26,27] or between the MRI BOLD signal and oxygenated hemoglobin (HbO2-NIRS) during functional human brain activation in subjects performing simple motor tasks [28]. Thus, it appears that these two non invasive methods are mainly analysing similar or complementary tissue marker{s}. In order to support such observation, in the present work the association of these two techniques have been attempted to analyse the influence of cocaine treatment upon the MRI BOLD signal as well as the NIRS parameters within the rat brain.
Material and Methods
Adult male rats (230-250 g) were supplied by Charles-River (Italy) and were kept in temperature- and humidity-controlled rooms (22 ℃, 50%, respectively) with lights on from 07.00 h to 19.00 h with water and food available ad libitum. All procedures concerning experimentation, transportation and care of the animals were carried out in accordance with the Italian law (Legislative Decree no.116, 27 January 1992), which acknowledges the European Directive 86/609/EEC, and were fully compliant on the care and use of laboratory animal and codes of practice. Furthermore, all efforts were made to minimize the number of animals used and their suffering.
NIRS
Nine adult male CD rats have been anaesthetised following the animal preparation requested for fMRI studies as described [29].
Briefly 3% halothane in a 30%-70% O2-N2 gas mixture was used for anaesthesia and rats were tracheotomised and artificially ventilated with a mechanical respirator. Animal paralysis was achieved by D-tubocurarine (0.25 mg/kg/h in femoral artery). Each rat was then positioned in a stereotaxic holder and the NIRS optic probes were positioned upon the sagittal line as described earlier [30].
The NIRS apparatus used is fully described [30]. Briefly, it integrates six continuous-wave laser diode sources emitting in the near-infrared spectral region and a low-noise detection system based on an avalanche photodiode. The optical probe is based on a compact, reliable, and low-cost fiber based system with four quantitative measuring points.
Using this system, the non-invasive in vivo NIRS analysis of HbO2, Hb and HbT levels within the whole brain (CNS) was performed in anaesthetized rats as already described [30,31]. In addition, in order to evaluate the effect on the NIRS measurements of the contrast agent used in typical fMRI experiment, the concentration changes of HbO2, Hb and HbT levels were monitored in a further group of four rats during the administration per os of exogenous oxygen (O2) during 1 min as described earlier [31,32] and this before and after the injection of the contrast agent Injections were made after a dilution in 100 ml of glucose isotonic (5%, see below). At the end of each experiment, the position of the NIRS optical fibers was verified versus bregma.
MRI
Another group of rats (n = 9) anaesthetised and prepared as described above (see NIRS) were individually positioned in a stereotaxic holder shaped and prepared for fMRI analysis as described [29]. To sensitize the signal intensity to changes in rCBV component of the hemodynamic response, rats were treated with a 2.67 mg/kg dose of the blood pool contrast agent "Endorem" (Guerbet, France) diluted in 100 ml of glucose isotonic 5%. Then fMRI data were acquired as previously described [29,33] i.e. using a Bruker Biospec 4.7T system, a 72-mm birdcage resonator for radiofrequency transmit and a Bruker "rat brain" quadrature receive coil secured to the animal holder above the head (Bruker Biospin, Ettlingen, Germany). In particular, MRI acquisition of changes in the relative cerebral blood volume (rCBV) component of the hemodynamic response in the striatum and thalamus brain regions were performed as described [29,34].
Treatments for "NIRS and MRI rats"
Following a 5 min period of control/control measurements, "NIRS and MRI rats" (n = 9 each group) were treated with saline (NaCl 0.9% 1.4 ml i.v. in the femoral vein at a rate of 1 ml/min) and approximately 30 min later recordings were stopped. Then a second control period of 5 min was performed before the injection of cocaine (0.5 mg/kg) and measurements continued approximately other 30 min. The dose of cocaine used here has been established as providing a widespread central rCBV response, uncorrelated to transient blood pressure changes [34,35].
Results
Evaluation of the effect of the fMRI contrast agent upon NIRS parameters
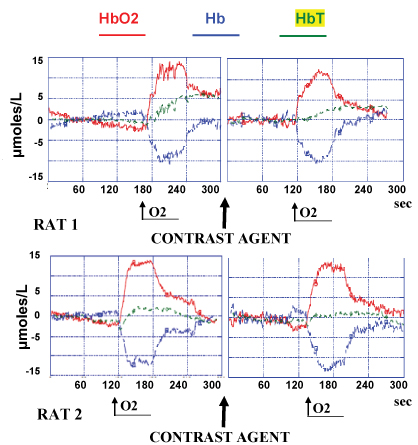
Pure O2 supply per os during 1 min is rapidly and importantly increasing HbO2 levels from steady state baseline considered as zero up to approximately 12-14 μmoles/L and significantly decreasing Hb to a similar negative extent (see Figure 1 left). This effect is reversible as soon as the influx of O2 is stopped. Once the NIRS values recorded returned to steady state baseline, the injection of the contrast agent is performed. This was followed by any significant changes of the NIRS parameters and 2 min later pure O2 is again supplied per os during 1 min. Again a similar increase of HbO2 levels from steady state baseline considered as zero up to approximately 12-14 μmoles/L and a decrease of Hb values to a similar negative extent is monitored (see Figure 1 right).
Evaluation of the effect of the cocaine
MRI
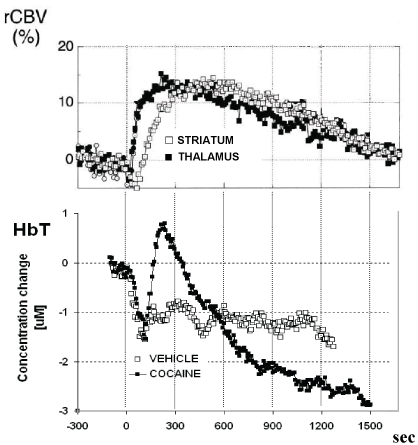
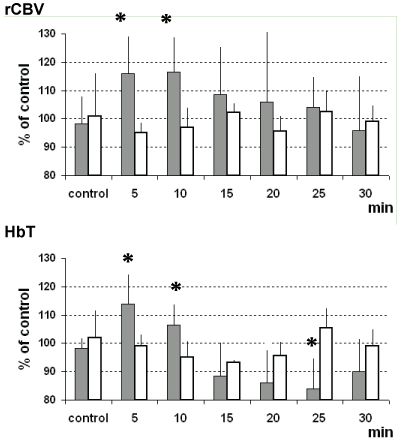
For each animal, the average values of rCBV were calculated during the 5 min pre-drug baseline and after drug infusion; the percentage change in rCBV was then calculated. Data analysis were performed as described by Marota, et al. [34]. Acute saline was followed by no significant changes in rCBV while acute intravenous cocaine infusion increased significantly rCBV contrast signal in the analyzed regions of rat brain. In particular, it was observed that the time course of response of rCBV was similar in both regions studied, reaching maximum activation of approximately 116% of control values within 5-10 min. The duration of response was also similar; rCBV returned to baseline within 25-30 min (see Figure 2 and Figure 3).
NIRS
Similarly, vehicle treatment was followed by fluctuation of the NIRS-HbT parameter analogous to those monitored in control/control experiments (i.e. no treatment performed). Again, acute intravenous cocaine infusion increased significantly HbT values within 4-5 min.
Note in Figure 3 that the positive change of the fMRI as well as NRIS parameters here monitored was similar within the same period of time, i.e. approximately 114% HbT and 116% rCBV 5 min after cocaine treatment. Although S.E.M. values were relatively large, statistical analysis indicated these changes as significant (see below).
In contrast to fMRI data that remained constantly over control values, in the successive 25 min the NIRS-HbT parameter decreased significantly (see Figure 2 and Figure 3).
Data analysis
MRI data analysis were performed as described by Marota, et al., [34] i.e. after image registration, rCBV as a function of time was calculated for each image and data were then subjected to a paired t-test across the number of animals comparing pre-drug versus post-drug rCBV within each animal. In particular, acute intravenous cocaine infusion increased significantly rCBV contrast signal in the analyzed regions of rat brain (*p, 0.0005 thalamus; p, 0.0007 striatum).
NIRS data analysis
Row data were subjected to ANOVA, with comparison between "control" (vehicle) and "treatment" values performed using the Tukey test. Then, the results were presented as % of control values, mean ± S.E.M, *p < 0.05.
Discussion
Near infrared spectroscopy (NIRS) is becoming a widely used research instrument that supply a non-invasive, non-ionizing way to measure hemoglobin levels and oxygen saturation in the living tissue. NIRS has been initiated since about four decades [1], since then, it has been greatly improved [10,11].
NIRS has been applied to measure oxygenation in a variety of tissues including muscle, brain and connective tissue, and more recently it has been used in the clinical setting to assess circulatory and metabolic abnormalities (for a review see ref. [14]).
In particular, in the last two decades, the main steps in the human NIRS studies have focused upon its application in emotional and social field in the attempt of understanding of the functioning human brain in response to emotional stimuli and social contexts [36].
Continuous-wave spectrometers are the most commonly used devices, which provide semi-quantitative changes in oxygenated and deoxygenated hemoglobin in small blood vessels (arterioles, capillaries and venules [12-14]. In the purpose to analyse such changes in the CNS of small animals we have developed a NIRS prototype that integrates six continuous-wave laser diode sources emitting in the near-infrared spectral region and a low-noise detection system based on an avalanche photo-diode. The optical probe is based on a compact, reliable, and low-cost fiber based system with four quantitative measuring points, allowing in vivo non invasive, real time monitoring of levels of Hb, HbO2 and then HbT in the CNS of anaesthetized rats so that analysis of brain vascular and metabolic activities in real time can be performed in the CNS of rodents [30]. Indeed, HbO2 and Hb are chromophores also present in brain tissue and are markers of the degree of brain tissue oxygenation, thus they are indicative of the state of vascular activity and the state of the oxygen saturation, thus providing an index of brain tissue metabolism [31,32].
Furthermore, the results obtained following pure O2 supply are in agreement with data gathered in related studies performed with the association NIRS-BOLD MRI [23], with pharmacological experiments using MRI to scrutiny central vascular activities [37] and with previous NIRS work showing changes in tissue oxygen saturation (StO2) from approximately 70% in the normal conditions i.e. with 21% of O2 in the inspired air, to approximately 85-90% when pure oxygen is provided [8].
Accordingly, the present data show an increase of approximately 12-14 μmoles/L from steady state baseline when pure O2 is supplied. These results reinforce the relevance of NIRS for measuring turnover of endogenous oxygen that is directly related to neuronal functions coupled with blood flow [38]. In particular they sustain the capability of the NIRS prototype used here on the direct non invasive detection of HbO2 and Hb in rat brain as introduced earlier [30-32]. The normal ligand-receptor interaction triggers neuronal activity which is linked to an increase in metabolism (metabolic coupling) [39]. This in turns leads to an increase in the local concentration of deoxygenated blood and cerebral blood volume (neurovascular coupling) [40]. What is measured are the changes in hemodynamic (i.e. concentration of oxygenated and deoxygenated blood), that are directly related to the metabolism itself [41].
In the present experiments, the two methodologies used, i.e. MRI and NIRS both are showing that there is a gradient in time to reach maximum activation of the respective parameters analyzed of approximately 4-5 min following treatment with cocaine.
More precisely, in the MRI analysis the duration of the rCBV response was similar in both brain regions analyzed, i.e. striatum and thalamus, then rCBV returned to baseline within 30 min without falling below the pre-drug baseline level. Acute intravenous cocaine challenge under anaesthetic conditions is known to produce a robust MRI response [34,42]. Accordingly, the rCBV time courses we observed were consistent with those presented in the literature using the same technique [34] and with regional cerebral blood flow (rCBF) changes measured by autoradiography [43]. These data are in accord with results observed in rodents by blood oxygenation level-dependent (BOLD) and CBF MRI [44] as well as in man where acute intravenous cocaine administration also resulted in similar blood oxygenation level-dependent (BOLD) MRI response profiles within a 10 min post challenge time window [45].
Parallel analysis of MRI and NIRS data
The NIRS measurements also show a similar response of the HbT (total blood volume) parameter within the initial 5-10 min after cocaine treatment. In the successive 20 min the NIRS parameters returned to control values and decreased significantly within 25 min post treatment while MRI data remained constantly over control values. This difference could be related to the mentioned vasoconstriction efficacy of cocaine [37,42,44,46] and may result in a decreased total blood volume that NIRS could detect. Indeed, the NIRS method monitors mainly at the level of the large vessels (12, 13, and 14) in front of a more selected monitoring at the level of capillary done by MRI [47].
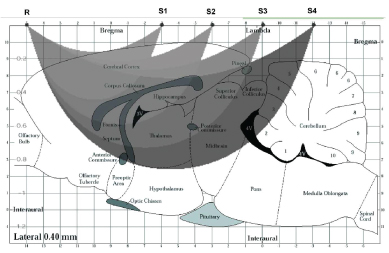
An additional/alternative explanation could be related to the difference in the regions monitored by the two methods: i.e. striatum and thalamus with MRI, a larger brain area by NIRS as proposed in Figure 4. Indeed, MRI data obtained in striatum and thalamus may not mirror MRI data obtained in the whole brain, accordingly earlier studies using Dynamic Susceptibility Contrast Magnetic Resonance Imaging (DSC-MRI) detected significant decrease of relative cerebral blood volume (rCBV) in the human brain 10 min after a dosage of 0.4 mg/kg cocaine, decrease that is indicative of cerebral vasoconstriction [37,44].
In previous work cocaine was given sub-cute (s.c.) to rat prepared for NIRS analysis as described here but under different (urethane) anaesthesia. After 10 min from cocaine treatment similar variation of NIRS parameters to that presented here were obtained [31]. This support the concept of "pharmacological NIRS" (phNIRS) applications as indeed the effect of cocaine treatment on NIRS parameters is comparable in different conditions: i.e. under isofluorane or urethane anaesthesia, therefore suggesting that the two types of anaesthesia used are compatible with the methodology. Accordingly, similar data have been observed when utilizing two different routes of cocaine administration: i.e. i.v. or s.c., thus confirming the influence of acute cocaine on metabolic activity of the brain and the feasibility of such analysis with non invasive NIRS.
In conclusion, the goal of the study to further support recent data obtained with our early introduced NIRS prototype to monitor real time non invasive hematic changes in CNS has been achieved. Indeed, the present parallel MRI-NIRS study confirm previous data obtained with these two non invasive methodologies [48] and further support the feasibility of the NIRS approach performed with the presented NIRS prototype. This evidence together with the recent observation that NIRS is allowing evaluating blood brain barrier penetration of exogenous agents [49] and is demonstrating parallel alteration of brain metabolism following alcohol intake in rodents and man [50] further support NIRS as a valuable tool for non invasive in vivo real time analysis of brain metabolism AND of drug treatments in the CNS.
References
-
Jobsis F (1977) Noninvasive, infrared monitoring of cerebral and myocardial oxygen sufficiency and circulatory parameters. Science 198: 1264-1267.
-
Sevick E, Leigh J, Maris M, et al. (1991) Quantitation of time- and frequency-resolved optical spectra for the determination of tissue oxygenation. Anal Biochem 195: 330-351.
-
Yodh A, Chance B (1995) Spectroscopy and imaging with diffusing light. Phys Today 48: 34-40.
-
Tromberg B, Lanning R, Spinoza J, et al. (2000) Non invasive in vivo characterization of tumors using photon migration spectroscopy. Neoplasia 2: 26-40.
-
Rovati L, Bandera A, Donini M, et al. (2003) A novel tissue oxymeter combining the multidistance approach with an accurate spectral analysis. Proc IEEE/IMTC 1: 214-217.
-
Chia-Wei Sun, Ching-Cheng Chuang (2012) Hemodynamics Study Based on Near-Infrared Optical Assessment. In: Dr. A Seda Artis. Hemodynamics - New Diagnostic and Therapeutic Approaches. InTech pub: 47-89.
-
Ma H, Xu Q, Ballesteros J, Chance B (1999) Quantitative study of hypoxia stress in piglet brain by IO phase modulation oximetry. Proc SPIE 3597: 642-649.
-
Hueber D, Franceschini M, Ma H, et al. (2001) Non-invasive and quantitative near-infrared haemoglobin spectrometry in the piglet brain during hypoxic stress, using a frequency-domain multidistance instrument. Psy Med Bio 46: 41-62.
-
Franceschini M, Boas D, Zourabian A, et al. (2002) Near infrared spiroximetry: Noninvasive measurement of venous saturation in piglets and human subjects. J Appl Physiol 92: 372-384.
-
Hobrig H (2014) NIRS in clinical neurology - a 'promising' tool? Neuroimage 85: 535-546.
-
Piper SK, KruegerA, Koch P, et al. (2014) A wearable multi-channel fNIRS system for brain imaging in freely moving subjects. Neuroimage 85: 64-71.
-
Boushel R, Langberg H, Olesen J, et al. (2001) Monitoring tissue oxygen availability with near infrared spectroscopy (NIRS) in health and disease. Scand J Med Sci Sports 11: 213-222.
-
Crespi F, Donini M, Bandiera A, et al. (2006) Near infrared oxymeter biosensor prototype for non-invasive in vivo analysis of rat brain oxygenation: Effects of drugs of abuse. Journal of Optics A: Pure and Applied Optics l8: 528-534.
-
Ferrari M, Quaresima V (2012) A brief review on the history of human functional near-infrared spectroscopy (fNIRS) development and fields of application. Neuroimage 63: 921-935.
-
Bloom AS, Hoffmann RG, Fuller SA, et al. (1999) Determination of drug-induced changes in functional MRI signal using a pharmacokinetic model. Hum Brain Mapp 8: 235-244.
-
Stein EA (2001) fMRI: A new tool for the in vivo localization of drug actions in the brain. J Anal Toxicol 25: 419-424.
-
Warbrick T, Mobascher A, Brinkmeyer J (2012) Nicotine effects on brain function during a visual oddball task: A comparison between conventional and eeg-informed fMRI analysis. J Cogn Neurosci 24: 1682-1694.
-
Braun U, Muldoon SF, Bassett DS (2015) On human brain networks in health and disease. In: eLS, John Wiley & Sons, Ltd.
-
Matthews PM, Honey G, Bullmore ET (2006) Neuroimaging: Applications of fMRI in translational medicine and clinical practice. Nature Reviews Neuroscience 7: 732-744.
-
Linden DE (2012) The challenges and promise of neuroimaging in psychiatry. Neuron 73: 8-22.
-
Kleinschmidt A, Obrig H, Merboldt K, et al. (1996) Simultaneous recording of cerebral blood oxygenation changes during human brain activation by magnetic resonance imaging and near-infrared spectroscopy. J Cereb Blood Flow Metab 16: 817-826.
-
Ye JC, Tak S, Jang KE, et al. (2009) NIRS-SPM: Statistical parametric mapping for near-infrared spectroscopy. Neuroimage 44: 428-447.
-
Chen Y, Tailor DR, Intes X, et al. (2003) Correlation between near-infrared spectroscopy and magnetic resonance imaging of rat brain oxygenation modulation. Phys Med Biol 48: 417-427.
-
Sato H, Yahata N, Funane T, et al. (2013) A NIRS-fMRI investigation of prefrontal cortex activity during a working memory task. Neuroimage 83: 158-173.
-
Heng X, Springett R, Dehghani H, et al. (2005) Magnetic-resonance-imaging-coupled broadband near-infrared tomography system for small animal brain studies. Appl Opt 44: 2177-2188.
-
Toronov V, Webb A, Choi J, et al. (2001) Investigation of human brain hemodynamics by simultaneous near-infrared spectroscopy and functional magnetic resonance imaging. Med Phys 28: 521-527.
-
Toronov V, Webb A, Choi J, et al. (2001) Study of local cerebral hemodynamics by frequency-domain near-infrared spectroscopy and correlation with simultaneously acquired functional magnetic resonance imaging. Opt Express 9: 417-427.
-
Strangman G, Culver J, Thompson J, et al. (2002) A quantitative comparison of simultaneous BOLD fMRI and NIRS recordings during functional brain activation. Neuroimage 17: 719-731.
-
Schwarz A, Zocchi A, Reese T, et al. (2004) Concurrent pharmacological MRI and in situ microdialysis of cocaine reveal a complex relationship between the central hemodynamic response and local dopamine concentration. Neuroimage 23: 296-304.
-
Crespi F, Bandera A, Donini M, et al. (2005) Non-invasive in vivo infrared laser spectroscopy to analyse endogenous oxy-hemoglobin, deoxy-hemoglobin, and blood volume in the rat CNS. J Neurosci Methods 145: 11-22.
-
Crespi F (2007) Near-infrared spectroscopy (NIRS): A non-invasive in vivo methodology for analysis of brain vascular and metabolic activities in real time in rodents. Curr Vasc Pharmacol 5: 305-321.
-
Crespi F (2013) Parallel effect of nicotine and MK-801 on brain metabolism: An in vivo non invasive near-infrared spectroscopy analysis in rats. Current Synthetic and Systems Biology 1.
-
Reese T, Bjelke B, Porszasz R, et al. (2000) Regional brain activation by bicuculline visualized by functional magnetic resonance imaging. Time-resolved assessment of bicuculline-induced changes in local cerebral blood volume using an intravascular contrast agent. NMR Biomed 13: 43-49.
-
Marota JA, Mandeville JB, Weisskoff RM, et al. (2000) Cocaine activation discriminates dopaminergic projections by temporal response: An fMRI study in rat. Neuroimage 11: 13-23.
-
Mandeville JB, Jenkins BG, Kosofsky BE, et al. (2001) Regional sensitivity and coupling of BOLD and CBV changes during stimulation of rat brain. Magn Reson Med 45: 443-447.
-
Hoshi Y, Huang J, Kohri S, et al. (2011) Recognition of human emotions from cerebral blood flow changes in the frontal region: A study with event-related near-infrared spectroscopy. J Neuroimaging 21: e94-e101.
-
Kaufman M, Levin J, Maas L, et al. (1998) Cocaine decreases relative blood volume in humans: A dynamic susceptibility contrast magnetic resonance imaging study. Psychopharmacology 138: 76-81.
-
Raichle ME, Mintun MA (2006) Brain work and brain imaging. Annu Rev Neurosci 29: 449-476.
-
DE Atkinson DE (2014) Coupling agents in metabolism and as regulatory modifiers: The adenylate energy charge. In: HG Vogel Acad, Metabolic regulation: Metabolic pathways. (3rd edn), Press Lond, NY.
-
Girouard H, Iadecola C (2006) Neurovascular coupling in the normal brain and in hypertension, stroke, and Alzheimer disease. J Appl Physiol 100: 328-335.
-
S Neil Vaishnavi, Andrei G Vlassenko, Melissa M Rundle, et al. (2010) Regional aerobic glycolysis in the human brain. PNAS 107: 17757-17762.
-
Chen YI, Famous K, Xu H, et al. (2011) Cocaine self-administration leads to alterations in temporal responses to cocaine challenge in limbic and motor circuitry. Eur J Neurosci 34: 800-815.
-
Stein A, Fuller SA (1992) Selective effects of cocaine on regional cerebral blood flow in the rat. J Pharmacol Exp Ther 262: 327-334.
-
Schmidt KF, Febo M, Shen Q, et al. (2006) Hemodynamic and metabolic changes induced by cocaine in anesthetized rat observed with multimodal functional MRI. Psychopharmacology (Berl) 185: 479-483.
-
Breiter HC, Gollub RL, Weisskoff RM, et al. (1997) Acute effects of cocaine on human brain activity and emotion. Neuron 19: 591-611.
-
Kaufman MJ, Levin JM, Ross MH, et al. (1998) Cocaine-induced cerebral vasoconstriction detected in humans with magnetic resonance angiography. JAMA 279: 376-380.
-
Gillies RJ, Raghunand N, Karczmar GS, et al. (2002) MRI of the tumor microenvironment. J Magn Reson Imaging 16: 430-450.
-
Scholkmann F, Kleiser S, Metz AJ, et al. (2013) A review on continuous wave functional near-infrared spectroscopy and imaging instrumentation and methodology. Neuroimage 85: 6-27.
-
Crespi F, Cottini S, Bandera A, et al. (2016) In vivo real time non invasive monitoring of brain penetration of chemicals with near-infrared spectroscopy: Concomitant PK/PD analysis. J Neurosci Methods 258: 79-86.
-
Crespi F, Congestri F, Donini M (2018) Translational NIRS: Parallel Alteration of Brain Metabolism Following Alcohol Intake in Rodents and Man. J Neurodegener Disord 2: 22-31.
-
Matcher SJ, Kirkpatrick PJ, Nahid K (1995) Absolute quantification methods in tissue near-infrared spectroscopy. In: Optical Tomography, Photon Migration, and Spectroscopy of Tissue and Model Media: Theory, Human Studies, and Instrumentation. Event: Photonics West '95, San Jose, CA, United States, 2389.
Corresponding Author
Francesco Crespi, Biology Department, GSK Verona, Italy.
Copyright
© 2018 Crespi F, et al. This is an open-access article distributed under the terms of the Creative Commons Attribution License, which permits unrestricted use, distribution, and reproduction in any medium, provided the original author and source are credited.