Simulation of a Dry Magnetic Separation Plant
Abstract
A model is proposed to simulate the operation of a dry rotary drum magnetic separator. The model uses a probability distribution of the trajectories followed by the particles ejected from the rotating drum of the magnetic separator. Empirical relationships are used to relate the particle trajectories following their ejection to the drum rotation speed and magnetic field. The model is calibrated using the test results from a pilot scale magnetic separator and validated using data collected from an industrial dry magnetic concentration plant. The application of the model as implemented into a simulator is illustrated with control and optimization examples for a dry magnetic separation plant.
Keywords
Dry magnetic separation, Ilmenite, Magnetic susceptibility, Simulation
Introduction
Magnetic separation is widely used in mineral processing to separate valuable minerals from gangue minerals using the magnetic properties of the minerals [1]. It is also used for processing waste material as for the separation of polymer [2]. Magnetic separators can be divided into low and high intensity separators and high gradient magnetic separators [3]. Most of the low gradient magnetic separators are built as rotary drums that are operated in wet or dry conditions [4]. Few papers dealing with the modelling of wet magnetic separator are available in the literature [5-8] and less can be found on the modelling of dry magnetic rotary drum separators [9]. Most of these papers study the impact of the magnetic field on the mineral separation and few of them are dedicated to the simulation of a plant consisting of interconnected magnetic separator units. This paper proposes a mathematical model for a dry magnetic drum separator and shows the application of the model to simulate a magnetic separation circuit consisting of interconnected dry magnetic separators.
The paper is divided into 4 sections. The principle of dry magnetic separator is briefly described. This description is followed by a presentation of the operation of the plant considered in this paper. The principles of the model are then presented with some calibration results. The application of the model for the simulation of an actual plant is presented in the last section of the paper.
Principles of Dry Magnetic Separation and Available Process Models
Magnetic separation is used to separate materials that are magnetized in a magnetic field from materials that are not affected by the field. The way a mineral respond to a magnetic field is characterized by the relative magnetic susceptibility and by the magnetic susceptibility of the carrying fluid [1,10].
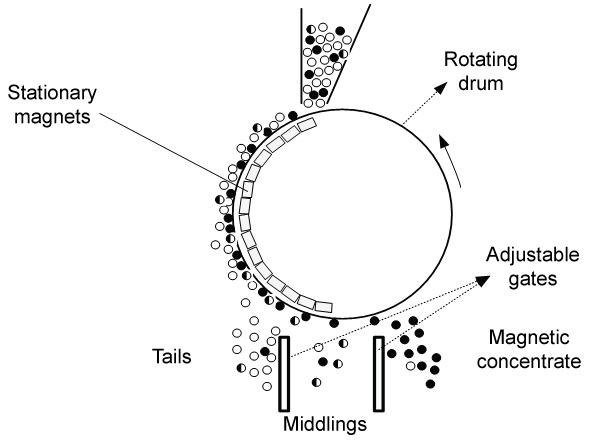
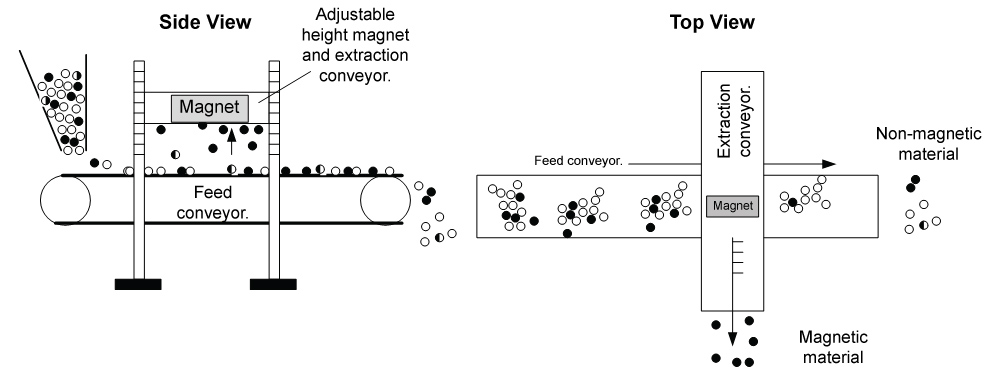
Various types of low and high magnetic field equipment's are used for magnetic separation [3]. This paper is concerned with the low intensity dry rotary drum magnetic separators shown in Figure 1. The material to be processed is distributed onto the surface of a drum that rotates in front of stationary magnets that generate a magnetic field. Particles stick to the drum and travel with the drum to a distance that varies according to their weight (size and density) and magnetic susceptibility. The magnetic susceptibility varies with the mineral composition and liberation [11]. It is expressed in m3/kg and can be measured using various instruments [12].
The speed of rotation of the drum and the position of gates (Figure 1) are adjusted to separate the particles into tailings, middlings and magnetic concentrate [9]. The effect of the speed of rotation is not discussed in many papers [9] indicates that recovery of magnetic materials is adversely affected by the speed of rotation of the drum while [3] and [4] report that improved capacity of the separator can be achieved by increasing the drum rotation speed [13] indicate that increasing the rotation speed increases the grade of the material in the magnetic concentrate, but negatively impacts the recovery. The strength of the magnetic field is determined by the type of permanent magnets installed on the separator. Increasing the strength of the magnetic field should increase the recovery of magnetic materials, although [9] reports a different correlation depending of the operating mode. Apart from mechanical problems the major disturbances for the operation of magnetic separators are the ore mineral composition, the ore texture (mineral grain size) and the size distribution of the feed particles. The degree of magnetization of valuable particles following a heat treatment is also a disturbance for the operation of a magnetic separation plant [14,15].
There are few publications dealing with the modelling of dry magnetic separators. Several authors give a fundamental description of the mechanisms [4] contributing to the separation of the minerals in a magnetic separator, although few of them seem to apply the proposed equations for the simulation of an actual process. [16] proposed a model for a crossbelt magnetic separator whose operating principle is different from a rotary drum separator [17] used a model based on mineral liberation for a wet magnetic separator [8] described a model for a wet high intensity magnetic separator that accounts for particle size and magnetic susceptibility [5] proposed a non-linear model for a wet rotary drum magnetic separator for the separation of magnetite and ferrosilicon. The model proposed by these authors does not incorporate the effect of particle size [9] described the use of neural networks for the simulation of a magnetic separation circuit. Most of the models presented in the literature analyze the behaviour of one particle in a magnetic field and few models are built to account for particles of different sizes and compositions. The model presented in this paper uses some of the ideas proposed by these researchers, but it is mainly developed from observations made on an actual ore and magnetic separation circuit.
Dry Magnetic Separation Plant
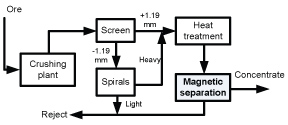
The dry magnetic plant considered in this paper processes an ilmenite (FeO.TiO2) ore with non-sulphide gangue consisting mainly of plagioclase, aluminate and silicate minerals. The ore is crushed down to -6.4 mm (¼ in) and the fine fraction (-1.2 mm) is processed in spirals to concentrate fine ilmenite particles that join the coarse fraction of the ore to feed the rotary kilns used to magnetize the ilmenite. The heat-treated ore feeds the magnetic separation plant to produce a concentrate that is subsequently smelted to produce cast iron, steel and a titanium oxide slag. The heat treatment increases the magnetic susceptibility of ilmenite while the magnetic susceptibilities of other gangue minerals are slightly affected. The detailed composition of the ore is not given for sake of confidentiality as requested by the company.
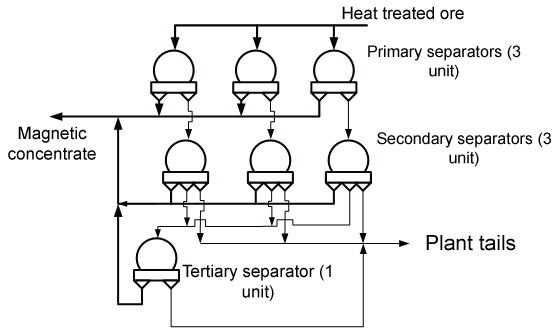
The magnetic separation circuit of the plant is shown in (Figure 2). The feed to the primary separators is the heat-treated ore. The primary separation is carried out in three parallel dry magnetic separators. The reject of the primary separators is gravity fed to three secondary dry magnetic separators. The secondary units yield a concentrate of magnetic material that is combined with the primary magnetic separator concentrate and a middling stream that feeds one tertiary magnetic separator (scavenger) and a reject directed to the plant tailings. The concentrate from the third magnetic separator is combined with the primary and secondary concentrates.
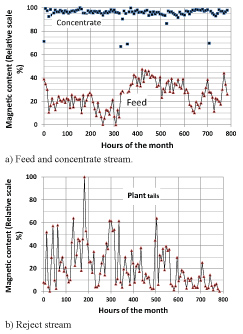
Some operating trends showing the ilmenite contents of the feed, reject and concentrate streams are presented in (Figure 3). The trends are shown as relative values of the maximum and minimum observed for the stream as required by the company. Trends clearly show that high tailings grades or low recoveries are observed on a regular basis indicating a possible control problem. The source of the variability is either due to the ore mineralogy and/or to a problem of heat treatment prior to the magnetic separation (Figure 4).
The development of a simulation tool for the magnetic separation circuit of (Figure 2) should allow assessing the distribution of flows within the circuit using information on the circuit feed particle size and mineral composition. Such simulation tool could then be used to study strategies to manipulate the drum rotation speed and the position of the gates of the separators to compensate disturbances caused by changes of feed mineralogy, grade and quality of the ore heat treatment (Figure 4). The long-term objective is directed toward the economic optimization of the process and the development of a dynamic simulator for designing advanced control strategies.
The main difficulty of the project is related to the calibration of the model. Usually models are calibrated using data collected in the plant to be modelled but in this case, sampling of the magnetic separation circuit is difficult due to limited space and access to sampling points. The proposed model is then built from tests carried out on a pilot plant magnetic separator and used to simulate the industrial units.
Model for a Magnetic Rotary Drum Separator
A rotating drum magnetic separator classifies the ore particles as a function of their size and magnetic susceptibility [8] according to the operating conditions of the equipment, namely the speed of rotation of the drum, the magnetic field and the feed rate. The principle of the model is first discussed followed by the calibration procedure.
Model basis
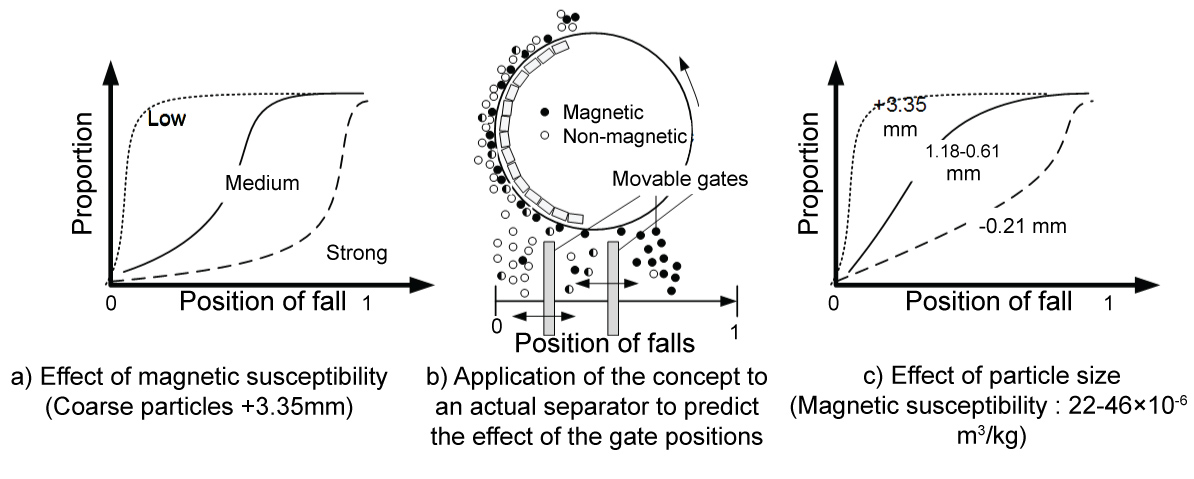
The sorting of the particles by a rotary drum is a consequence of the projection distance of the particles as illustrated in (Figure 5). The projection distance varies with the particle weight and magnetic susceptibility [18]. The position of falls illustrated in Figure 5 gives the distance of the projections of the particles from a zero-position corresponding to non-magnetic particles to a maximum position for magnetized particles. The position of the falls varies with the particle size and magnetic susceptibility (Figure 5) as well as the operating conditions of the drum. The position of the gates is used in conjunction with the distribution of the fall positions to predict the characteristics of the concentrate, reject and middling's streams.
The proportion of the particles that belong to a size class i and to a magnetic susceptibility class j that fall within a distance between 0 and z is noted Gi;j;z (S,H,W). The speed of rotation of the drum is noted S, H is the magnetic field and W the solids feed rate to the drum separator. The variable Gi;j;z (S,H,W) is either deduced from an analysis of the mass and momentum conservation equations acting on each particle [6,19] or by experimentation as in the approach followed in this paper.
Once the function for the distribution of falls is obtained the application of the model for the simulation of a dry magnetic separator is straightforward. Indeed, the flow of the particles within a size/magnetic susceptibility class that are projected between the positions of fall 0 and z is given by (1)
Where WF is the separator solids feed rate and xi;j;F the proportion of the feed (subscript F) material that belongs to the size/susceptibility magnetic class i;j. The total solids flow of particles that fall between 0 and z is given by (2)
The concentration of a size/magnetic susceptibility class in the material that falls between positions 0 and z is given by (3)
If the mineral composition of the size/magnetic susceptibility class is available, the concentration of a mineral species (m) that falls between 0 and z is calculated using (4)
Where is the concentration of mineral m within the i;j size/magnetic susceptibility class of the magnetic separator feed stream. The mineral contents are converted into elemental concentrations using the chemical composition of the minerals.
As illustrated in (Figure 1 and Figure 5) the gates of a separator are used to separate the particles into streams of reject, middlings and concentrate. Therefore by adjusting the value of z to gate positions it is possible to simulate the operation of a magnetic drum separator from the knowledge of the ore distribution within the size/magnetic susceptibility class, i.e. .
Classification of the ore into size and magnetic susceptibility classes
The characterization of the ore as a function of particle size is done by sieving. For the studied ore the feed is divided into the 6 size intervals identified in (Table 1). The ore to be characterized is divided into size fractions that are processed independently to classify the particles into magnetic susceptibility classes. Various instruments can be used to measure the magnetic susceptibility of the particles [12, 20] but in this application it is necessary to separate the ore into magnetic susceptibility classes for a subsequent chemical analysis of the material in the class. This is done using an instrument similar to the one utilized by [2,16]. A simplified schematic of the instrument is shown in (Figure 6) and a detailed description of the instrument is given by [21]. The measurement of the magnetic susceptibility is an iterative procedure. The material of one size interval is firstly processed with the magnet at a high position (Figure 6) to recover the most magnetic susceptible particles. The ore that is not attracted by the magnet is then reprocessed with the magnet at a lower position, and the procedure is repeated for the magnet heights identified in (Table 1). These heights are then converted into the magnetic susceptibility given in (Table 1) [21]. The operation is repeated for all the considered size intervals. The method is sensitive to the speed of the conveyors and the same operating conditions are used throughout the process to ensure a reproducible division for the processed samples. A similar method is used by [15] to assess the effect of the heat treatment on the magnetization of ilmenite.
The material recovered in each size/magnetic susceptibility class is weighted and assayed using X-ray fluorescence for chemical species. These assays are converted into the main mineral contents of the ore using a procedure similar to that described by [22]. A typical data set obtained from this procedure is shown in (Table 2). As indicated before, the magnetic susceptibilities of the gangue minerals are different and significantly less than that of heat-treated ilmenite. The size distributions of the valuable and gangue the mineral particles also play a role in the mineral separation. This data corresponds to in Eq. 4.
Estimation of the distribution of falls for a magnetic separator
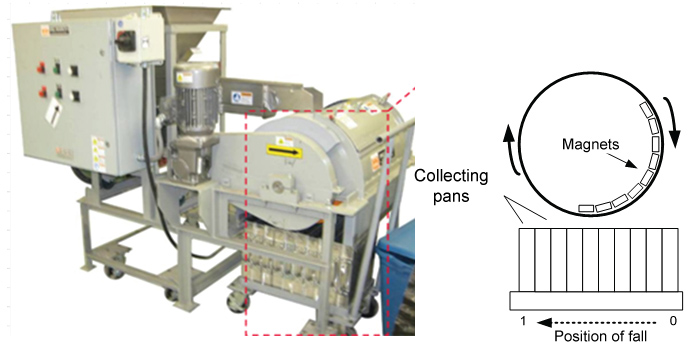
The G_(i;j;z) (S,H,W) distribution of falls is the key parameter of the model. As indicated earlier the distribution function is experimentally measured rather than estimated using a fundamental analysis of the forces acting on the particles as they travel on the rotating drum of a magnetic separator unit. The approach followed here consists of carrying the tests using the pilot plant magnetic separator shown in (Figure 7). The separator has a 38 cm diameter drum and allows a division of the distribution of falls into 10 streams. The use of a pilot scale unit facilitates the estimation of the effect of the drum rotation speed, magnetic field and feed rate on the distribution of falls.
The estimation of the distribution of falls is carried out using a representative 2-3 kg sample of the ore to be processed in the magnetic separation plant. A 0.5 kg subsample is extracted from the original ore sample and processed to obtain the size/magnetic susceptibility distribution of the feed particles as discussed in the previous section. The remaining sample is used to feed the separator of (Figure 7). The magnetic field and the drum speed of the pilot separator can be adjusted to scan of wide range of operating conditions. The pilot separator is fed by the top and the discharge is collected into 10 parallel pans that are subsequently used to characterize the position of fall of the particles (Figure 7). The samples collected in the pans are then analyzed to obtain the size/magnetic susceptibility distribution of the particles.
The data for a test is slightly redundant and the measurements are reconciled to obtain the mass splits and assays that verify the mass conservation constraint [23].
The distribution of falls is readily calculated from the reconciled data using (5):
Where is the mass of ore in pan k and is the proportion of ore in pan k that belongs to the i;j size/magnetic susceptibility class. The ^ indicates a mass balance reconciled estimate and the subscript F indicates the feed stream. The value of z (position of fall) is calculated from the position of the collecting pans (Figure 7).
Experimental test work conducted on the pilot plant magnetic separator (Figure 7)
The effects of the separator operating conditions on the distribution of falls are assessed for the twelve considered experimental conditions described in (Table 3). The drum rotation speed is varied from 24 to 96 m/min and the magnetic field from LOW to HIGH, with the HIGH level being 1.3 × LOW level. The company required to keep confidential the magnetic field. The feed rate is varied from 2 to 60 kg/min.
Observed distributions of falls
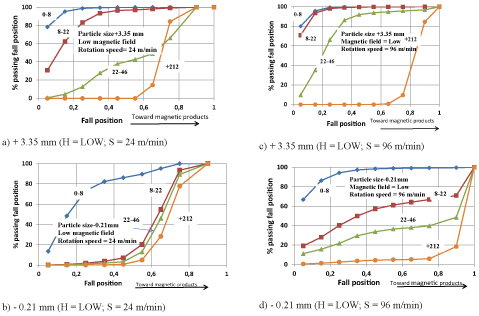
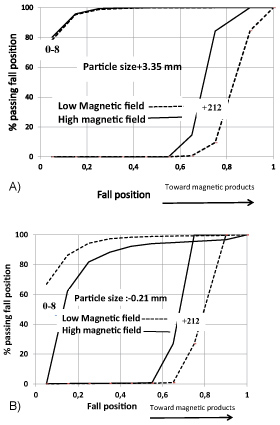
Some observed distributions of falls obtained using two drum rotation speeds for the Low magnetic field strength are shown in (Figure 8). The distributions of falls are presented as a function of the magnetic susceptibility of the particles rather than as a function of particle size [17]. The distribution of falls for particles of +3.35 mm and -0.21 mm obtained with a drum rotation speed of 24 m/min and a LOW magnetic field are shown in (Figure 8a and Figure 8b). The distribution of falls is influenced by the magnetic susceptibility of the particles although particle size also modulates the shape of the distribution of falls. The magnetic susceptibilities are indicated on the graphs. For instance, 100% of the coarse particles (+3.35 mm) with a weak magnetic susceptibility (0 to 8 × 10⁻⁶ m3/kg or 0 to 8 cm3/kg) fall within the first four pans (non-magnetic material) while particles of less than 0.21 mm with the same magnetic susceptibility fall in the pans corresponding to a magnetic product. This is probably due to non-selective entrainment of fine particles by coarse magnetic particles. The observed distributions of falls also show that for a low magnetic (0-8 cm3/kg) susceptibility fine particles have a stronger probability to report to the concentrate than coarse particles due likely to a mechanical entrainment by magnetic particles. Particles of intermediate sizes (not shown in Figure 8) exhibit an intermediate behaviour between the coarse and fine particles.
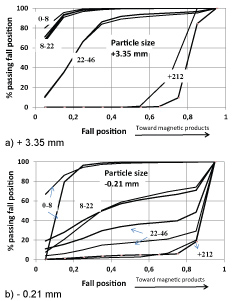
Increasing the drum rotation speed from 24 (Figures 8a and Figure 8b) to 96 m/min (Figures 8c and Figure 8d) influences the distribution of falls. Coarse particles (+ 3.35 mm) with a weak magnetic susceptibility are more efficiently rejected at high drum rotation speed. On the other hand coarse particles with a high magnetic susceptibility are projected toward magnetic pans more efficiently at high rotation speed [13] also reported a combined effect of the rotation speed and the ore particle size, but these authors did not incorporate the magnetic susceptibility of particles in their analysis. The distribution of falls for fine particles is also affected by the rotation speed of the drum. The graphical analysis of the behaviour of the particles is complicated by the fact that both size and magnetic susceptibility influence the distribution of falls. Since the purpose of the experimentation program is to calibrate a model for the magnetic rotary drum concentrator to be used in a plant simulator, and not necessary to generate a fundamental analysis of the behavior of the particles in a magnetic field, the discussion is limited here to the presentation of the results of the experiments.
The effect of the magnetic field on the particle projections is shown in (Figure 9) for two particle sizes with low and high magnetic susceptibility. The effect of the magnetic field is more important for fine particles (- 0.21 mm) than coarse (+ 3.35 mm). Increasing the magnetic field slightly increases the distance of falls of the particles within a low magnetic susceptibility class. The particles with a strong magnetic susceptibility behave in a different manner than the particles with a lower magnetic susceptibility as the increase of the magnetic field leads to slightly shorter projections for these particles. This is felt to be caused by the fact that the magnetic field opposes a stronger resistance to the projection of the particles as they escape the drum. These results are consistent with a discussion presented by [24] concerning the strength of the magnetic field for a HGMS (High Gradient Magnetic Separator).
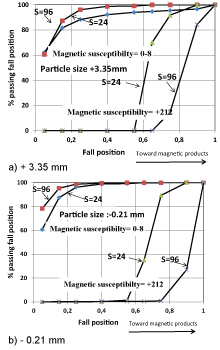
The effect of the drum rotation speed for a HIGH magnetic field is shown in (Figure 10) for fine (- 0.21 mm and coarse (+ 3.35 mm) particles. Increasing the drum rotation speed increases the distance of the projections of particles with a strong magnetic susceptibility (+ 212 cm3/kg) and reduces the projection distance of weakly magnetic susceptible particles (0-8 cm3/kg). This action promotes recovery and grade of the magnetic product as recognized by [13]. Tuning of the rotary drum speed is thus an efficient way to modulate the recovery of particles with intermediate magnetic susceptibility. This is one reason for which the drum rotation speed and position of the gates on the magnetic separator are commonly used for the control of these units [21].
The effect of the feed rate for a LOW magnetic field and a drum rotation speed of 96 m/min is shown in (Figure 11). The effect of the feed rate on the particle projections is marginal for the considered test range. The absence of significant effect may have been caused by the considered speeds of rotation that have limited the thickness of material on the drum surface and reduced the entrainment of fine particles or the resistance to the projection of particles of intermediate size. The situation may however be different in the case of drum overloading as the drum speed of rotation and geometry influence the capacity of the separator [3].
There are few papers dealing with the effect of particle size and magnetic susceptibility on dry magnetic separation and even less papers dealing with the effect of the operating parameters of a rotary drum magnetic separator as a function of these particle characteristics. The results shown here indicate that the behaviour of the particles in the magnetic field of a rotary drum should be analyzed by accounting for their size and magnetic susceptibility and not using only particle size as this variable is readily measured [11,13]. [11] found that recovery of gangue in a wet magnetic separator increases with increasing particle size. The effect is attributed to insufficient liberation of gangue and magnetic minerals. However, the maximum particle size in the feed of the magnetic separator used by Ersayin is less than 0.15 mm which is finer than the finest considered size interval of -0.21 mm in the study presented here [13] suggest also a liberation effect to explain the improved recovery achieved using a Dry High Intensity Magnetic Separator applied to a hematite-limonite iron ore.
Empirical model for the distribution of falls
The distribution of falls is modelled using the "S" shape empirical function [25] of Eq. 6
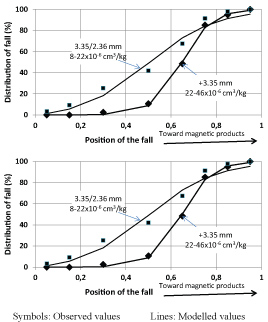
The fall position is given by z that takes a value between 0 and 1 which is a normalized position between the position of fall of non-magnetic and magnetic materials (Figure 7). The adjustable parameters for each size interval i and magnetic susceptibility class j are and . The describes the sharpness (slope) of the separation curve for the particles in the i;j class. The larger the the steepest is the distribution of falls. The parameter z50 gives the position that receives 50% of the particles of the magnetic susceptibility class j in a size interval i. The closer to 1.0 is the z50 parameter, the less the tendency of the particles to fall into the non-magnetic (tailings) compartments. Two typical examples of curve fitting results are shown in (Figure 12). The calibration for the magnetic susceptibility class 22-46 × 10-6 m3/kg of the + 3.35 mm particles yields good results while the "S" shape empirical model of Eq. 6 may not be adequate for the 8-22 × 10-6 m3/kg and 3.35/2.36 mm class of particles which exhibits a linear and not a S shape distribution of falls.
Size class:
1 = + 3.35 mm
2 = 3.35/2.36 mm
Susceptibility class:
2 = 22-46 × 10-6 m3/kg
3 = 8-22 × 10-6 m3/kg
z: position of fall
The next step in the model calibration is to relate the β(i;j) and z(50;i;j) parameters to the magnetic separator operating conditions, i.e. the feed rate, drum rotation speed and magnetic field. A step wise regression method is used to extract the operating variables that have an impact the distribution of falls. A total of 36 regressions (6 for the particle size classes times 6 for the magnetic susceptibility classes) provide the parameters of the empirical models for the (Eq. 7) and parameters (Eq. 8)
Where S, H and W stand respectively for the drum rotation speed, magnetic field and feed rate to the separator. The bk parameters are calibrated by a standard regression technique. The estimated dependencies between the parameters and the speed of rotation are provided in (Tables 4 and Table 5). A plus sign (+) indicates that the parameter value increases significantly with the corresponding operating condition, while a minus sign (-) indicates a significant decrease of the parameter with increasing the operating condition. A zero (0) indicates that the parameter is not significantly affected by the operating variable. For instance, the z50 for the + 3.35 mm particles in the magnetic susceptibility class 0-8 × 10⁻⁶ m3/kg is negatively affected by the separator rotation speed but its value is not significantly influenced by the magnetic field nor the feed rate. It was not possible to establish any significant influence of the tested factors the parameter of the model [21]. The results of (Tables 4) are valid for the range of tested conditions given in (Table 3).
The results of Table 4 show that the z50 can be manipulated through an action on the drum rotation speed. The direction (sign) of the action changes with the magnetic susceptibility. Indeed increasing the drum rotation speed should reject more efficiently particles with a low magnetic susceptibility (0 to 8 × 10⁻⁶ m3/kg), while it positively affects the recovery of particles with a higher magnetic susceptibility. The magnetic field has a significant influence on the z50 of particles within the 8 to 22 × 10-6 m3/kg magnetic susceptibility class which is the only class that does not exhibit a correlation with the drum rotation speed. The effect of the magnetic field appears to be non-significant for the other magnetic susceptibility classes. The effect of the feed rate on the z50 is not significant for the tested range of operating conditions. The shape of the separation curves, i.e. the β parameter, is not significantly influenced by the operating conditions.
Implementation of the Model into a Simulator
The implementation of the dry rotary drum magnetic separator model into a simulator is described and some simulation results are presented to validate of the method and illustrate its application for process control and optimization.
Simulator of the magnetic separation plant
Each magnetic separator of the plant of (Figure 2) is modelled using a distribution of falls of the particles that is calculated from the empirical models of Eq. 6 for which the z50 and β parameters are calculated from the drum rotation speed, the magnetic field and the feed rate as per Eqs. 7 and 8.
The flow and characteristics of the feed to the secondary separators are dependent of the operation of the primary separators so it necessary to simulate the primary units whose reject becomes the feed of the secondary separators. Similarly, the secondary units should be simulated to obtain the middling stream composition that feeds the tertiary separators. Since there is no circulating load the programming of the simulator is straightforward and Microsoft TM Excel is used for that purpose.
The input variables for the simulator of the circuit of (Figure 2) are:
The feed rate to the primary separators;
The size/magnetic susceptibility distribution of the particles in the feed and the mineral composition of the particles within each size/magnetic susceptibility class as given in (Table 3);
The positions of the gates on the primary, secondary and tertiary separators of (Figure 2) that are used in conjunction with the distribution of falls to estimate the reject, concentrate and middling streams;
The drum rotation speed of the primary, secondary and tertiary separators of (Figure 2);
The magnetic field generated by the permanent magnets of the primary, secondary and tertiary separators of (Figure 2).
Validation of the simulator
The data of only one sampling campaign is available for the circuit of (Figure 4) and it is compared to the simulation results in (Table 5). The mass flow rates and species concentrations are given in relative values of measured minimum and maximum values observed for each variable. Results are satisfactory considering that the distribution of falls are calibrated with data obtained from tests conducted on a pilot magnetic separator rather than using data collected from the plant as it is usually the case. The main discrepancy is found for the middling stream of the secondary separators which impacts the quality of the simulation results for the tertiary separator. The reasons for this discrepancy are not yet identified but it is felt to be caused by the nature of the material flowing in this stream. Indeed the processed material may contain unliberated particles which are not included in the description of the ore in the current version of the model.
A preliminary process optimization study
There are seven variables that can be manipulated by the operators to adjust the operation of the circuit:
The drum rotation speed of the primary separators;
The position of the reject gate of the primary separators;
The drum rotation speed of the secondary separators;
The position of the reject gate of the secondary separators;
The position of the middling gate of the secondary separators;
The drum rotation speed of the tertiary separators;
The position of the reject gate of the tertiary separators.
It is assumed that the action taken to the primary and/or secondary separators is the same on the three parallel units (Figure 2). The magnetic field is not modified as it would require to change the magnets on the separators. The simulator is used to study the impact of these operating variables on the circuit concentrate grade and recovery of magnetic minerals.
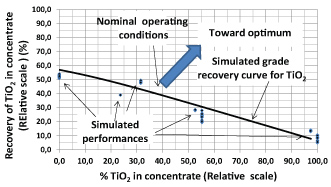
This analysis was carried out starting with the nominal operating conditions given in (Table 6). Then a 27 factorial design or 128 tested conditions [26] with the 7 identified operating variables is applied to the simulator. The variations applied to the factors are given in (Table 6) and range from 5 to 10% of their nominal value. Each condition of (Table 6) is applied to the simulator and the simulated concentrate grade and circuit recovery values are recorded for the analysis. Using the 128 simulation results, it is possible to construct the grade recovery map for TiO2 shown in (Figure 13). The results show that the nominal operating condition lies on a grade recovery line and that the applied changes to the operating variables are not sufficient to push the operation toward a more optimum region (Figure 13). Such displacement may require a modification to the grind size or to the heat treatment of the ore. The simulation result is an indication that for a given circuit feed (mineral liberation and magnetic susceptibility induced by the heat treatment) the current tuning of the operating variables is adequate and the circuit performances could hardly be improved by the sole manipulation of the operating variables.
Control against process disturbances
The magnetic separation plant is subjected to various process disturbances with the most frequent ones being a reduction in the quality of the heat treatment and a change in the feed grade/mineralogy [21]. The usual practice to cope with these problems is to act on the drum rotation speed of the secondary and tertiary separators. Since the primary separators are responsible for most of the plant recovery of valuable minerals an action on the primary units could possibly help in reducing the impact of a disturbance. Only the control action taken on the primary separators is studied using the simulator.
The nominal conditions reproduced in (Table 7) are used as benchmark for the comparison. The concentration of magnetic minerals in the feed is set to its nominal value which leads to a plant concentrate grade and recovery on target after the heat treatment. The impact of a disturbance consisting of an uncontrolled decrease of the heat treatment temperature is simulated [21] and produces a 9.5% recovery drop due to insufficient magnetization of the ilmenite (Table 7). This result is consistent with some operating trends shown in (Figure 3). Simulation indicates that the problem can be compensated by increasing the primary separator speed and closing the gate to bring the concentrate grade to + 0.1% above target with a recovery of 0.9% below the target (Table 7) which is significantly better than the performance for the uncontrolled case.
The second considered case is a 2.8% decrease of the ilmenite content in the separation plant feed without disturbances to heat treatment. The simulation shows that if no action is taken on the circuit operation the concentrate grade falls 0.4% below the target with a recovery loss of 0.1%. Simulation shows that the decrease of the valuable content of the separation plant feed can be compensated by reducing the rotation speed of the primary separator drum to increase the recovery of materials with intermediate magnetic susceptibilities and by opening the gate to compensate the negative impact of reducing the speed on the primary separator concentrate grade. These actions bring the plant concentrate grade back to the target grade but at the expenses of a recovery loss of 0.4% (see Table 7) compared to the target value.
Conclusion
A model for a dry magnetic rotary drum separator is proposed and used to simulate a magnetic separation circuit for an ilmenite ore. The simulator is calibrated with data from tests conducted on a pilot plant magnetic separator rather than by using data from the sampling of the actual plant. The approach gives good results providing that the ore is characterized according particle size and magnetic susceptibility. The use of a description of the position of falls as function of particle size and magnetic susceptibility that is related to the magnetic separator operating conditions is a prerequisite to simulate the effect of the position of the gates on the performances of the equipment. Work is now progressing to extend the model to wet magnetic rotary drum separators that are commonly used in the iron ore industry.
The proposed model is used to simulate the operation of a circuit consisting of several interconnected magnetic separators and was used to simulate various options to improve the control of the plant. In the light of the obtained results the plant is now revising the control strategies currently used for the circuit.
Acknowledgements
The authors would like to acknowledge Rio Tinto Fer et Titane for its support and permission to publish the paper.
References
- Brophy JH (1985) Elementary theory of magnetic properties of solids, Handbook of mineral processing. In: NL Weiss, Society of Mining Engineers, 6-16.
- Bakker Ej, Rem PC, Fraunholcz N (2009) Upgrading mixed polyolefin waste with magnetic density separation. Waste Manag 29: 1712-1717.
- Gillet G (2008) Séparation magnétique à basse et haute intensité. Techniques de l'ingénieur J.
- Oberteuffer JA (1974) Magnetic separation : A review of principles, devices, and applications. IEEE Trans on Magnetics10: 223-238.
- Rayner JG, Napier Munn TJ (2003) A mathematical model of recovery of dense medium magnetic in the wet drum magnetic separator. Int J Miner Process 69: 157-173.
- Zheng X, Wang Y, Lu D (2015) A realistic description of influence of the magnetic field strength on high gradient magnetic separation. Minerals Engineering 79: 94-101.
- Stener JF, Carlson JE, Palsson BI, et al. (2016) Direct measurement of internal material flow in a bench scale wet low-intensity magnetic separator. Minerals Engineering 91: 55-65.
- Tucker P (1994) Modelling wet high intensity magnetic separation: A case study. Minerals Engineering 7: 1281-1300.
- Singh V (2009) Connectionist approach for modeling the dry roll magnetic separator, Minerals & Metallurgical Processing 26: 127-132.
- Jiles D (1990) Introduction to magnetism and magnetic materials. Chapman & Hall, London.
- Ersayin S, Bond WM, Arola J, et al. (2009) Simulation assisted performance improvements in iron ore processing plants. Minerals & Metallurgical Processing 26: 41-48.
- Leissner T, Bachmann K, Gutzmer J, et al. (2016) MLA-based partition curves for magnetic separation. Minerals Engineering 94: 94-103.
- Zhang H, Chen L, Zeng J, et al. (2015) Processing of lean iron ores by dry high intensity magnetic separation. Separation Science and Technology 50: 1689-1694.
- Cui Z, Liu Q, Etsell TH (2002) Magnetic properties of ilmenite, hematite and oilsand minerals after roasting. Minerals Engineering 15: 1121-1129.
- Allen NR (2003) Effect of roasting temperature on the magnetism of ilmenite. Physical Separation in Science and Engineering 12: 103-121.
- Strandling AW (1991) Development of a mathematical model of a crossbelt magnetic separator. Minerals Engineering 4: 733-745.
- Ersayin S (2004) Low intensity magnetic separator modelling: A pseudo liberation approach. Mineral Processing and Extractive Metallurgy 113: 167-174.
- Rayner JG, Napier Munn TJ (2000) The mechanism of magnetic capture in the wet drum magnetic separator. Minerals Engineering 13: 277-285.
- Mohanty S, Das B, Mishra BK (2011) A preliminary investigation into magnetic separation process using CFD. Minerals Engineering 24: 1651-1657.
- Cavanough GL, Holtham PN, Powell TM, (2006) Magnetic susceptibility measurement applied to minerals industry. Minerals Engineering 19: 1588-1595.
- Bertrand C (2010) Modélisation de la séparation magnétique de basse intensité sur tambours rotatifs : Enrichissement du minerai Havre Saint-Pierre de Rio Tinto. Fer et Titane, MSc Thesis, Dept of Mining, Metallurgical and Materials Engineering, Laval University, QC.
- Whiten B (2007) Calculation of mineral composition from chemical assays. Mineral Processing & Extractive Metalurgical review 29: 83-97.
- Hodouin D, Everell MD (1980) A hierarchical procedure for adjustment and material balancing of mineral processes data. International Journal of Mineral Processing 7: 91-116.
- Svoboda j (2001) A realistic description of the process of high-gradient magnetic separation. Minerals Engineering 14: 1491-1501.
- Lynch AJ (1977) Mineral crushing and grinding circuits : Their simulation, optimisation, design and control. Elsevier Scientific, Amsterdam.
- Box GEP, Draper NR (1969) Evolutionary Operation. John Wiley & Sons, Inc.
Corresponding Author
Claude Bazin, Department of Mining, Metallurgy and Materials Engineering, Laval University, Quebec City, Canada.
Copyright
© 2018 Bertrand C, et al. This is an open-access article distributed under the terms of the Creative Commons Attribution License, which permits unrestricted use, distribution, and reproduction in any medium, provided the original author and source are credited.