Risk Comprehension at a Minority-Majority Urban Academic Institution
Abstract
Introduction
There is a growing shift toward the promotion of shared decision making in clinical practice. Currently, medical risk is often communicated to patients in the form of percentages, although there is no evidence that this is the most effective method to deliver this information. Moreover, all patients are often counseled in a similar way regardless of their race, cultural background, or education level. We hypothesize that there is a significant difference in comprehension of risk based upon the method of risk presentation.
Methods
Healthy females between the ages of 18 and 65 presenting to Jackson Memorial Hospital's Ambulatory Care Center Gynecology Clinic for a well-woman visit were given a 10-question survey comprised of a variety of mathematical questions to assess a patient's understanding of risk. Descriptive statistics were used to analyze the data. One hundred ninety patients agreed to participate, the mean age was 43.97 (SD 13.2). One hundred thirty-three (69.27%) are Hispanic, thirty-eight (19.79%) are African American; four are Caucasian (2.08%). Twenty-four (12.5%) had not completed high school.
Results
No significant difference in total number of correctly answered questions was found based on age group or race. There is a significant difference in the total number of questions answered correctly (p < 0.01) and ability to answer percentage based survey questions (p < 0.01) based on level of education. No difference was found between education level and ability to answer questions that described risk in terms of fractions (p = 0.25). When comparing the variance between race and type of question, the smallest variance (σ = 0.011) was found in questions that described risk as fractions.
Conclusions
When presenting risk related information to patients, fractions compared to percentages, are more widely understood. We recommend the use of fractions when counseling patients regarding medical risk.
Keywords
Risk, Comprehension, Consent, Percentage, Fraction
Introduction
There is a growing shift toward the promotion of shared decision making in the clinical practice where clinicians and patients make decisions together using the best available evidence. Patients are encouraged to think about the options and the likely benefits and harms of each so that they can communicate their preferences and help select the best course of action [1]. In fact, studies have shown that being an actively engaged participant in one's care has been associated with better health outcomes [2-4]. Research has also shown that improvement of shared decision making is especially important in the field of Obstetrics and Gynecology where sensitive reproductive health decisions are made [5].
The efficacy of shared decision making is largely dependent upon the clinician's ability to effectively communicate evidence based medical information to patients so they can make informed medical decisions. Information regarding risk is often presented numerically, however research and standardized testing show that patients vary in their ability to comprehend numerical risk [6]. Limited understanding of these risks can be harmful in the context of medical decision making and can have major implications regarding health care [7].
There are many factors that influence how patients understand numerical risk, including age, level of education, culture, race, and gender. Compared to younger age individuals, older adults tend to process information less efficiently [8]. Additionally, the population most likely to undergo operations as well as take prescription drugs is adults older than 60 years of age [9], so it is imperative that healthcare professionals can communicate potential adverse events effectively to this age group.
It is important to consider the background of the patient. Race has shown to be a significant factor in the comprehension of risk. In study evaluating adult health literacy, it was reported that White and Asian adults had higher average health literacy than Black, Hispanic, American Indian, and Multiracial adults [10]. Our study was performed in Miami, a diverse, metropolitan population with residents from many cultural backgrounds. It is a minority-majority city with 51% of its residents being foreign born [11]. However, the factor that may play the largest role in health literacy is patient education level. It has been found that less numerate individuals tend to rely more heavily on emotions and their connection with their physician when making medical decisions, whereas individuals with a more numerical background pay more attention to numbers and statistics [12].
It is unknown how to best present numerical risk to patients. The American College of Obstetricians and Gynecologists (ACOG) provides an excellent source for patient education and describes complications of various procedures [13]. However, ACOG uses descriptive words such as "some" or "many" [14-16], instead of using numerical risk. While these descriptors give patients an idea about risk, they do not provide concrete information. In fact, descriptive words are commonly used in medicine and when surveyed, physicians report feeling more comfortable providing verbal estimates of risk than numerical. This most likely is due to a physician's lack of understanding of the patient's inherent knowledge of numerical values [17].
The primary objective of our study is to understand numerical risk comprehension in a diverse, female patient population. We hypothesize that there is a significant difference in comprehension of risk based upon age, race, and education level as well as the method of presentation of risk.
Materials and Methods
Healthy females between the ages of 18 and 65 presenting to Ambulatory Care Center Gynecology Clinic for a well woman visit were invited to participate in this study. A member of the research team explained the study to the patient and written informed consent was obtained. Patients were instructed to complete the survey including no identifying information, and the surveys were placed in a folder sealed and handed to a research team member.
Demographic information was obtained. The demographics of our sample closely mimic the demographics of Miami, the urban center at which the study was performed. The survey was comprised of 10 questions that assessed comprehension of percentages and fractions in the context of medical risk information (Appendix 1). Data analysis included descriptive and inferential statistics. Statistical analysis included chi squared testing in order to compare whether various races, levels of education or ages affected a patient's ability to understand different types of questions. ANOVA analysis was used to analyze significant differences in mean questionnaire performance in the patient population. The Institutional Review Board at the University of Miami Miller School of Medicine (Miami, FL) approved the study. One hundred ninety patients agreed to participate in our study. One hundred thirty-three (69.27%) are Hispanic, thirty-eight (19.79%) are African American, and four are Caucasian (2.08%). Twenty-four (12.5%) patients had not completed high school, 43% had some form of college education, and 7% obtained postgraduate degrees. The mean age is 43.97 (SD 13.2) (Table 1).
Results
There is no significant difference in total number of correctly answered questions based on age group (p = 0.23) or race (p = 0.67). There is a significant difference in the total number of questions answered correctly based on level of education (p < 0.01). The highest percentage (65.65%) of questions answered correctly was when risk information was presented as fractions when compared to when presented as percentages (60.32%) or in mixed type question (52.86%). Mixed type questions demonstrate the patients' understanding of fractions and percentages, often requiring the patient to convert between. No significant difference (p = 0.25) was found between education level and ability to answer questions that described risk in terms of fractions, while there was a significant difference (p < 0.01) in education level and ability to answer percentage or mixed-type questions (Table 2).
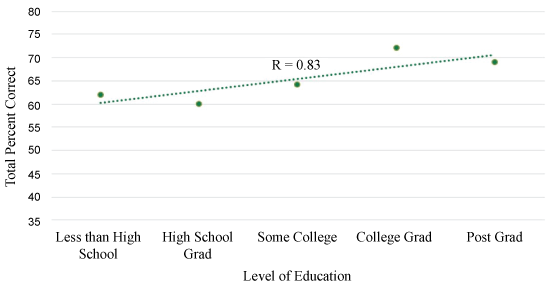
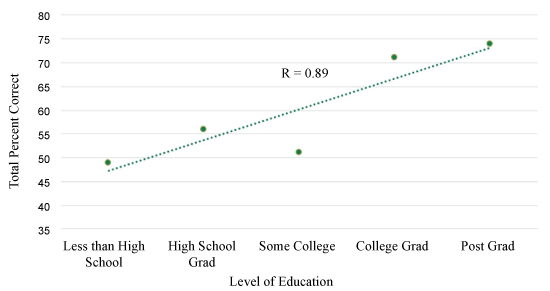
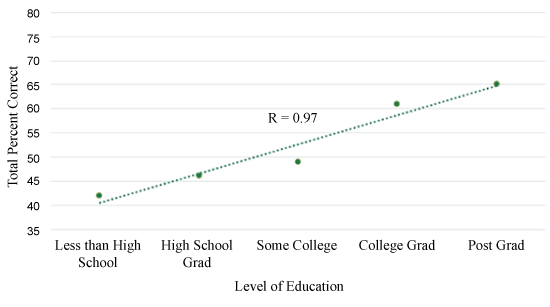
The smallest correlation coefficient (r = 0.83) (Figure 1a) was present between education level and ability to answer questions correctly when risk was presented as a fraction compared to a percentage (r = 0.89) (Figure 1b) or mixed-type question (r = 0.97) (Figure 1c).
Discussion
Our results indicate that educational background is a significant factor in ability to understand risk, as participants with a higher educational level were better able to answer questions correctly. Risk in general is better understood when presented as fraction. In comparison, race and age were found to be insignificant factors and did not affect a patient's ability to answer questions correctly. The results of our study also demonstrate that patients may not have equal understanding of numerical risk. Multiple studies have found that women have inadequate knowledge to make full decisions on maternity care and are not full partners with their providers in decision-making [5,18,19]. With this information, it is essential to consider a patient's background so that communication of medical risk can be directed towards the patient and result in shared decision making, strong doctor-patient relationships and better health outcomes.
When analyzing the type of question that patients answer correctly, we found that fractions were the most widely understood in comparison to the other methods of risk presentation. Questions that presented risk as fractions had the highest average correct answers across all levels of education. Additionally, questions that presented risk as fractions had the weakest correlation to level of education, as patients with both high and low levels of education performed equally on fraction-based questions. Variance was also evaluated to assess the difference in understanding between the method of risk presentation in relation to level of education and race. Fraction-based questions had the lowest variance, as fractions were more widely understood across all educational levels and races as compared to other forms of risk presentation. Participants answered the least amount of questions correctly when questions contained a mix of both fractions and percentages, requiring participants to convert between the two. There was a significant difference in education level and ability to answer questions correctly when risk was presented in a mixed fashion and when risk was presented as percentages. Additionally, mixed-based questions had the lowest average of total percent of questions answered correctly across levels of education, proving they were the most difficult to understand. Questions that mixed fractions and percentages also had the strongest correlation to level of education, as higher levels of education performed better than individuals at a lower education level with these types of questions. It can be concluded that in comparison to fraction-based questions, questions that presented risk as percentages or in a mixed fashion were the least understood across people from various educational backgrounds and we recommend avoiding these when discussing risk with patients. Furthermore, fractions appear to rely the least on the patients' educational or racial background and are the best option when presenting medical risk.
Absolute numbers have been shown to be more easily understood over frequencies [12,20,21]. In our study, fraction-based questions provided a point of reference by giving an absolute number (i.e. 20 out of 100). On the other hand, percentage-based questions did not provide absolute numbers and instead required individuals to convert percentages into absolute numbers (i.e. 20% is the same as 20 out of 100) to solve the questions correctly. Fractions were shown to be the most effective risk presentation method, thereby allowing patients from various educational and racial backgrounds to better understand medical risk.
We identify some limitations in our study. Although we surveyed a small sample size, the demographic of our sample mimic the demographic of an urban center. A selection bias is likely present due to the voluntary participation of the study. Lastly, the questionnaire was a written survey, which excluded illiterate patients from participating.
Conclusion
When presenting risk-related information to patients, fractions - compared to percentages- are more widely understood by patients regardless of their background education level or other demographic information. Additionally, risk should be expressed consistently as either a fraction or percentage, as respondents had the most difficulty when the two methods of delivering information were mixed.
We recommend the use of fractions when presenting medical risk to patients during counseling.
Author Disclosure Statement
The authors have no financial affiliations to disclose.
Author Contributions
NJ contributed to the literature search, study design, data collection, data analysis, data interpretation, writing, and revision of the article. KM contributed to the literature search, data collection, data analysis, data interpretation, writing, and revision of the article. JAC contributed to the study design, data interpretation, and critical revision of the article.
Level of Evidence
Level III.
References
- Elwyn G, Laitner S, Coulter A, et al. (2010) Implementing shared decision making in the NHS. BMJ 341: 5146.
- Stewart M, Brown JB, Donner A, et al. (2000) The impact of patient-centered care on outcomes. J Fam Pract 49: 796-804.
- Browne K, Roseman D, Shaller D, et al. (2010) Analysis & commentary. Measuring patient experience as a strategy for improving primary care. Health Aff (Millwood) 29: 921-925.
- Mosen DM, Schmittdiel J, Hibbard J, et al. (2007) Is patient activation associated with outcomes of care for adults with chronic conditions? J Ambul Care Manage 30: 21-29.
- Gee RE, Corry MP (2012) Patient engagement and shared decision making in maternity care. Obstet Gynecol 120: 995-997.
- Reyna VF, Nelson WL, Han PK, et al. (2009) How numeracy influences risk comprehension and medical decision making. Psychol Bull 135: 943-973.
- Brust-Renck PG, Royer CE, Reyna VF (2013) Communicating Numerical Risk: Human Factors That Aid Understanding in Health Care. Rev Hum Factors Ergon 8: 235-276.
- Peters E, Hess TM, Vastfjall D, et al. (2007) Adult Age Differences in Dual Information Processes: Implications for the Role of Affective and Deliberative Processes in Older Adults' Decision Making. Perspectives on Psychological Science 2: 1-23.
- Gu Q, Dillon CF, Burt VL (2010) Prescription drug use continues to increase: U.S. prescription drug data for 2007-2008. NCHS Data Brief 1-8.
- Kutner M, Elizabeth G, Jin Y, et al. (2007) Literacy in everyday life: Results from the 2003 National Assessment of Adult Literacy. National Center for Education Statistics 60.
- System JH (2015) Jackson Health System Community Health Needs Assessment.
- Peters E (2008) Numeracy and the perception and communication of risk. Ann N Y Acad Sci 1128: 1-7.
- (2017) For Patients American College of Obstetricians and Gynecologists.
- Gynecologists ACoOa. Frequently Asked Questions Special Procedures 2005.
- Gynecologists ACoOa (2015) Frequently Asked Questions Special Procedures. Preparing for Surgery.
- Gynecologists ACoOa. Frequently Asked Questions Special Procedures 2015.
- Gramling R, Irvin JE, Nash J, et al. (2004) Numeracy and medicine: key family physician attitudes about communicating probability with patients. J Am Board Fam Pract 17: 473.
- Goldenberg RL, McClure EM, Bhattacharya A, et al. (2009) Women's perceptions regarding the safety of births at various gestational ages. Obstet Gynecol 114: 1254-1258.
- Declercq ER, Sakala C, Corry MP, et al. (2007) Listening to Mothers II: Report of the Second National U.S. Survey of Women's Childbearing Experiences. J Perinat Educ 16: 9-14.
- Hoffrage U, Lindsey S, Hertwig R, Gigerenzer G (2000) Medicine. Communicating statistical information. Science 290: 2261-2262.
- Waters EA, Weinstein ND, Colditz GA, Emmons K (2006) Formats for improving risk communication in medical tradeoff decisions. J Health Commun 11: 167-182.
Corresponding Author
Jose A Carugno, M.D., Assistant Professor of Obstetrics and Gynecology, Leonard M Miller School of Medicine, University of Miami, 1321 NW 14th Street Suite 201, Miami, FL 33136, USA, Tel: 305-243-2981.
Copyright
© 2017 Joudi N, et al. This is an open-access article distributed under the terms of the Creative Commons Attribution License, which permits unrestricted use, distribution, and reproduction in any medium, provided the original author and source are credited.


