Duke Vaccinates: A Project to Increase Adult Immunization Rates for Four Major Vaccine Types Involving the Entire Primary Care Team
Abstract
Introduction
Current adult vaccination rates fall well below the Healthy People 2020 goals established by the Centers for Disease Control and Prevention for pneumococcal, influenza, pertussis, and herpes zoster vaccines. The objective of this study was to improve immunization rates in primary care through an enhanced, multi-component "audit & feedback" (A&F) intervention.
Methods
The intervention took place over a one-year period (September 2016-August 2017) and involved 24 primary care clinics within one health system in North Carolina. It consisted of pre-specified targets and an online A&F platform, combined with multidisciplinary educational resources and non-physician clinic champions. Six control clinics in the same health system were also identified. Clinic and provider performance for immunization for pneumococcal, influenza, pertussis, and herpes zoster vaccines were tabulated on a monthly basis. Rates were benchmarked against a clinic-defined target, other participating clinics' immunization rates, and national targets. Results were displayed on an electronic dashboard within the online platform, and printable reports were given to each clinic to post in work areas and discuss at practice meetings on a monthly basis. Educational efforts primarily focused on non-physician clinical personnel (nurses, medical assistants) and consisted of online learning modules and 5-minute videos. Frontline nurses or medical assistants served as site champions to receive and distribute monthly immunization reports and attend quarterly project calls to discuss barriers and solutions with champions from the other clinics. Comparisons between intervention and control clinic groups were made using the t-test or Wilcoxon rank-sum test for continuous variables depending on normality, or Pearson's chi square test for categorical variables. To assess the effectiveness of the intervention, the likelihood of immunization during the intervention period was compared between intervention and control clinics using logistic regression models. The generalized estimating equations method was used to account for clustering of outcomes within clinics. Analyses included adjusting for baseline vaccination rates and differences in case mix between intervention and control clinics.
Results
A total of 209,533 and 64,133 patients were seen in the intervention and control clinics, respectively. Intervention patients were younger (mean age 51 years vs. control 53 years, p < 0.0001) and had higher proportions of patients who were female (60% vs. control 55%, p < 0.0001), and privately insured (65% vs. control 58%, p < 0.0001), but a lower proportion of Caucasian patients (65% vs. control 72%, p < 0.0001). All vaccine types showed increases in immunization rates during the intervention period in both intervention and control practices. After accounting for covariates, patients seen in the intervention clinics were more likely to receive an influenza vaccine (adjusted OR 1.27, 95% CI 1.02-1.58, p = 0.03) and complete the pneumococcal vaccine series (adjusted OR 2.40, 95% CI 1.10-5.24, p = 0.03). No differences between intervention and control clinics were seen for Tdap vaccine (adjusted OR 1.05, 95% CI 0.87-1.26, p = 0.61), or zoster vaccine (adjusted OR 1.16, 95% CI 0.90-1.49, p = 0.25).
Discussion
Implementation of an evidence-based, multi-component intervention incorporating audit and feedback, clinic-defined targets, supportive educational resources, and other efforts aimed at engaging non-provider clinic staff (including as champions) appeared to increase the likelihood of influenza and complete pneumococcal vaccination for adults in primary care, but not for pertussis and zoster.
Introduction
Adult immunization rates in the United States are well below the Healthy People 2020 goals established by the Centers for Disease Control and Prevention (CDC) [1,2]. In 2013, the CDC reported pneumococcal vaccination coverage (either 23-valent pneumococcal polysaccharide vaccine (PPSV23) or 13-valent pneumococcal conjugate vaccine (PCV13)) among adults aged 19-64 years at high risk was 21.2% overall. Among adults aged ≥ 65 years, coverage was 59.7%. The Healthy People 2020 target for both high-risk adults and adults aged 65 years and older is 90% [1].
The rise in pertussis incidence over the past decade has led to revised recommendations for all adults aged ≥ 19 years to receive a single dose tetanus and diphtheria with acellular pertussis (Tdap) vaccine, particularly adults who have or anticipate having close contact with an infant less than 12 months of age [3]. In this group, Tdap coverage was 14.2% in 2012. In 2013, 24.2% of adults aged ≥ 60 years reported receiving herpes zoster vaccination (to prevent shingles), up from 20.1% in 2012. The Healthy People 2020 target is 30% for adults aged 60 years and older [1].
The consequences of these relatively low rates include increased risk for vaccine-preventable illnesses. Older adults may be particularly vulnerable due to age-related changes in immune system function and comorbid conditions [4]. In addition, there is evidence of disparities in immunization rates among racial and ethnic minorities [5,6].
Prior studies of interventions to increase immunization rates have found a number of clinician-directed interventions to be effective, including audit and feedback, clinical decision support and other reminders, financial incentives, and education [7].
Audit and feedback (A&F) specifically involves the collection of data regarding clinical performance, and then the presentation of these data in the form of feedback to the relevant clinicians, with or without recommendations for practice. A systematic review of A&F-based interventions to improve vaccination coverage found that in 12 of 15 studies, A&F, alone or in combination with other interventions, was associated with improvements in immunization rates [8].
In an enhanced version of A&F, a "target-based model" that also posted individual provider performance in the clinic on special posters was shown to significantly increase influenza immunization rates [9]. In another example, A&F involving registered nurses in an outpatient surgical department demonstrated that monthly feedback, as opposed to annual feedback, resulted in larger improvements in pneumococcal vaccination [10]. Shared responsibility between physicians and non-physician healthcare personnel has also been found to be effective [11].
Here we report outcomes of an evidence-based quality improvement (QI) initiative to increase adult immunization rates across a primary care network for four important vaccine-preventable diseases (influenza, pneumococcal pneumonia, pertussis, and herpes zoster), which incorporated key elements from the successful examples cited above: the use of an audit & feedback platform in a target-based model, coupled with supportive educational resources and other efforts aimed at frontline healthcare personnel other than providers.
Our objectives were to answer these two questions for each vaccine type (influenza, pneumococcal, tetanus/diphtheria/pertussis (Tdap), and zoster): (1) What is the pre- vs. post-intervention change in change in immunization rates among eligible patients? (2) Do intervention clinics participating in the QI initiative have greater improvement in appropriate immunization rates compared with control (non-participating) clinics?
Methods
Study population
The Duke Vaccinates Adult Immunization Project targeted 24 primary care internal medicine/family medicine clinics; all were part of Duke Primary Care (DPC) in the Duke University Health System. Six other Duke-affiliated primary care internal medicine/family medicine practices were selected as a concurrent control group. The pre-intervention baseline period included all patients over age 18 years with at least one outpatient visit at these clinics between April 1, 2015, and March 31, 2016. The intervention study period included all patients with at least one outpatient visit at these clinics between September 1, 2016, and August 31, 2017.
Vaccine measure selection and patient eligibility
The CDC's Advisory Committee on Immunization Practices (ACIP) recommendations for vaccination against influenza, pneumococcal pneumonia, pertussis, and herpes zoster were used to identify groups who should be vaccinated, based on age and co-morbid conditions [12-17]. Five principal measures were defined, based on then-current recommendations; these are summarized in Table 1. Additional demographic and problem list variables were abstracted from the medical record to ascertain each patient's eligibility for each vaccine. The criteria for each vaccination measure are described in Appendix 1.
Intervention
The studied intervention engaged clinic staff and providers in improving the process and delivery of usual adult immunization care with the following four major components:
Audit & feedback: Clinic and provider performance for guideline-based immunizations administration (or documentation of receipt from an outside provider) were tabulated on a monthly basis, utilizing the internet-based MedConcert healthcare performance improvement and reporting platform (Premier; Homestead, PA).
Clinic performance was benchmarked against the other participating clinics and national targets (Healthy People 2020). Overall performance, vaccine-specific immunization rates for particular patient groups, and provider-level immunization rates were made accessible to providers and clinic staff via the same MedConcert platform, organized as an electronic dashboard as shown in Appendix 2. From this dashboard, lists of patients could be generated who were seen but not recorded as having been vaccinated.
Structured, printable reports for all five vaccination measures were also electronically delivered to each clinic monthly (Appendix 3). To complete the feedback loop, clinics were asked to share these reports with clinic staff and providers, as well as post them in the clinic in areas visible to staff and providers (as well as patients, at clinic discretion).
Clinic-defined targets: Each clinic was also asked to come up with their own, clinic-defined targets for each vaccine measure. The monthly reports charted clinic performance over time against these targets as well as benchmarked against clinics.
Supportive educational resources: Education efforts primarily focused on frontline nursing staff, mostly medical assistants (who comprised the bulk of the clinic workforce directly supporting providers), but also licensed practice nurses (LPNs) and registered nurses (RNs). Guided by the nursing leadership of DPC, specific resources were created addressing current vaccine recommendations and processes of care related to their administration, including videos and online training modules. All clinics were also provided a printed comprehensive immunization training manual, tip sheets, and pocket cards for nursing staff.
Brief "mini" (i.e., five minutes in length) grand rounds-like videos aimed at providers covering each of the four vaccine types were recorded, and conducted as live sessions at two different clinic sites. Additional videos made available by the project sponsor taught providers and nursing staff evidence-based approaches for having "strong" conversations with patients about vaccinations. All of these educational materials were housed in an online learning library. CDC vaccine information sheets and post-vaccination care instructions for patients were also made available. Appendix 4 lists the resources created.
Clinics were encouraged to organically integrate these materials into ongoing staff and provider education, e.g., making use of regularly scheduled clinic staff meetings and other routine communications and training opportunities - including orientation of new nursing staff - but no pre-defined educational "program" per se was implemented across participating sites.
Non-physician clinic champions: In the interest of promoting shared responsibility across care team roles, each clinic was encouraged to select site champions who were not physicians, other providers, or managers - but ideally frontline medical assistants and nurses responsible for administering vaccinations. These champions were asked to receive and distribute monthly reports and other communications, and represent their clinics at a project kick-off meeting and closing celebration, as well as on quarterly conference calls in which clinic leadership was also encouraged to participate.
Overall, the intervention was designed to integrate feedback on clinical performance in a way that achieved intermittent but regular contact with clinic staff and providers, with minimal disruption to clinic workflow. In addition, value-added tools developed primarily for frontline staff were provided that could be aligned with established clinic activities, but clinics had autonomy in determining how these tools would be used.
Data collection
The data used for this quality improvement project were extracted from the electronic health record (EHR) for the pre-intervention baseline and intervention study periods so that they reflected the outcomes of clinical care. Patients were considered vaccinated if the vaccine was administered in clinic or elsewhere within the Duke Health system, or if it was documented in the record as having been received elsewhere. Each intervention clinic was asked to complete both a pre- and a post-intervention survey assessing perceived knowledge about vaccines and barriers to immunization. Survey responses were collected at the clinic level rather than the individual staff or provider level. Post-intervention surveys additionally assessed utility of educational materials.
Statistical analysis
Patient characteristics are described for all patients seen in the intervention clinics and control clinics over the intervention period. Comparisons between intervention and control clinic groups were made using t-test or Wilcoxon rank-sum test for continuous variables depending on normality, or Pearson's chi square test for categorical variables.
For each vaccine, immunization rates are expressed as the numerator (number of patients who received the vaccine) over the denominator (number of patients eligible for the vaccine). These immunization rates were calculated for all eligible patients seen during the pre-intervention baseline and intervention study periods in both intervention and control clinics. Rates were then compared between the baseline and intervention periods using the P. Thompson test to accommodate a partially overlapped population (i.e., patients seen in the pre-intervention period may also have been seen during the intervention period at the same clinic) [18].
Immunization rates are also presented for pre-specified individual subgroups stratified by age, sex, race, insurance status, history of chronic lung disease, diabetes, and cancer history.
To assess the effectiveness of the intervention, the likelihood of immunization during the intervention period was compared between intervention and control clinics using logistic regression models. The generalized estimating equations method was used to account for clustering of outcomes within clinics (i.e., two patients treated within the same clinic would have more similar outcomes than two patients treated at different clinics) [19].
The likelihood that, during the intervention period, an eligible patient treated in an intervention clinic would be more or less likely to receive the vaccine compared with an eligible patient treated in a control clinic is expressed as an odds ratio (OR) with 95% confidence interval (CI). One model was performed only adjusting for baseline immunization rates in the pre-intervention period. A second model additionally adjusted for differences in case mix between the intervention and control clinics, for patients seen during the intervention period - as described by age, sex, race, insurance status, history of chronic lung disease, diabetes, cancer history, alcohol use, liver disease, HIV status, and smoking status.
Results
A total of 209,533 and 64,133 patients were seen in the intervention and control clinics, respectively, during the study period. As shown in Table 2, patients seen in the intervention clinics were younger, more likely to be female and of non-white race, and more likely to have private health insurance. The prevalence of comorbidities was similar between groups.
Intervention clinics involved 147 physicians, 46 nurse practitioners and physician assistants, and over 500 clinic staff. All intervention clinics received monthly immunization reports. Provider-level immunization data were accessed for 130 providers in the MedConcert platform, for a median of two times (25th, 75th percentiles: 1, 3; maximum 10) over the course of the intervention period. 85.8% of platform access occurred during the first six months of the intervention.
Baseline and intervention immunization rates in the intervention clinics are shown in Table 3. All vaccine types saw significant increases in immunization rates during the intervention period.
Influenza
Influenza vaccination rates in the intervention clinics increased by 7.1% from a baseline of 52.4%. Increases were seen regardless of age, sex, race, insurance status, and presence or absence of comorbid conditions (Table 4). In control clinics, influenza vaccination rates were 39.7% prior to and 46.9% during the intervention. Patients seen in the intervention clinics were more likely to receive an influenza vaccine during the intervention period after adjusting for baseline vaccination rates (odds ratio (OR) 1.27, 95% confidence interval (CI) 1.02-1.58, p = 0.03). Following adjustment for differences in patient case mix between intervention and control clinics, we again observed a higher likelihood of influenza vaccination in patients treated in the intervention clinics (adjusted OR 1.56, 95% CI 1.30-1.88, p < 0.0001).
Pneumococcal
Rates of complete vaccination against pneumococcal pneumonia in older adults over age 65 years (i.e., documentation of receipt of both PCV13 and PPSV23 vaccines) increased in absolute terms by 28.1% (Table 3), from a baseline of 29.7%. Increases were seen regardless of age, sex, race, insurance status, and comorbidities, with the smallest change among patients without health insurance (Table 4). In control clinics, pneumococcal immunization rates were 7.7% at baseline and 21.7% during the intervention. Adjusting for baseline vaccination rates, older patients seen in the intervention clinics were more likely to receive both pneumococcal vaccines (OR 1.86, 95% CI 1.06-3.25, p = 0.03). After adjusting for differences in patient case mix between intervention and control clinics, we again observed a more than two-fold higher likelihood of pneumococcal vaccination in patients seen in the intervention clinics (adjusted OR 2.40, 95% CI 1.10-5.24, p = 0.03).
Among younger patients ages 19 through 64 who are either immunocompromised, or immunocompetent with high-risk comorbid conditions, pneumococcal vaccination in the intervention clinics increased by 9.5%, from a baseline of 29.3%. Increases were again seen in all subgroups, with the lowest increase among patients with cancer (Table 4). In control clinics, immunization rates for these younger, higher-risk patients were 20.2% and 25.0% during the baseline and intervention periods, respectively. Only adjusting for baseline vaccination rates, patients seen in the intervention clinics were not significantly more likely to receive both pneumococcal vaccines during the intervention period (OR 1.31, 95% CI 0.97-1.77, p = 0.08). However, after adjusting for differences in patient case mix between intervention and control clinics, we did observe a higher likelihood of complete pneumococcal vaccination in patients treated in the intervention clinics (adjusted OR 1.72, 95% CI 1.10-2.68, p = 0.02).
A detailed breakdown of pneumococcal immunization rates, by vaccine and subgroup, is in Appendix 5.
Tdap
Tdap immunization rates in the intervention clinics increased overall by 11.4%, from a baseline rate of 48.1%. Increases were seen in all subgroups; the smallest change was among the oldest adults (i.e., patients > 80 years) (Table 5). In control clinics, Tdap vaccination rates were 36.4% before and 42.5% during the intervention. Adjusting for baseline vaccination rates, patients seen in the intervention clinics were no more likely to receive a Tdap vaccine than patients in the control clinics during the intervention period (OR 1.09, 95% CI 0.91-1.32, p = 0.33). Following additional adjustment for differences in patient case mix, there remained no significant difference in likelihood of immunization between intervention and control clinics (adjusted OR 1.05, 95% CI 0.87-1.26, p = 0.61).
Zoster
Overall zoster vaccination rates in the intervention clinics increased by 7.4%, from a baseline of 28.6%. Increases were seen across subgroups; the smallest change was among uninsured adults (from 6.3% to 10.0%) (Table 5). In control clinics, zoster vaccination rates were 19.6% pre-intervention and 27.7% at the end of the study. Adjusting for baseline vaccination rates, patients seen in the intervention clinics were no more likely to receive a zoster vaccine than patients in the control clinics (OR 1.18, 95% CI 0.97-1.44, p = 0.09). After additionally adjusting for differences in patient case mix, there was a non-significant trend towards higher immunization rates in intervention clinics compared to control (adjusted OR 1.16, 95% CI 0.90-1.49, p = 0.25).
Use of educational resources
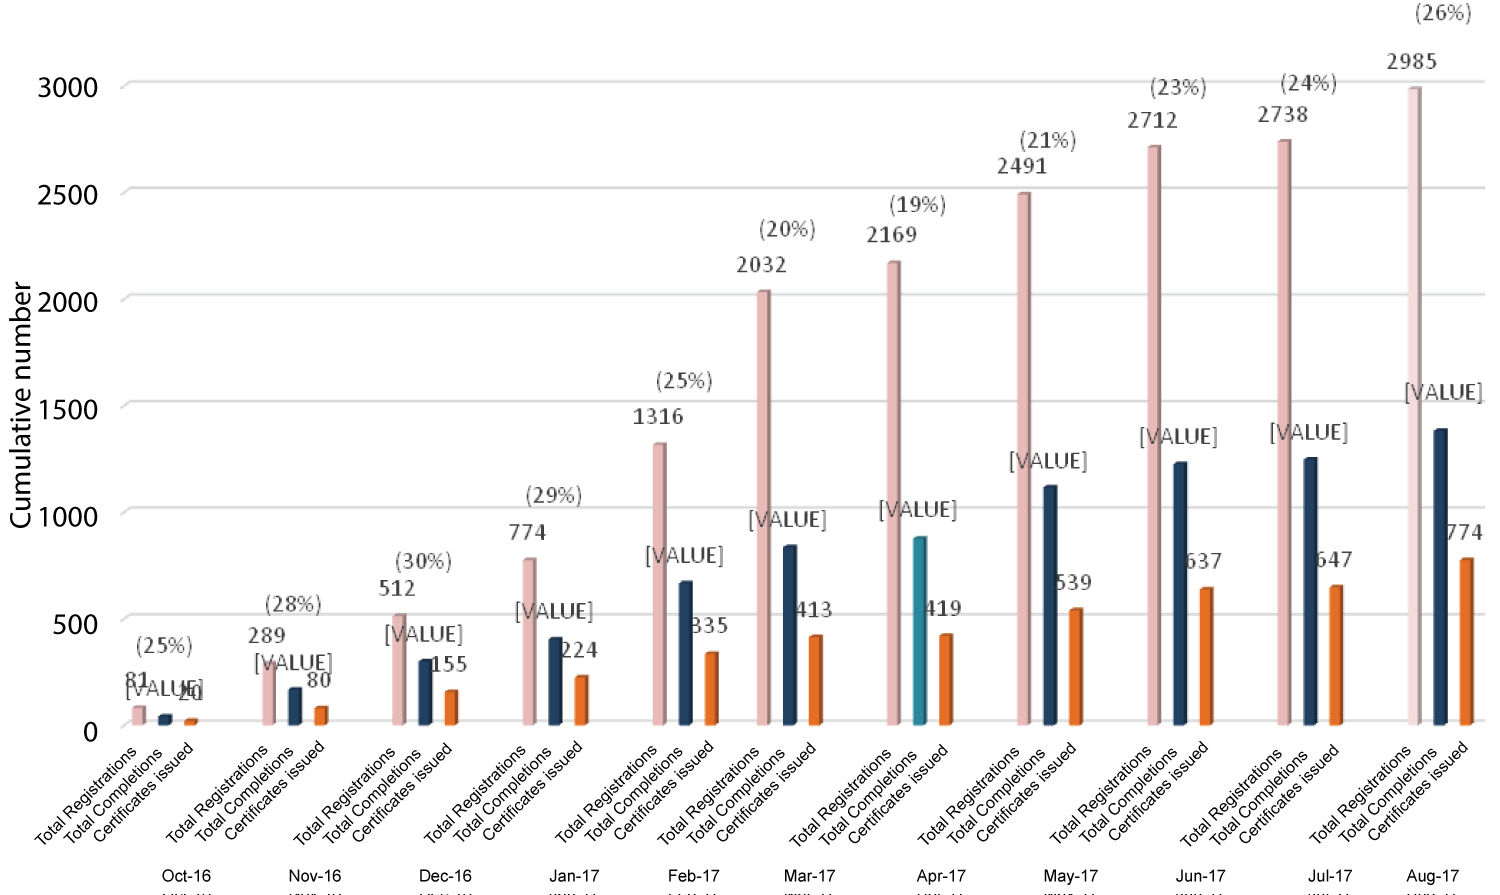
Clinic staff and provider usage of the online training modules is shown in Figure 1. In total, there were 2985 logins ("registrations") over the course of the project, resulting in completion of 774 online modules by DPC clinic staff and providers, for an average of more than one completed module per person.
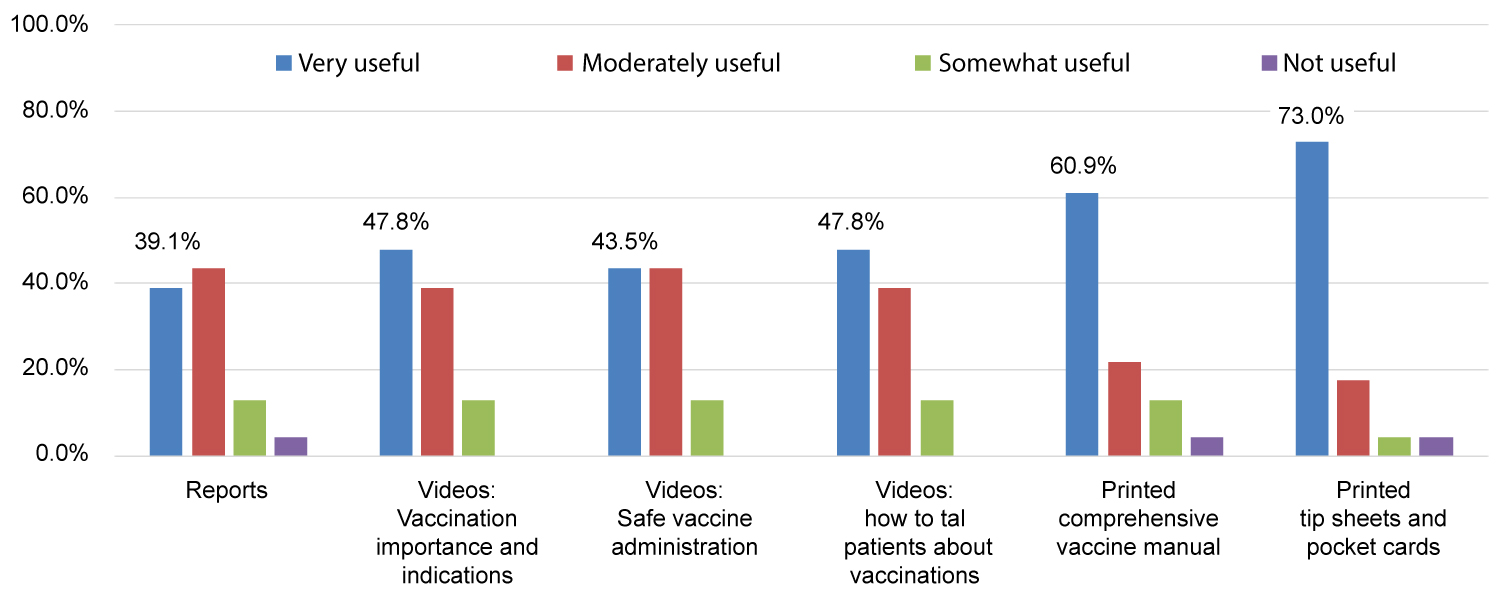
All 24 clinics completed baseline surveys; all but one also completed post-intervention surveys. More than two-thirds (17 of 24) designated frontline clinic staff (15 medical assistants, 1 LPN and 1 RN) as their site champions. Regarding educational intervention components, clinic surveys found printed materials were more likely to be rated "extremely" or "very useful" than online educational resources such as modules and videos (Figure 2).
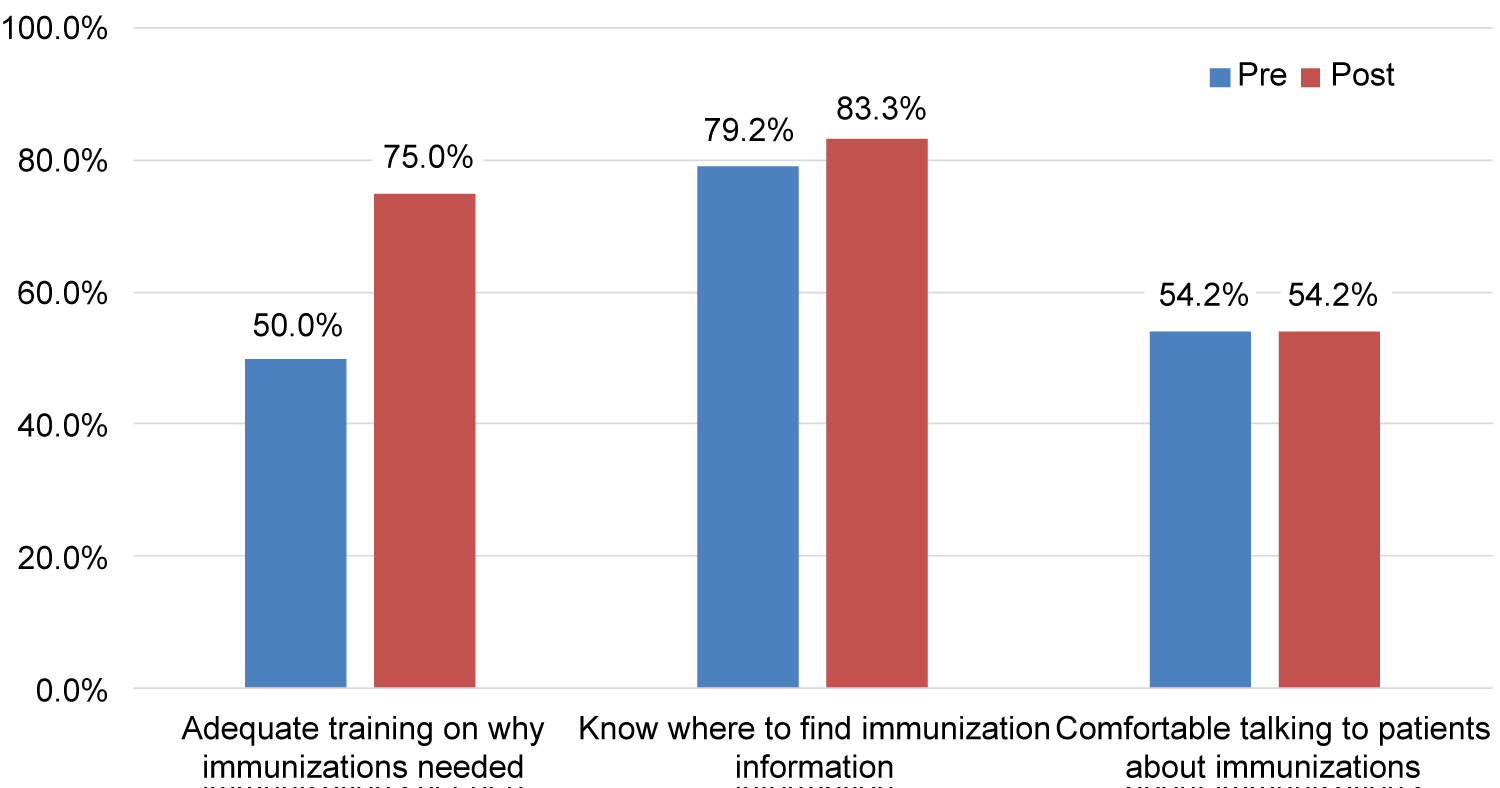
Intervention clinics also reported an increase in staff awareness of the benefit of immunizations (Figure 3). Post-intervention, all clinics reported being "very" or "somewhat familiar" with why influenza, pneumococcal, and Tdap vaccines were recommended and what disease(s) they prevented; 83% of clinics reported staff felt that way about zoster.
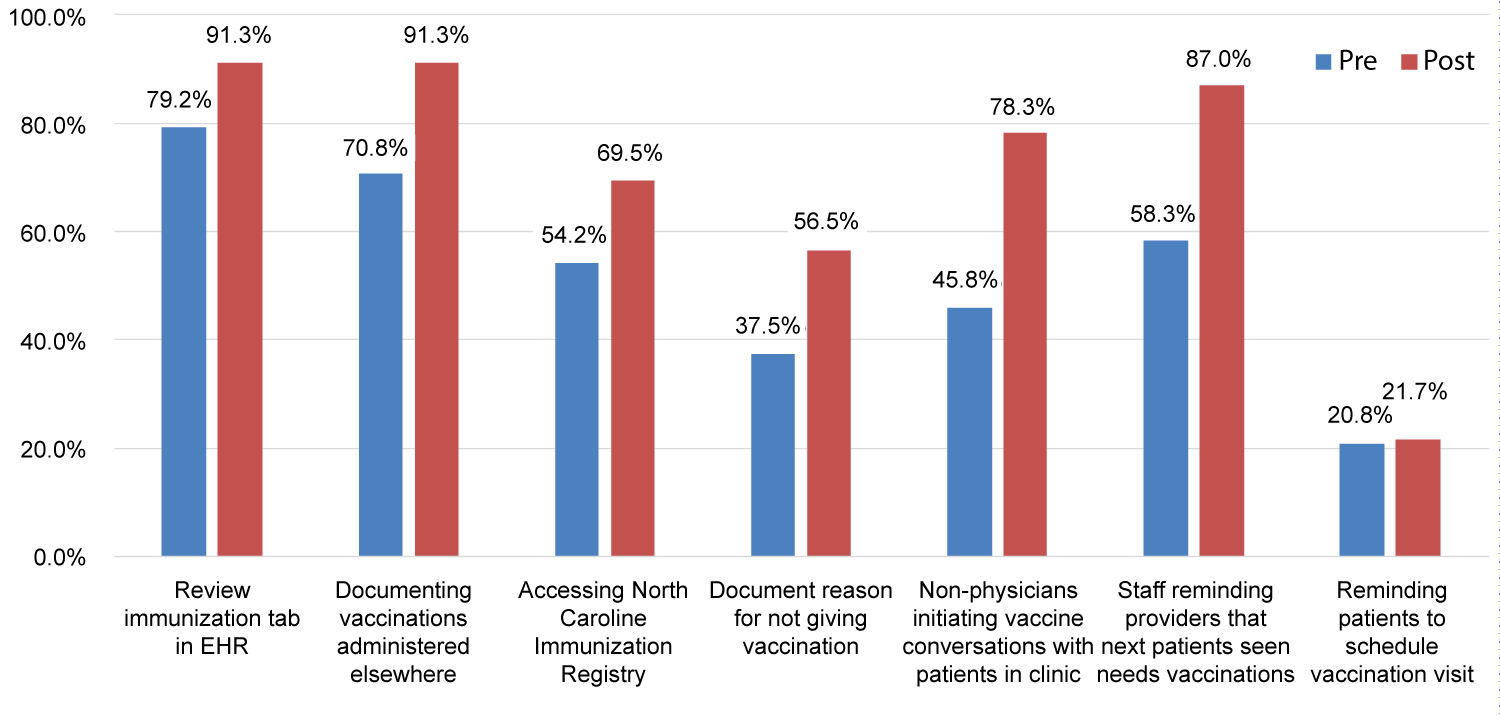
Figure 4 summarizes self-reported changes in immunization-related practices. The two largest changes reported involved expanded roles for clinic staff - with nearly 80 percent of practices reporting post-intervention that staff routinely initiate vaccination conversations with patients in clinic, and nearly 90 percent reporting that staff remind providers when patients are due for one or more immunizations.
In addition, more clinics reported reviewing the immunizations tab in the EHR, consulting sources like the state immunization registry to find vaccinations administered outside of the health system, and documenting outside vaccinations in general as well as reasons for not giving vaccinations (e.g., concurrent illness, patient declines, etc.). However, there was little change post-intervention in the number of practices reporting they routinely remind patients to schedule visits specifically to obtain vaccinations that were due, or address insurance coverage or cost issues related to vaccinations (data not shown).
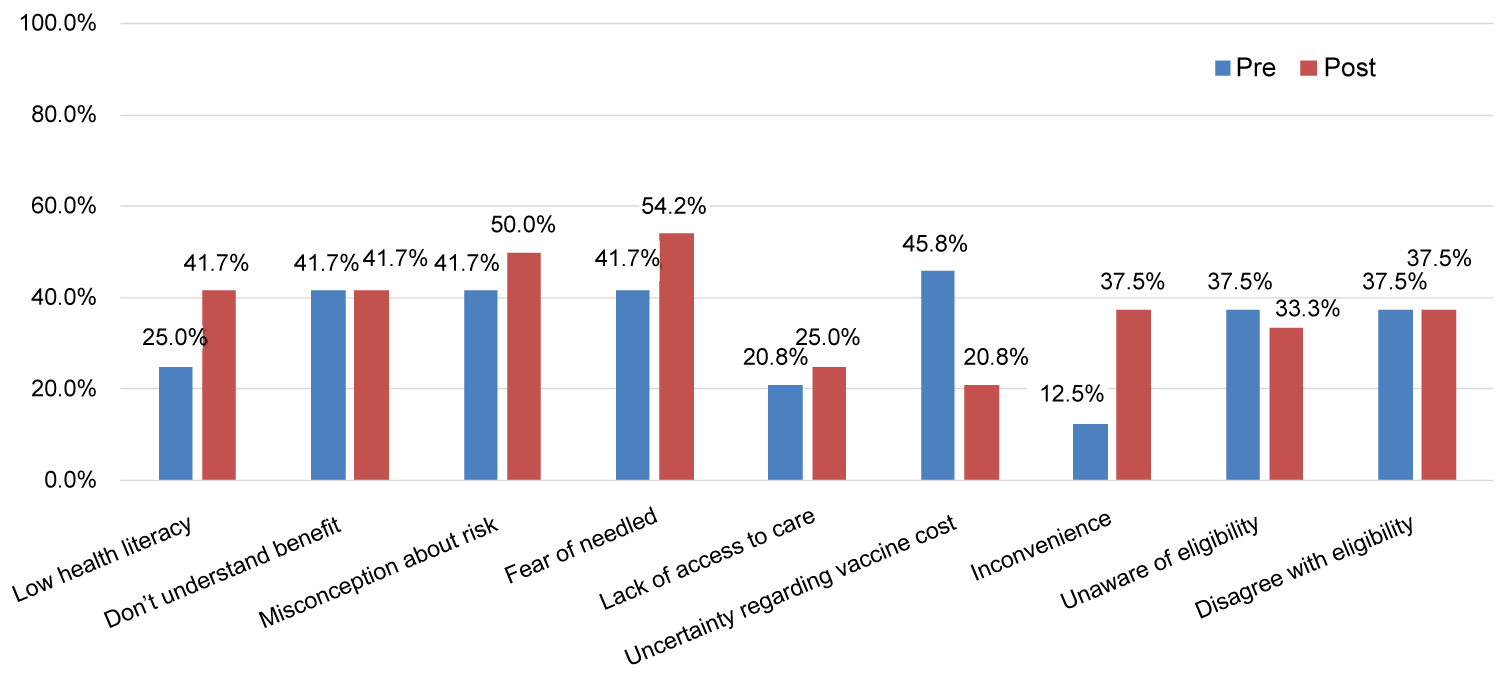
Perceived barriers to immunization are summarized in Figure 5. After the intervention, more sites reported low health literacy, misconceptions about vaccine risk, fear of needles, inconvenience of getting vaccines as potential barriers to immunization. Uncertainty regarding cost of vaccination was less commonly reported post-intervention.
Discussion
In summary, an evidence-based, multi-component intervention was implemented over 12 months, incorporating audit and feedback (A&F), clinic-defined targets, supportive educational resources and other efforts specifically aimed at engaging non-provider clinic staff. The likelihood of influenza and complete pneumococcal vaccination for all adult patients was found to be significantly greater in intervention clinics than control clinics, after adjusting for baseline rates and case mix differences. The likelihood of Tdap and zoster vaccination, however, was not found to be statistically different between the two sets of clinics.
Absolute increases in primary care adult vaccination rates were observed across all four vaccine types in both intervention and control clinics. This finding could be attributed in part to the use of the same EHR by intervention and control clinics, with embedded tools for reminding providers and clinic staff when vaccinations were due. For pneumococcal vaccination in particular, another possible factor was that the recommendation to start PCV13 vaccination in older adults had only recently been issued (in 2014), increasing the overall level of awareness among all providers.
The absence of a statistically significant difference in likelihood of zoster vaccination, until recently only recommended for older adults (≥ 60 years old), may point to an important contextual limitation related to Medicare coverage. (Medicare is the federal healthcare insurance program for Americans aged 65 and older, who are permanently disabled, or who are on dialysis for end-stage renal disease.) Medicare Part B insurance, which covers outpatient services, does not routinely cover zoster vaccination in primary care. As a result, Medicare beneficiaries generally have to obtain this on their own at an outside pharmacy.
Vaccines for zoster are instead covered as pharmacy-dispensed medications by Medicare Part D (or equivalent Medicare Advantage coverage), with cost-sharing requirements ranging from $0 to the full retail price of the vaccine (at the time ~$200 for zoster; currently, the newer two-shot recombinant shingles vaccine retails for ~$300).
A similar limitation applies to Tdap - when administered for preventive purposes - although tetanus vaccination for acute injury would be covered, and Tdap is significantly less expensive (retailing for ~$50).
Such cost-sharing can pose significant financial hardship, contributing to the lower immunization rates observed, and is further exacerbated by the need for patients to present elsewhere to receive these vaccinations, and they and/or pharmacies to self-report vaccination in order to be documented in the EHR.
Regarding the utility of educational resources developed for the intervention, the finding that printed materials were rated more useful than more comprehensive online and video-based ones may reflect the needs of experienced medical assistants, where practical aids such as tip sheets - which addressed specific questions such as insurance coverage of certain vaccine types - were felt to be most helpful in day-to-day practice. In contrast, online and video-based materials may actually be more difficult to use in the midst of a busy clinic, but may be more important for newer medical assistants.
The relatively low rates of MedConcert usage observed were probably in part due to reports summarizing the MedConcert data at a clinic level being furnished to clinic sites - which was done because the platform itself did not enable creation of easily printable summaries. Provider-specific views were only available through the platform, and with completion of online learning modules by newer staff, likely represented its main use as the project went on.
In addition, there was some overlap with the aforementioned existing EHR tools, which also allowed providers to identify patients lacking certain vaccinations.
One potentially significant limitation was that all 24 participating practices were part of the same health system primary care network. The six control practices, however, were also affiliated with the same health system and on the same EHR, with access to the same EHR tools. Comparisons of the intervention and control cohorts also found a similar prevalence of comorbid conditions, but did find some statistically significant demographic differences, as well as differences in baseline vaccination rates, which we attempted to address through risk adjustment.
Another operational limitation was that it took more than three weeks from the end of a calendar month to extract, clean, process, and upload that month's data for visualization in the MedConcert platform - and nearly two months before these data could be packaged into printable, structured reports.
This lag was also the reason that the pre-intervention baseline and intervention study periods were not identical, which though not ideal had the benefit of mitigating the risk that preparations for the intervention (e.g., engaging practices, etc.) might alter pre-intervention data. Nevertheless, complete data for two full 12-month periods were compared, both including a contiguous flu season.
We also did not examine the incidence of vaccine-preventable disease in the populations studied, which would require a significantly longer timeframe to examine, although that could be a topic of future study. Furthermore, this intervention was based on then-current recommendations regarding the use of both PPSV23 and PCV13 pneumococcal vaccinations. These were revised in 2019 to recommend shared decision-making regarding PCV13 in particular, owing to the reduction in overall prevalence of pneumococcal disease observed after routine administration of PCV13 to children began in 2010 [20].
In addition to answering the study's main questions, another objective was to develop an intervention that could be replicated in other settings. To this end, our intervention components were intended to be generally supportive of whatever steps individual clinics might take to improve immunization rates - but not to prescribe what those steps should be, or how things like the educational resources should be used.
Two of the more novel approaches that we witnessed included screening key segments of the training videos during staff meetings (rather than asking staff to watch these individually); and recording a staff-created video, set to music, which touted the benefits of immunizations in an entertaining way and was shared with patients. The quarterly conference calls allowed sharing of practices like these, in addition to airing questions and discussion of common issues.
We also tried to refrain from introducing components that would be completely impossible to replicate in the absence of study-specific resources, or in day-to-day practice. For instance, bringing clinic champions together twice in person and three times on conference calls in a 12-month period does not seem unreasonable. Online learning management systems are commonplace, and the technology to record videos is ubiquitous. EHR-based tools for reporting are becoming increasingly available as well. It is also noteworthy that no new personnel were introduced into the clinics as part of this intervention.
Many QI interventions of the type described here conventionally focus on providers, in this case usually being the ones asking patients about and ordering vaccines. One of the distinctive elements of our intervention was a deliberate strategy of engaging frontline nursing staff (medical assistants, LPN/RNs) - who are not only responsible for administering vaccines, but through the emergence of team-based clinic workflows, are increasingly empowered to "tee up" health maintenance activities like vaccination on behalf of providers. This, in conjunction with tactics like standing orders, can reduce the likelihood of repeated "missed opportunities" [21,22].
This strategy appears to have succeeded, and was reflected in the dramatic increase, post-intervention, in clinics reporting that non-providers were initiating vaccine conversations with patients and/or reminding providers when the next patient to be seen was due for vaccination.
Thus, as team-based care becomes a fixture of the primary care landscape, our intervention demonstrates that QI efforts that engage these frontline staff, including as champions for their clinics - in contrast to the traditional focus on provider behavior - can be broadly effective in raising immunization rates.
Acknowledgements
The authors would like to thank Gretchen Sanders, Ana Quinn, Cara Abram, Rebecca Ortega, Katie Arnold, Kathy Chmielewski, Margaret Palumbo, Reiko Sato, Jeffrey Vietri, and especially Duke Primary Care - Melissa Bowen, Cindy Smith, Cindy Sparrow, Tom Koinis, the leaders of the individual DPC clinics, all DPC providers, and most of all the frontline DPC medical assistants and nurses, including the clinic champions - without whom this project would not have been possible. Special thanks to Thomas Phillips and William Anderson as well for their invaluable contributions to data analysis; and to Stacy Lavin for editorial assistance.
Funding Sources
This project was supported by Pfizer, Inc., including manuscript development; however, the sponsor had no role in the interpretation of the data or the writing of or decision to publish this manuscript. All author were faculty and employees of Duke University at the time this manuscript was written.
Prior Presentation(s)
This project was presented as an abstract at the National Association of Primary Care Research Groups (NAPCRG) Practice-based Research Network Conference (June 25-26, 2018; Bethesda, MD).
References
- (2020) Immunization and infectious diseases. Healthy People.
- Flu vaccination coverage, United States, 2013-14 influenza season.
- Centers for Disease Control and Prevention (CDC) (2012) Updated recommendations for use of tetanus toxoid, reduced diphtheria toxoid, and acellular pertussis (Tdap) vaccine in adults aged 65 years and older - Advisory Committee on Immunization Practices (ACIP), 2012. MMWR Morb Mortal Wkly Rep 61: 468-470.
- Burke M, Rowe T (2018) Vaccinations in older adults. Clin Geriatr Med 34: 131-143.
- Prins W, Butcher E, Hall LL, et al. (2017) Improving adult immunization equity: Where do the published research literature and existing resources lead? Vaccine 35: 3020-3025.
- Williams WW, Lu PJ, O'Halloran A, et al. (2015) Vaccination coverage among adults, excluding influenza vaccination - United States, 2013. MMWR Morb Mortal Wkly Rep 64: 95-102.
- Chaudhry R, Schietel SM, North F, et al. (2013) Improving rates of herpes zoster vaccination with a clinical decision support system in a primary care practice. J Eval Clin Pract 19: 263-266.
- Bordley WC, Chelminski A, Margolis PA, et al. (2000) The effect of audit and feedback on immunization delivery: A systematic review. Am J Prev Med 18: 343-350.
- Buffington J, Bell KM, LaForce FM (1991) A target-based model for increasing influenza immunizations in private practice. Genesee Hospital Medical Staff. J Gen Intern Med 6: 204-209.
- Clark RC, Carter KF, Jackson J, et al. (2018) Audit and feedback: A quality improvement study to increase pneumococcal vaccination rates. J Nurs Care Qual 33: 291-296.
- Lau D, Hu J, Majumdar SR, et al. (2012) Interventions to improve influenza and pneumococcal vaccination rates among community-dwelling adults: A systematic review and meta-analysis. Ann Fam Med 10: 538-546.
- Grohskopf LA, Sokolow LZ, Olsen SJ, et al. (2015) Prevention and control of influenza with vaccines: Recommendations of the advisory committee on immunization practices, United States, 2015-16 influenza season. MMWR Morb Mortal Wkly Rep 64: 818-825.
- Tomczyk S, Bennett NM, Stoecker C, et al. (2014) Use of 13-valent pneumococcal conjugate vaccine and 23-valent pneumococcal polysaccharide vaccine among adults aged >/=65 years: Recommendations of the advisory committee on immunization practices (ACIP). MMWR Morb Mortal Wkly Rep 63: 822-825.
- Centers for Disease Control and Prevention (CDC) (2012) Use of 13-valent pneumococcal conjugate vaccine and 23-valent pneumococcal polysaccharide vaccine for adults with immunocompromising conditions: Recommendations of the Advisory Committee on Immunization Practices (ACIP). MMWR Morb Mortal Wkly Rep 61: 816-819.
- Centers for Disease Control and Prevention (CDC), Advisory Committee on Immunization Practice (2010) Updated recommendations for prevention of invasive pneumococcal disease among adults using the 23-valent pneumococcal polysaccharide vaccine (PPSV23). MMWR Morb Mortal Wkly Rep 59: 1102-1106.
- Centers for Disease Control and Prevention (CDC) (2011) Updated recommendations for use of tetanus toxoid, reduced diphtheria toxoid and acellular pertussis (Tdap) vaccine from the advisory committee on immunization practices, 2010. MMWR Morb Mortal Wkly Rep 60: 13-15.
- Hales CM, Harpaz R, Ortega-Sanchez I, et al. (2014) Update on recommendations for use of herpes zoster vaccine. MMWR Morb Mortal Wkly Rep 63: 729-731.
- Thomson PC (1995) A hybrid paired and unpaired analysis for the comparison of proportions. Stat Med 14: 1463-1470.
- Liang KY, Zeger SL (1986) Longitudinal data analysis using generalized linear models. Biometrika 73: 13-22.
- Matanock A, Lee G, Gierke R, et al. (2019) Use of 13-valent pneumococcal conjugate vaccine and 23-valent pneumococcal polysaccharide vaccine among adults aged >/=65 years: Updated recommendations of the advisory committee on immunization practices. MMWR Morb Mortal Wkly Rep 68: 1069-1075.
- Loskutova N, Smail C, Webster B, et al. (2017) Missed opportunities for improving practice performance in adult immunizations: a meta-narrative review of the literature. BMC Fam Pract 18: 108.
- McKibben LJ, Stange PV, Sneller VP, et al. (2000) Use of standing orders programs to increase adult vaccination rates. MMWR Recomm Rep 49: 15-16.
Corresponding Author
Alex Cho, MD, MBA, Division of General Internal Medicine, Duke University School of Medicine, DUMC Box 3229, Durham, NC 27710, USA, Tel: (919)-314-3761.
Copyright
© 2020 Cho AH, et al. This is an open-access article distributed under the terms of the Creative Commons Attribution License, which permits unrestricted use, distribution, and reproduction in any medium, provided the original author and source are credited.