Integrated Geophysical Investigation for Mapping Groundwater Potential Zones of the Mersa-Girana Sub Basin, North Wollo Zone, Ethiopia
Abstract
This study was conducted in the Mersa-Girana sub basin in north wollo zone, Ethiopia. It aims to map the groundwater potential zones in the area. VES and magnetic geophysical methods were employed to achieve this objective. As part of the geophysical survey, 293 magnetic data were collected at 100 meter intervals along east-west profiles and 10 VES points were acquired along four east-west profiles with an interval of 500 meter between the VES points. In addition to the primary VES data, ten (10) VES data were collected from secondary sources. The VES data were acquired using a Schlumberger array and a maximum current electrode spacing of 1000m. The results reveal the main aquifer depth is between 43 and 351 meters in the area. Furthermore, the analysis of Dar-Zarrouk parameters in the research area shows that 35% of the aquifers exhibit high productivity, while 65% of the aquifers demonstrate moderate productivity. The estimated hydraulic conductivity and transmissivity values are high in the central and eastern region of the research area. The results of electrical resistivity and magnetic measurements also demonstrate the region is strongly affected by faulting, which is believed to regulate the groundwater movement in the underlying volcanic series.
Keywords
Groundwater, Aquifer, Magnetic survey, Vertical electrical sounding
Introduction
Water is vital and essential for food security, economic growth and energy production [1]. However, due to population growth and increasing irrigation, water resources are becoming scarce [2]. Therefore, it is crucial to effectively locate, develop and sustainably use water resources to ensure sufficient water supplies and protect the environment, including groundwater availability [3].
Groundwater is one of the prime necessities of life next to air in the order of importance for the survival of man and a host of other living things [4]. It is available in oceans, ice caps and glaciers, seas, lakes and in the subsurface. In many developing countries, groundwater is a lifeline, providing clean drinking water [5]. The minimum exposure of groundwater to pollutants makes it the ideal source of clean drinking water [6]. Groundwater plays an important role in Ethiopia as a major source of water for domestic, industries and livestock uses [7].
The occurrence and flow of groundwater are significantly influenced by a variety of factors, including topography, geology, and climate (Doris et al., 2011). Therefore, a multidisciplinary approach that includes geological, hydrological and geophysical studies is required for groundwater potential studies [8].
Hydrogeological studies are conducted for a detailed understanding of groundwater flow dynamics, recharge mechanisms, and aquifer properties in the study area [9]. Whereas geological and geophysical studies are carried out to delineate subsurface lithological variations, to identify geological structures and assess the hydrogeological potential of various geological formations [9].
The most commonly employed geophysical methods in groundwater studies are the vertical electrical soundings (VES) and magnetic methods. These methods provide an acceptable image of the shallow subsurface layers [1]. The VES method provides insight into the number and type subsurface layers and their appropriate depths based on the electrical resistivity of the layers [2]. The magnetic method is sensitive to the presence of magnetic minerals, which are more abundant in igneous and metamorphic rocks compared to sedimentary rocks [10]. The changes in magnetic susceptibilities of rocks result in magnetic anomalies that are utilized, among other purposes, for mapping geological structures [11].
In this research geophysical studies were conducted using VES and magnetic methods to assess the potential of groundwater in the Mersa-Girana sub basin, north wollo zone, Ethiopia through the mapping of lithological variations. The aim of the research is to identify the presence of aquifers, their depths, thicknesses and the analysis of aquifer parameters such as hydraulic conductivities, transmissivities as well as the mapping of geological structures that control the flow of groundwater. The study contributes to society water needs by providing valuable information about the groundwater potential in the study area.
Description of Study Area
The study area is situated in the Amhara regional state of North Wollo zone, which is 491 km from Addis Ababa through the main asphalt road. The area is geographically bounded between 555000 and 591000 meter longitude and 1272000 to 1296000 meter latitude covers the area of 503.852 km 2 and geophysical data was collected in 40 km 2 (Figure 1). The area is accessed via gravel and all weathered roads during the actual field investigation.
Material and Methods
To fulfill the study objectives, various materials were utilized. Geophysical equipment such as the Pasi Resistivity meter and Proton Precession Magnetometer were employed for data collection. To accomplish the stated objective in section 1.5 the following primary and secondary data collection and procedures were employed.
Materials
Proton Precession Magnetometer: A specialized device used for magnetic surveys to measure variations in the Earth's magnetic field caused by subsurface geological structures and mineralization. In this study, a Proton Precession Magnetometer was likely employed for magnetic data acquisition.
Earth resistivity meters: to apparent resistivity by using Schlumberger Array: A specific electrode configuration used in VES surveys to measure the electrical resistivity of subsurface layers.
Software packages Geosoft (v-8.4), Arc GLS 10.4, Global Mapper, WINRSIST, ipi2win, Surfer 20 and Microsoft Excel are is a software component. Supplementary materials: 1:50,000 scale topographic map, aerial photographs, geological map of the research area and field equipment including a digital camera and GPS.
Methods
In geophysics, “research method” refers to the methodical process of studying the physical properties and functioning of the Earth's interior and its surroundings. Various methods can be used here. As part of the methodology, the groundwater potential and structural components of the study area were investigated using magnetic and VES methods. After processing and analysis, the collected data provided insightful information about the potential groundwater supply of the research area as well as underground geological structures. In order to achieve the objective of the study, several measures were taken, including the evaluation of various previous works on geology, hydrogeology and geophysical works of the field (related to groundwater investigation and identification of geological structures). Finally, the research area would employ two geophysical methods: magnetic and VES methods. To collect data across the study area, both methods would be applied to separation profiles. To obtain integrated results, the research methodology consists of three main phases: Pre-fieldwork, fieldwork and post-fieldwork.
Data Collection
Magnetic Survey: 293 magnetic data points were collected at 100-meter intervals along east-west profiles.
Vertical Electrical Soundings (VES): 10 VES points were acquired along four east-west profiles with a 500-meter interval between points. Additionally, 10 VES data points were collected from secondary sources.
Geology
Around the research area, there are four distinct geological units: Rhyolite, Basalt, Trachyte, and Alluvial/Colluvial sediments. The Mersa-Girana Basin, located in northern Ethiopia within the broader Ethiopian Main Rift System and extending into the Afar Region, is predominantly comprised of volcanic rocks. This area forms part of the western escarpment of the Main Ethiopian Rift. The geological formations around Mersa and Girana towns are mainly volcanic rocks that create mountainous terrain, integral to the western escarpment of the Main Ethiopian Rift Valley. Research indicates that this volcanic rock unit includes the Alage rhyolites, composed of rhyolites and basalts associated with graben structures, and the Ashangai basalt at the valley bottom, which covers the upper sandstone unit [12]. Basalt Unit: Found in the northeastern, northwestern, and northern regions, particularly covering the western and northeastern mountainous areas. This unit exhibits high levels of fracturing.
Volcanic unit
This unit is exposed along roads and rivers and is highly fractured and weathered. The volcanic formations include various types of deposits such as tuff, ignimbrite, and ash. The western and northern parts of the study area are dominated by fractured basalt (Fig 2.2a), which is also highly weathered (Fig 2.2b). The tuff unit is found in the southeastern and southwestern parts of the research area.
Alluvial deposits
This unit is found in the central part of the study area and consists of a mixture of silt, sand, gravel, and clay particles that are transported and deposited by rivers and streams. These alluvial deposits are characterized by their relatively loose and unconsolidated nature, which makes them significant sources of groundwater due to their high porosity and permeability. In hydrogeology, alluvial deposits often serve as important aquifers, storing and transmitting groundwater (Figure 2) depicts these sedimentary deposits along the river course, showing soil, clay, and gravel rocks.
Hydrogeology of the Study Area
Hydrogeological studies have been conducted to comprehensively understand groundwater dynamics, recharge mechanisms, and aquifer characteristics within the Mersa-Girana sub-basin, situated in the Ethiopian Highlands. This sub-basin features prominent geographical elements such as Ambassel Mountain, Lideta Mountain, and Bukero Mountain. It encompasses a diverse hydrogeological landscape comprising interrelated aquifers, fractured and weathered bedrock formations, and alluvial deposits.
The Mille River intersects both the western and eastern escarpments that delineate the alluvial sediments in the area. Groundwater flows originate from high mountainous regions towards Mersa and Girana within the Mille Catchment, influenced significantly by elevation gradients and geological structures. The elevated western and eastern parts of the study area consist of highly fractured and weathered volcanic rocks, which play a crucial role in groundwater recharge.
Conversely, the lower elevation areas of the Mersa-Girana marginal graben function as the primary discharge zones for groundwater. These areas include springs, wells, and various outlets where groundwater emerges naturally.
Result and Discussion
In this thesis study, interpretations have been made using a combination of magnetic and vertical electrical sounding data, with the results being constrained by lithological log data from a borehole. The electrical resistivity and magnetic data interpretation is completed in the parts that follow. To create distinct sections for the electrical data that illustrate the disparity in resistivity and depth of the subsurface rocks, the apparent resistivity data and the interpreted layer parameters of each sounding curve were employed. The geo electric sections, the outcome of the electrical survey interpretation, are thought to more accurately depict the underlying electrical stratification since they are the product of interpreted real resistivity values of the subsurface. Conversely, from magnetic data residual anomaly plots, magnetic profile plots, and 2D model sections were created and displayed to demonstrate the variance in subsurface lithology and the presence of potential structures throughout the detected area.
Interpreted VES curves
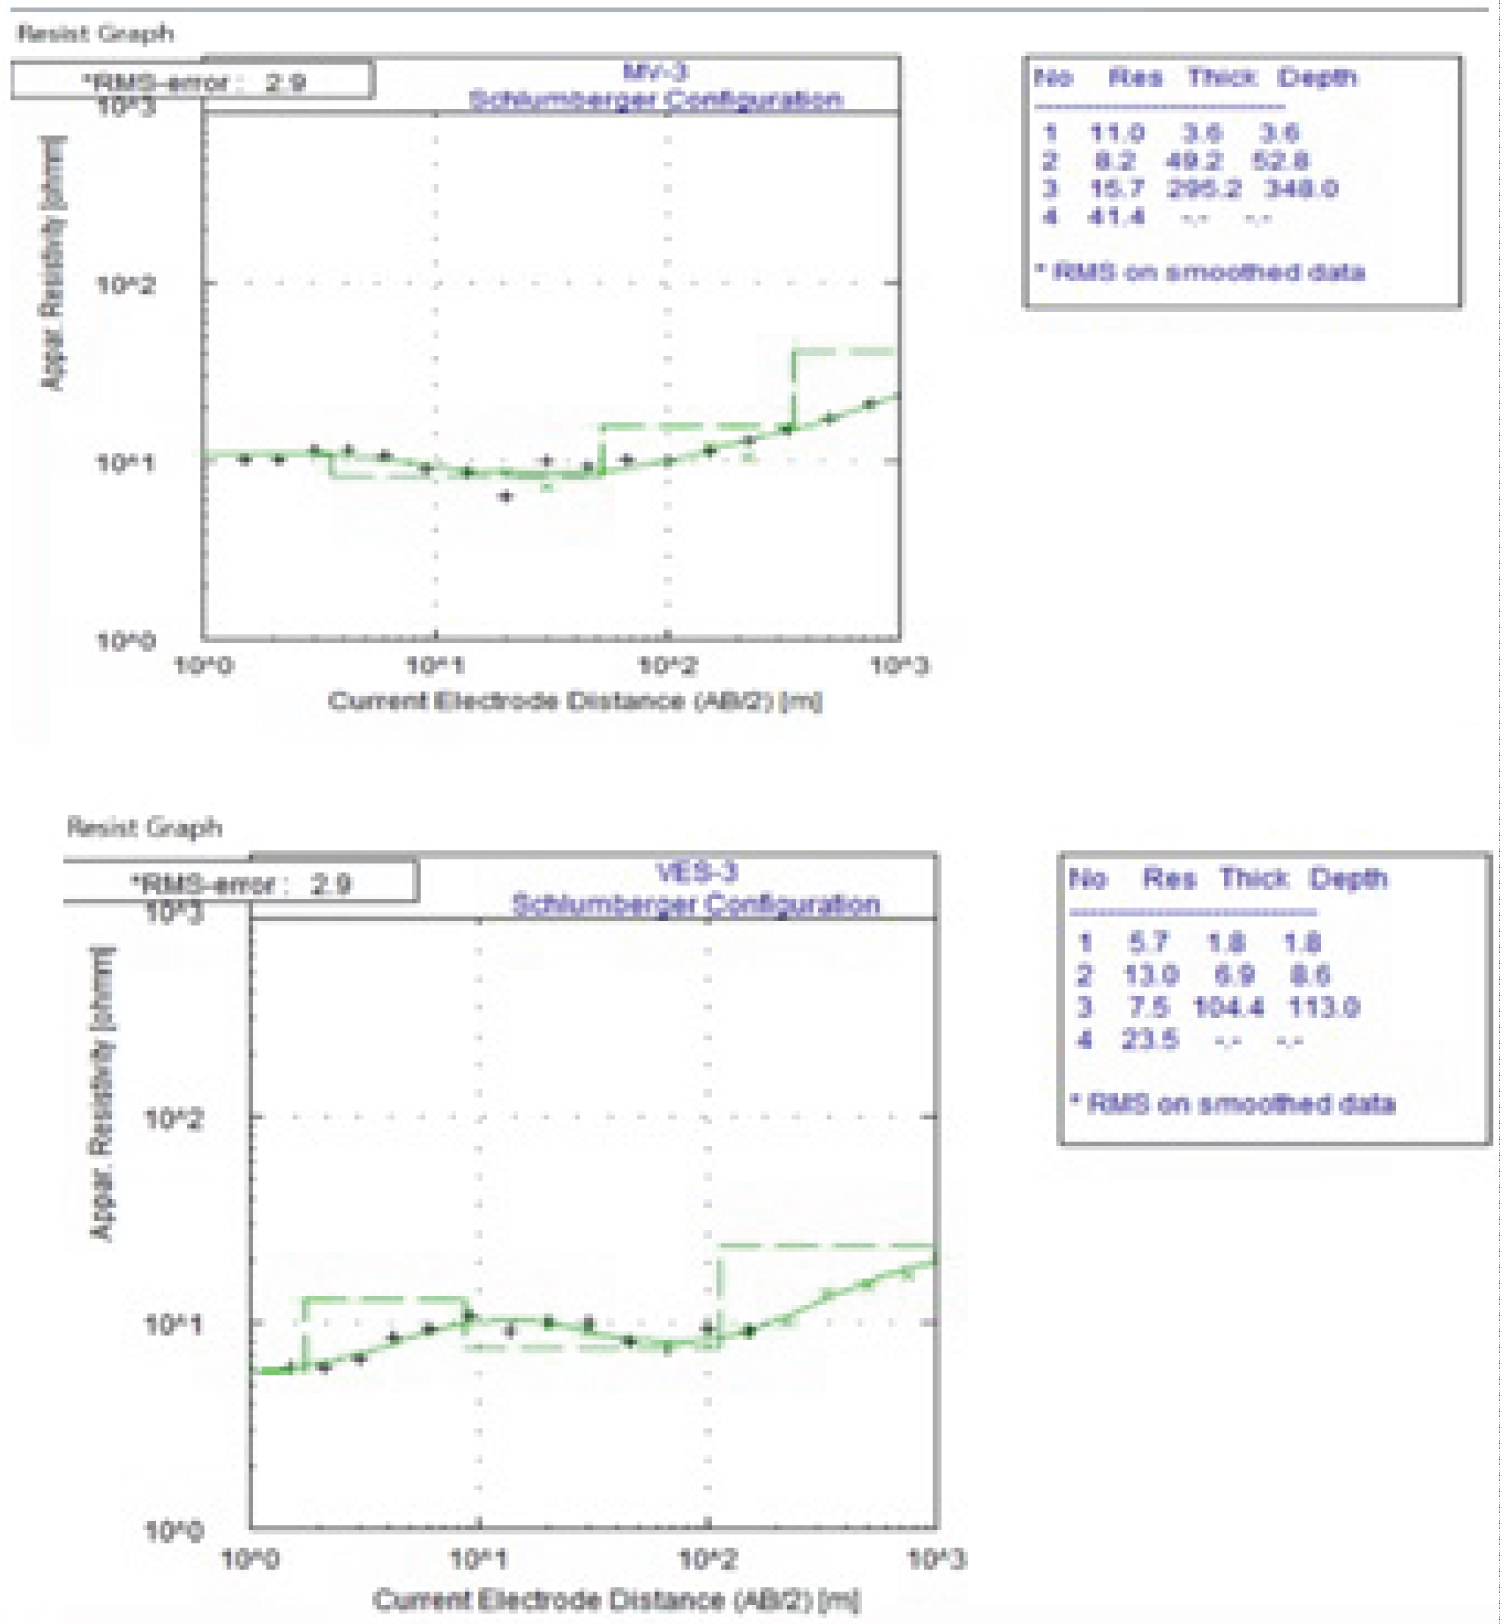
Apparent resistivity against electrode space plotted on a bi-log scale is construed utilizing of the Win Resist to obtain the starting model parameters to be further constrained by the existing boreholes and input into the inversion program (RESIST). The interpreted field curves demonstrate that, for each of the five VES locations, there is a very strong correlation between the field data and the interpreted model sections. An RMS error of 2.5 to 4.5% derived from the sounding data supports this claim. Five interpreted VES curves, one from each survey trip, are used to create an example. These are provided in Figure 3. Using an AB/2 of 1000 meters for the survey, four underlying layers are seen in the four sounding curves, making them too well representative of the subsurface. Annex 1 lays out the remainder of the VES curve interpretation.
Sliced-stacked for different AB/2
The visualization and analysis of resistivity data along multiple electrode configurations in geophysical surveys, particularly electrical resistivity measurements using the Schlumberger configuration, is stated as in (Figure 4) sliced-stacked for different AB/2 involves dividing resistivity data along the survey profile into vertical slices or sections that are stacked horizontally to allow thorough visualization and interpretation.
Accepting of hydrogeological features, aquifers and structural components of the study area is supported by the ability to perform variation analysis, depth profiles and interpretation of resistivity variations. The separation between the electrodes which are potential and current, is indicated by the value AB/2. This method allows geologists to map underground structures, assess groundwater potential at various depths, analyze the distribution of geo-electric units, and identify potential aquifers. The stacked target cards for AB/2 = 1.5, 100, 330, 500 and 1000 meters are shown in Figure 4. The changeability b/n them and the desire to display the sideways of resistivity fluctuations at diverse pseudo depths influence the choice of such a distance. In particular, the map illustrates between the current electrode spacing, the apparent resistivity of the entire region varies at different depths in a vertical and lateral direction.
Geoelectric section
The geoelectric results obtained from the integrated geophysical investigation in the Mersa-Girana sub Basin provided valuable insights into the subsurface lithological variations, aquifer characteristics, and groundwater potential zones. Here are the key geoelectric results from the study: The geoelectric sections revealed four distinct geological units (Figure 5):
• Topsoil
• Clay sediments
• Gravel (alluvial) sediments
• Bedrock
Results and Discussions of Aquifer Parameters
Aquifer characterization assesses physical, hydraulic, and geological characteristics determining water storage and transmission capabilities [13]. But the estimation of transmissivity and hydraulic conductivity using conventional method is time consuming and cost. Therefore, by integrating the vertical electrical sounding data and some reference pumping test data, the regression equation established. In order to integrate a geophysical data with pumping test data, the VES parameter like thickness, depth from surface and resistivity of each layer are very crucial [14]. Using the regression equation the hydraulic conductivity and transmissivity of each VES point were estimated (Table 1). In this study to construct the regression equation, the five borehole data and the five VES those are measure near to wells were used (Table 1).
From the (Table 1) this typically involves fitting a line or curve to the data points to find the relationship between transverse unit resistance and transmissivity. The regression equation can be of the form T = a⋅T R -b, where a, and b are the regression coefficients. As X-axis: Plot the transverse unit resistance (T R ) for each well and Y-Axis: Plot the estimated transmissivity (T) for each well (Figure 6).
Aquifer parameters (Transmissivity and Hydraulic Conductivity)
In order to show the variation of hydraulic conductivity and transmissivity of the study area, the contour map were made. According to the result, the estimated hydraulic conductivity and transmissivity values are notably high in the central and eastern region of the research area. Conversely, the northeaster and southwestern sections show lower values (Figure 7a and Figure 7b). This suggests that the southern part of the research area holds promising potential for supplying a significant amount of groundwater to wells. According to Türk, et al. [15], Aquifers can be classified based on Transmissivity values, with transmissivity values greater than 500 m 2 /day are considered to have high productivity. Those with values between 50 and 500 m 2 /day are classified as having moderate productivity. Aquifers with transmissivity values between 5 and 50 m 2 /day are categorized as low productivity, and those with values between 0.5 and 5 m 2 /day are considered very low productivity. In the research area, it was found that 35% of the aquifers exhibit high productivity, while 65% of the aquifers demonstrate moderate productivity (Figure 7b).
Correlation of aquifer parameters
Correlation of aquifer parameters refers to the statistical relationship between different characteristics or properties of an aquifer system. Aquifer parameters may include hydraulic conductivity (K) and permeability.
By using the linear relation y = 0.8422x + 10.982 formula from the VES points with the well data Pumped T, Estimated T'. The correlation coefficient of 0.97 indicates a strong positive linear relationship between the estimated and pumped transmittance values. This means that as one variable increases, the other tends to increase proportionally. The high correlation coefficient indicates a strong relationship between the estimated and actual transmission measurements carried out in the study area. This result underlines the reliability of the estimation methods used, as they correspond closely to the values obtained through direct pumping tests.
A correlation coefficient (r) of pumped and estimated hydraulic conductivity is 0.573591. This correlation indicates a moderate positive correlation between pumped and estimated hydraulic conductivity. This means that there is a tendency for the variables to move in the same direction: As one variable increases, the other tends to increase as well, although not in a perfectly consistent manner. The positive sign of the correlation coefficient confirms this positive relationship, highlighting that higher values of one variable are generally associated with higher values of the other variable (Table 2, Table 3, Figure 8 and Figure 9).
Interpretations of Magnetics Data
The Total Magnetic Field Anomaly (TMA) map is a representation of the total intensity magnetic anomalies across a study area. The calculated value of TMA is plotted on a map to visualize difference in the Earth's magnetic field over the surveyed area. Contour lines or color gradients are commonly used to represent different levels of magnetic anomaly intensity, with anomalies typically categorized as positive (high) or negative (low) relative to the regional magnetic field [16].
Total magnetic field anomaly maps
Total magnetic field anomaly maps are interpreted to identify and delineate magnetic anomalies of geological significance. Positive anomalies indicate the presence of geological structures with enhanced magnetization, such as sediment, faults, or igneous intrusions. Negative anomalies suggest areas where non-magnetic materials dominate, such as low magnetic anomaly on the other hand high magnetic susceptibilities (Figure 10).
Residual magnetic anomaly
To display the local magnetic field, a smooth surface must be adapted to the magnetic data during channel math expression builder [16]. The residual anomaly is the short-wavelength or small-scale variations in the magnetic field. It reflects the effects of near-surface geological features, mineralization, and local anomalies that are superimposed on the regional field. The residual anomaly is obtained by subtracting the estimated regional field (obtained through upward continuation at 400m) from the observed total magnetic anomaly. The residual field represents the short-wavelength variations in the magnetic field, which are attributed to near-surface geological features and anomalies the result illustrates a higher anomaly signature corresponding to the central part of the study area. This may be due to the presence of a weak zone or alluvial sediment. Additionally, the anomaly trend in a northeast-southwest direction is high. In Figure 11 shows due to the presence of an elongated, low magnetized body in the central part of the research area.
Magnetic analytical signal map (MAS)
To define the edges of magnetic source figures and estimate their depths, the analytical signal is obtained from the entire magnetic intensity data. To calculate the analytical signal, use the formula AS = , where M is the total magnetic intensity at a given place. The partial derivatives in x, y and z directions of the magnetic field are ∂M/∂x, ∂M/∂y and ∂M/∂z, respectively. The map of analytical signal created by processing the map of magnetic anomaly shows anomalies caused by both vertical and horizontal changes in geological formations. This map covers a wide area that stands out from the surrounding sediments and areas of low magnetic susceptibility. The highest peaks on the analytical signal map coincide with the most significant magnetic anomalies in the northern, northwest, southern and southwest of the research area.
Figure 12 shows the results of entire magnetic anomaly map with in analytical signal algorithm. A picture of near-surface conditions is helpful as the analytical signal map shows the response of the anomalous bodies from their upper parts. The high amplitude is also precisely sited via a magnetic interaction, which depends on the depth and horizontal coordinates of the body, but not on the magnetization inclinations. NE-SW and NW-SE are the two primary vertical structures that dominate the study area. The NE-SW and NWSE bodies that cause the relatively strong magnetic anomalies are shown in Figure 12. The high amplitude of the analysis signal in the northeastern, eastern, western and southern regions has discontinuities moving from south to north that may be caused by shear. The study area is part of the western margin of The Ethiopian Rift and is characterized by extensive volcanic activity. High MAS values in this region likely indicate basaltic flows, which are common in the rift margins. The rift margins are zones of intense tectonic activity, and high MAS values could highlight areas with significant tectonic uplift or volcanic intrusions. The low value of ASM is related to Sedimentary Basins. The Ethiopian Rift includes several sedimentary basins which are low MAS values in these areas indicating thick accumulations of sediments.
Tilt Derivative (TDR)
Magnetic anomaly maps serve as valuable tools for identifying areas with significant magnetic variations and for depicting structural features like faults and dikes in the Mersa area. These geological structures are highlighted using edge detection techniques, with total horizontal gradient (THG) and vertical derivative (VD) methods being among the most commonly employed techniques [17]. The tilt derivative ratio (TDR) is a formulated utilized in this context, calculated as the arctangent of the ratio of vertical derivative to horizontal derivative (TDR = arc tan (VD/HD)). TDR values typically range from -90° to +90° (-π/2 to +π/2 radians), regardless of the amplitude of VD or the absolute value of THG. The TDR varies significantly with slope; however, at inclinations of 0° and 90°, its zero crossing closely aligns with the edges of 2D magnetic source bodies such as dikes and blocks [17].
As a result, the Tilt derivative map (Figure 13) identifies and interprets subsurface geological structures, The output is easily identified location of fault/contacts and geological boundary and the zero crossing lines closely aligns with edges of 2D magnetic sources body. The TDR is identify subsurface structure and it shows more detailed structural contacts the major trends in NW-SE and N-S direction. Understanding the relationship between TDR values and magnetic anomalies helps identify fault lines, volcanic intrusion, and alluvial sediment deposits. The major trends in this case northwest-southeast direction.
Euler deconvolution Map
The depth and location of magnetic sources within the study area are estimated using the Euler deconvolution technique applied to the total magnetic anomaly data. Each model resulting from Euler deconvolution corresponds to a specific structural type, identified by a structural index (SI). Structural index values of 1, 2, and 3 represent horizontal cylinders/vertical pipes, spheres, and contact geological features, respectively. In Figure 14, the SI is 1 for the Euler deconvolution magnetic map is presented, utilizing variously colored symbols to indicate magnetic sources at different depths. Pink, radish, and yellow circles in Figure 14 represent magnetic sources less than 65 meters deep, while Green circles denote sources within the depth range of 65 to 149 meters. Red circles indicate magnetic sources deeper than 149 to 245 meters, whereas blue circles represent sources within the depth range of 245 to 405 meters. Yellow circles depict magnetic sources exceeding 405 to 588 meters in depth. The map highlights the presence of structures, particularly weak zones, in the southeast flank of the study area, housing highly magnetized bodies. Additionally, it suggests that the southwest flank of the region may exhibit a higher bearing capacity compared to the northeast, which holds significance for groundwater considerations. The interpretation of Figure 14 focusing on structural indices, depth estimates, clusters of solutions, anomaly boundaries, and geological lineaments, enables a comprehensive understanding of the subsurface geological framework.
The depths in the study area are determined using Euler deconvolution analysis, which estimates the depths of magnetic sources based on surface anomalies. A structural index (SI = 1) indicates linear features where eastern and western parts of the area meet. On the map (Figure 14), different colored symbols represent magnetic sources at depths ranging from 65 to 588 meters. These results highlight linear features predominantly along the edges of magnetic sources, consistent with analytic signal and tilt derivative analyses. The southeast portion of the study area exhibits deeper depths and more pronounced linear features (Figure 14).
The 2D magnetic profile model for Profile One is shown in Figure 15a and is based on interpreted layer characteristics from Vertical Electrical Soundings (VES), geological cross-sections, and borehole data (particularly, BH2, described in Annex 2A). The model shows geological contacts that are situated below 80 meters and that go vertically up to 500 meters next to a basaltic intrusion. The geo-electric section analysis shows that the basalts have different levels of weathering and fracture intensity. Additionally, there is diversity in the remanence of basalt layers among various strata. Profile-one’s 2D magnetic modeling, shown in Figure 15b, offers important insights into subsurface geological formations and advances our understanding of the local geological setting. The magnetic anomaly maps can be used to determine the thickness and distribution of alluvial sediments. River valleys, floodplains, and coastal regions are frequently linked to alluvial deposits, which build up over time as a result of sediment transport and deposition processes. These sedimentary structures can show up in 2D modeling as large areas of muted magnetic anomalies over the floodplain or as elongated low-magnetic anomaly zones along basaltic. The geological contacts (fault lines) were observed in the NW-SE direction and the N-S direction along the river channel. To ensure coherence between the results obtained from magnetic and geoelectric data, it's crucial that the depth of the magnetic basement corresponds to the depth of the bedrock as identified in the geoelectric section along the same profile. This alignment between magnetic and geoelectric findings enhances the accuracy and reliability of the subsurface characterization. Figure 5a, Figure 5b, Figure 5c, Figure 5d and Figure 15c provide visual representations of this alignment, showcasing the parallel depths of the magnetic basement and the bedrock across the respective profiles. This congruence strengthens the overall interpretation of the geological structure and facilitates a more comprehensive understanding of the subsurface conditions in the study area.
The Integrated Results of Magnetic and VES Data
The integration of the results mainly focused on Correlation between magnetic anomalies and VES findings, identification of groundwater potential zones and implications of structural and lithological variations. The measurements of Vertical Electrical Sounding (VES) surveys, land magnetic data, and information from available drill holes, were employed to assess groundwater potential and identify suitable drilling locations in the study area.
Among the VES results in geo electric section identified four different geo-electric layers, representing various deposits such as topsoil, clay sediments intercalations, gravel sediments (Alluvial sediments) and bedrock defines the geological zone. The 2D magnetic modeling also identified the sediment deposit and basements with appropriate depths. The results of geo electric section and 2D modeling show the best correlations identification of sediments and basements in the study areas.
The lithological and hydrogeological characteristics of each geological unit are considered to establish a connection between VES results and the aquifer system.
Generally, Correlation between Magnetic Anomalies and VES Findings: Geo-electric Sections: VES identified four distinct geo-electric layers, including topsoil, clay sediments, gravel (alluvial) sediments, and bedrock, defining geological zones and their resistivity characteristics. 2D Magnetic Modeling: Magnetic data identified sediment deposits and basement rocks at various depths, showing consistency with VES findings, indicating a strong correlation between these methods. Depth Correlation: Comparison between geo-electric sections and 2D magnetic sections showed close alignment in basement depths, reinforcing the reliability of the integrated geophysical methods.
Results
The geophysical data were analysis using Surfer, IPI2WIN, WINRESIST and Oasis Montaj (Geo soft v 8.4.2) software. According to the magnetic result, the subsurface geological structures or contact in the study area are north-south trending. These faults were observed to be interconnected, with the ascending fault from the Mersa aquifer serving as a conduit for groundwater flow. These fault and fracture systems play a critical role in facilitating the movement, recharge, and diversion of groundwater resources.
The geoelectric results show a four geological units such as topsoil, clay sediments, gravel sediments, and bedrock. The pseudo depth section results insight as the central and eastern part of study area are characterized by low apparent resistivity. There are both shallow and deeper low-resistivity horizons that could be areas of groundwater saturation, as indicated by pseudo-depth sections of apparent resistivity and the geo-electric sections of true resistivity. The thickest thickness and low resistance of these horizons are a sign of the high potential of groundwater in the study area.
The results of electrical resistivity and magnetic measurements also show that the region is strongly influenced by tectonic forces, which have caused local faults and fractures of the rock units at different depths. Groundwater movement is believed to be regulated by these fractures and faults (contacts). The main barriers that prevent groundwater from flowing across the region are fractures and weak points. A comparison of the well-log results and the geophysical interpretations shows a strong correlation between the geophysical survey results and the drill hole lithological logging results.
Gravel (Alluvial) sediments and fractured basalt are the major geological units throughout the study area that are likely to contain groundwater depending on the extent to which they are weathered and fractured. In the research area, it was found that 35% of the aquifers exhibit high productivity, while 65% of the aquifers demonstrate moderate productivity.
The estimated hydraulic conductivity and transmissivity values are high in the central and eastern region of the research area. Conversely, the northeastern and southwestern sections exhibit lower values. This suggests that the central part of the research area holds promising potential for supplying a significant amount of groundwater potentials.
References
- Ayenew T, Demlie M, Wohnlich S (2008) Hydrogeological framework and occurrence of groundwater in the Ethiopian aquifers. Journal of African Earth Sciences 52: 97-113.
- Ali HY, Priju C, Prasad NN (2015) Delineation of groundwater potential zones in deep midland aquifers along Bharathapuzha river basin, Kerala using geophysical methods. Aquatic Procedia 4: 1039-1046.
- Scanlon BR, Fakhreddine S, Rateb A, et al. (2023) Global water resources and the role of groundwater in a resilient water future. Nature Reviews Earth & Environment 4: 87-101.
- Mishra RK (2023) Fresh water availability and its global challenge. British Journal of Multidisciplinary and Advanced Studies 4: 1-78.
- Gupta GS, Orbán A (2018) Water is life, life is water: (Un)sustainable use and management of water in the 21st century. Corvinus Journal of Sociology and Social Policy 9: 81-100.
- Zektser IS, Everett LG (2004) Groundwater resources of the worldand their use, UN, 20.
- Amenu K, Markemann A, Valle Zárate A (2013) Water for human and livestock consumption in rural settings of Ethiopia: Assessments of quality and health aspects. Environ Monitor Assess 185: 9571-9586.
- Benjmel K, Amraoui F, Aydda A, et al. (2022) A multidisciplinary approach for groundwater potential mapping in a fractured semi-arid terrain (Kerdous Inlier, Western Anti-Atlas, Morocco). Water 14: 1553.
- Kafando MB, Koïta M, Le Coz M, et al. (2021) Use of multidisciplinary approaches for groundwater recharge mechanism characterization in basement aquifers: Case of Sanon experimental catchment in Burkina Faso. Water 13: 3216.
- Likkason OK (2014) Exploring and using the magnetic methods. Advanced Geoscience Remote Sensing, 141-174.
- Purucker ME, Clark DA (2011) Mapping and interpretation of the lithospheric magnetic field. Geomagnetic Observations and Models, 311-337.
- Kobo-Girana Project report (2009) Existing groundwater development situation in girana.
- Simon SS, Ishaku JM, Seli AB, et al. (2022) Evaluation of groundwater potentials using Dar Zarrouk parameters in mapeo and environs, North-Eastern Nigeria. Dutse Journal of Pure and Applied Sciences (DUJOPAS) 8: 124-135.
- Onawola B, Olatunji S, Ologe O, et al. (2021) Determination of aquifer parameters from resistivity data: A case of university of Ilorin Campus, Northcentral Nigeria. Tanzania Journal of Science 47: 91-103.
- Türk KB, Baran MF, Aslam Z, et al. (2021) Proceedings book.
- Hilemichaeil S, Haile T, Yirgu G (2024) Integrated geophysical methods to constrain subsurface structures of Tulu Moye-Bora-Berecha axial volcanic complex, main Ethiopia rift: Implications for geothermal resources. Heliyon 10: e28499.
- Salawu NB, Olatunji S, Adebiyi LS, et al. (2019) Edge detection and magnetic basement depth of Danko area, northwestern Nigeria, from low-latitude aeromagnetic anomaly data. SN Applied Sciences 1: 1056.
Corresponding Author
Mehari Sisay Aberie, College of Natural and Computational Science of Woldia University, Ethiopia.
Copyright
© 2024 Sisay M, et al. This is an open-access article distributed under the terms of the Creative Commons Attribution License, which permits unrestricted use, distribution, and reproduction in any medium, provided the original author and source are credited.