Phosphate Determination in Aqueous Samples by Complex Formation with Rhodamine B
Abstract
In this study novel approaches for determining trace levels of phosphate in aqueous pore water solutions are described. Phosphate in aqueous samples (freshwater, drinking water, soil pore water) forms an aggregate compound with molybdate and Rhodamine B in 1M HCl. Incident light directed at the Rhodamine B molybdo-phosphate aggregate follows a second order light scattering behaviour. A bench top fluorescence spectrophotometer was used for examining the light scattering properties of the aggregate as well as for examining the feasibility of using this species for quantitative analysis. In this study this approach was adapted for quantitative analysis using capillary electrophoresis equipped with laser induced fluorescence. Quantifying phosphate with CE-LIF could be achieved by detecting the Rhodamine B phospho-molybdate aggregate directly in aqueous samples. Capillary electrophoresis was also used to indirectly detect phosphate by detecting Rhodamine B that dissociated from the aggregate species prior to electrokinetic injection.
Keywords
Spectrophotometry, Phosphate, Rhodamine B, Molybdate, MIE scattering, Capillary Electrophoresis
Introduction
Phosphorous (P) species exist naturally in soils and are an important nutrient for the growth of plant life as well as microorganisms [1]. Most native soils generally contain relatively low concentrations of P as phosphate, however once soils are employed in agriculture, phosphate levels can become significantly higher in concentration. Soils that have been amended with manure or fertilizers can have elevated levels of phosphorous. Land that is dedicated to agriculture consists of topsoil that are routinely amended with fertilizers and as a result of repeated applications of fertilizer they can experience an increase or loading of total phosphorous levels over extended periods of time [2-4].
Orthophosphate (PO4-3) or reactive phosphate is also an important nutrient that is frequently used in fertilizers to maximize crop growth in agriculture. One potential problem with excessive phosphate application is the risk of phosphate runoff into freshwater lakes which can result in the development of algae blooms [5-7]. Algae blooms can be extremely problematic in terms of water quality which seriously impact aquatic life such as the fish [8]. Therefore, the determination of phosphate and total phosphorous in the environment is an important activity used to monitor water quality.
A number of methods currently have been developed for the determination phosphorous and phosphate species in aquatic environmental samples. Organic phosphorus compounds are typically the dominant phosphorus fraction in natural waters [9,10] and methods such as 31P-NMR [11] and mass spectrometry are well suited for identifying them [12]. Dissolved inorganic P contributes a relatively small fraction, however, the bioavailability of inorganic P fraction makes it an important determinant of ecosystem function. Determination of inorganic phosphorous species such as phosphate (PO4-3) can also be achieved using ion chromatography [13-15]. While they are reasonably selective, liquid chromatography approaches (HPLC and IC) are relatively time consuming and typically require a minimum of 10 minutes or more to achieve baseline separations [13]. This makes the analysis of large numbers of samples, within a short period of time, challenging. Estimating the concentration of total phosphorous in soils can also be achieved using atomic spectroscopy. Graphite furnace atomic absorption spectrometry, equipped with chemical Zeeman effect background correction has been successfully used for determining P [16,17]. One of the problems with GFAAS is that stable molecular phosphate species (oxides) will form in the furnace which results in detection limits on the order of 1 mg L-1 [18]. The detection limits are less than satisfactory especially when compared with inductively coupled plasma (ICP) spectroscopy. Both ICP-atomic emission (ICP-AES) and ICP-mass spectrometry have been successfully used for determining total phosphorous [19,20]. Unfortunately, determination of total phosphorous provides only an indirect estimation of the concentration of the biologically relevant species (e.g. PO43-).
Spectrophotometric approaches typically have significantly higher detection limits than atomic mass spectrometry (ICP-MS), however they are well suited for determining species such as PO4-3 in natural water samples. Molybdenum blue is the most established spectrophotometric approach that relies on the formation of a blue coloured complex [21]. Central to this approach is the formation of a molybdo-phosphate complex with the addition of a reducing agent (ascorbic acid) under low pH conditions and detection of absorbed light at 650-850 nm [22,23]. Fluorescence spectrophotometry has also been explored for the determination of PO4-3 by detecting fluorescence of Rhodamine B as well as fluorescence quenching Rhodamine G that is complexed with molybdate prior to selectively complexing PO4-3 [24]. Un-complexed Rhodamine B produces a lot of fluorescence itself. To overcome this problem Nasu, et al., have used phase extraction of the complex from methanol into ether [25]. Excitation of the extracted complex was achieved at 554 nm and fluorescence was measured at 573 nm. The formation of aggregate species in the aqueous phase between Rhodamine B and molybdo-phosphate results in the formation of an ion pair that scatters incident light [26,27]. The reaction for this complex has been described as follows [28]:
Therefore, quantification of phosphate in aqueous samples has been achieved by determining the intensity of scattered light using a fluorimeter and with a laser-scattering detector at 40°. Ion-pair formation of molybdo-phosphate with Rhodamine B or G will quench the fluorescence of these dyes and it is this strategy that has been used in flow injection analysis [28-30] as well as with sequential injection analysis [31].
While simple in terms of instrumentation, spectrophotometric methods such as molybdenum Blue often require an incubation time of 10-20 minutes. Like most spectrophotometric methods, sample sizes for the molybdenum Blue method typically exceed 1 mL. With this in mind, the objective of this research was to develop novel approaches for detecting phosphate using a bench top fluorimeter as well as capillary electrophoresis equipped with laser induced fluorescence. For these approaches, reactive phosphate was reacted with a Rhodamine B molybdate complex prior to separation using capillary electrophoresis. Capillary electrophoresis has the advantage of being well suited for separating charged species in a relatively short period using exceptionally small samples volumes.
Experimental
Spectrophotometry
Measurements were conducted on a Varian (CA, USA) Cary Eclipse fluorescence spectrophotometer using a quartz cell with a 10 mm path length. Incident light at 350 nm that was directed at the sample was scattered at 90° and the scattered light was measured at a 700 nm. Detection slit widths were fixed at 5 nm for all measurements, whereas incident slit widths varied depending on the desired analytical conditions between 1.5 and 5.0 nm. The complex solution was prepared by mixing 10 mL of 5 M HCl and 10 mL of (iii) 0.017 M ammonium heptamolyb date, tetrahydrate (BDH; PA, USA) with 30 mL of (ii) 1.074 × 10⁻³ M Rhodamine B (Alfa Aesar; CA, USA). After mixing the solution was filtered through a 0.45 μm filter paper to yield a clear bright red solution. A stock solution of 100 mg L-1 P (as phosphate) was prepared by dissolving KH2PO4 (BDH; PA, USA) in water, from which working standards of 0.1-1.0 mgL-1 P was prepared. For solutions were prepared by adding 2 mL of sample to 1.2 mL of complex solution and diluted to a final volume of 10 mL.
Capillary electrophoresis laser induced fluorescence (ce-lif)
Separations were performed using an in-laboratory constructed CE instrument which utilizes post-column laser-induced luminescence detection within a sheath flow cuvette. This instrument has been described previously (Chen, et al. 1994). The injection end of a 20 cm long, 10 μm inner diameter, 145 μm outer diameter uncoated fused silica capillary (Polymicro Technologies) and a 0.5 mm diameter platinum wire connected to a high voltage-power supply (Spellman model CZE 2000) were placed into a buffer-containing vessel in the injection carousel and held at a positive potential. The detection end of the capillary, from which approximately 1 mm of the external polyimide coating was removed by flame, was inserted into a quartz sheath flow cuvette containing a 250 × 250 µm inner bore (Hellma). The capillary was grounded through the sheath flow buffer within the cuvette. The 10 mW output at 407 nm of a solid state laser (Coherent) was focused using a 6.3 X, N.A. 0.2 microscope objective (Melles Griot) approximately 10 µm below the detection end of the capillary. Emission was collected at 90° using a 60X, N.A. 0.7 microscope objective (Universe Kogaku), passed through a 615DF45 optical filter (Omega Optical) and a slit and onto a photomultiplier tube (Hamamatsu model 1477). The analog signal was collected at 25 Hz and digitized using a Pentium 4 computer through a PCI-MIO-16XE I/O board utilizing Lab View™ software (National Instruments). The same board was used to control the electrophoresis voltage and the PMT bias, which was 1200 V. Sheath buffer was 25 mM HEPES containing 50 mM TRIS base (pH 8.0). Running buffer was 15 mM HEPES containing 30 mM TRIS base (pH 8.0) and 40% (v/v) formamide.
Reagents and solutions
All reagents were ACS grade or higher and were prepared using deionized water (Milli Q, Millipore, Milford, MA, USA). Potassium phosphate monobasic, ammonium molybdate tetra hydrate, and hydrochloric acid (HCl) were obtained from BDH (PA, USA). Polyvinyl alcohol (PVA) was obtained from VWR. The RB colour reagent was obtained by mixing 30 mL of 1.074 × 10⁻³ M of RB with 10 mL each of 5 M HCl and 0.017 M ammonium heptamolyb date and let sit for at least 20 minutes. The solution was filtered through 0.45 μm what man filter paper prior to use. A stock solution of 100 mgL-1 P (as phosphate) was prepared by dissolving KH2PO4 in water, from which a working stock solution of 5 mg L-1 P was prepared fresh as necessary. Soil floodwater was used as a test sample for determining dissolved phosphate. For these experiments, soils were sampled from agricultural fields in Southern Manitoba (St. Pierre, Rosetown, Ledwyn). These calcareous soils have a relatively high amount of clay and are slightly alkaline (pH = 7-7.3). Approximately 1 kg of each soil was packed into a 2 L mason jar and flooded with deionized water. The depth of the water was approximately 5 cm above the surface of the soil.
Results and Discussion
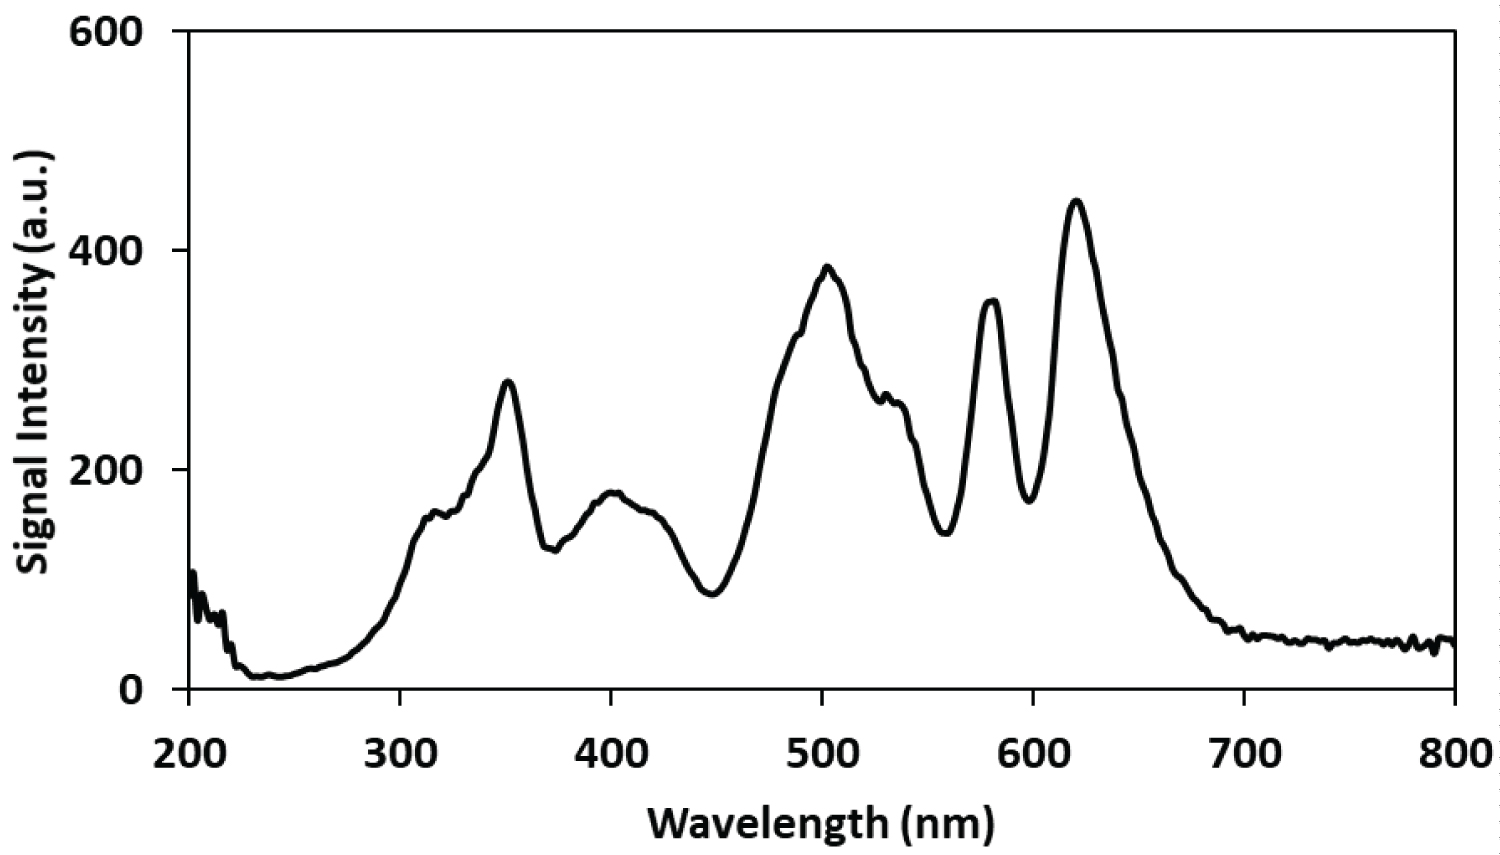
Initial experiments were performed to understand the light absorption, fluorescence and light scattering properties of the dissolved Rhodamine Bmolyb date complex. The fluorescence properties of Rhodamine B are well known, however relatively few papers have been published on the light scattering properties of the Rhodamine B complex with molybdo-phosphate (R-B-Mo P) [26-31]. A wavelength scan was performed to observe the spectral properties this complex. In this experiment, the wave length of the incident light on the aqueous sample containing the phosphate complex was varied from 200 to 700 nm in 5 nm intervals and the light that was emitted or scattered was detected with open slits. This type of experiment provides useful information about the R-B-Mo P complex in terms of its fluorescence and light scattering properties. Figure 1 shows the relationship between the wave length of the incident light, which is analogous to an absorbance/excitation spectrum used in fluorescence spectroscopy. The acquired spectrum indicates that there are several wavelengths where light is emitted as a result of fluorescence or scattered light. Well-defined peaks can be observed at 350, 400, 500, 540, 580 and 620 nm. The spectral data presented in Figure 1 indicates that more than one wavelength could be exploited for its potential as the incident wavelength with light scattering experiments in mind. Because of the intensity of the light emitted when an incident light source of 350 nm was used, it was decided to further explore the suitability of using this wavelength for detecting the R-B-Mo P complex which is known to form an aggregate that will scatter light.
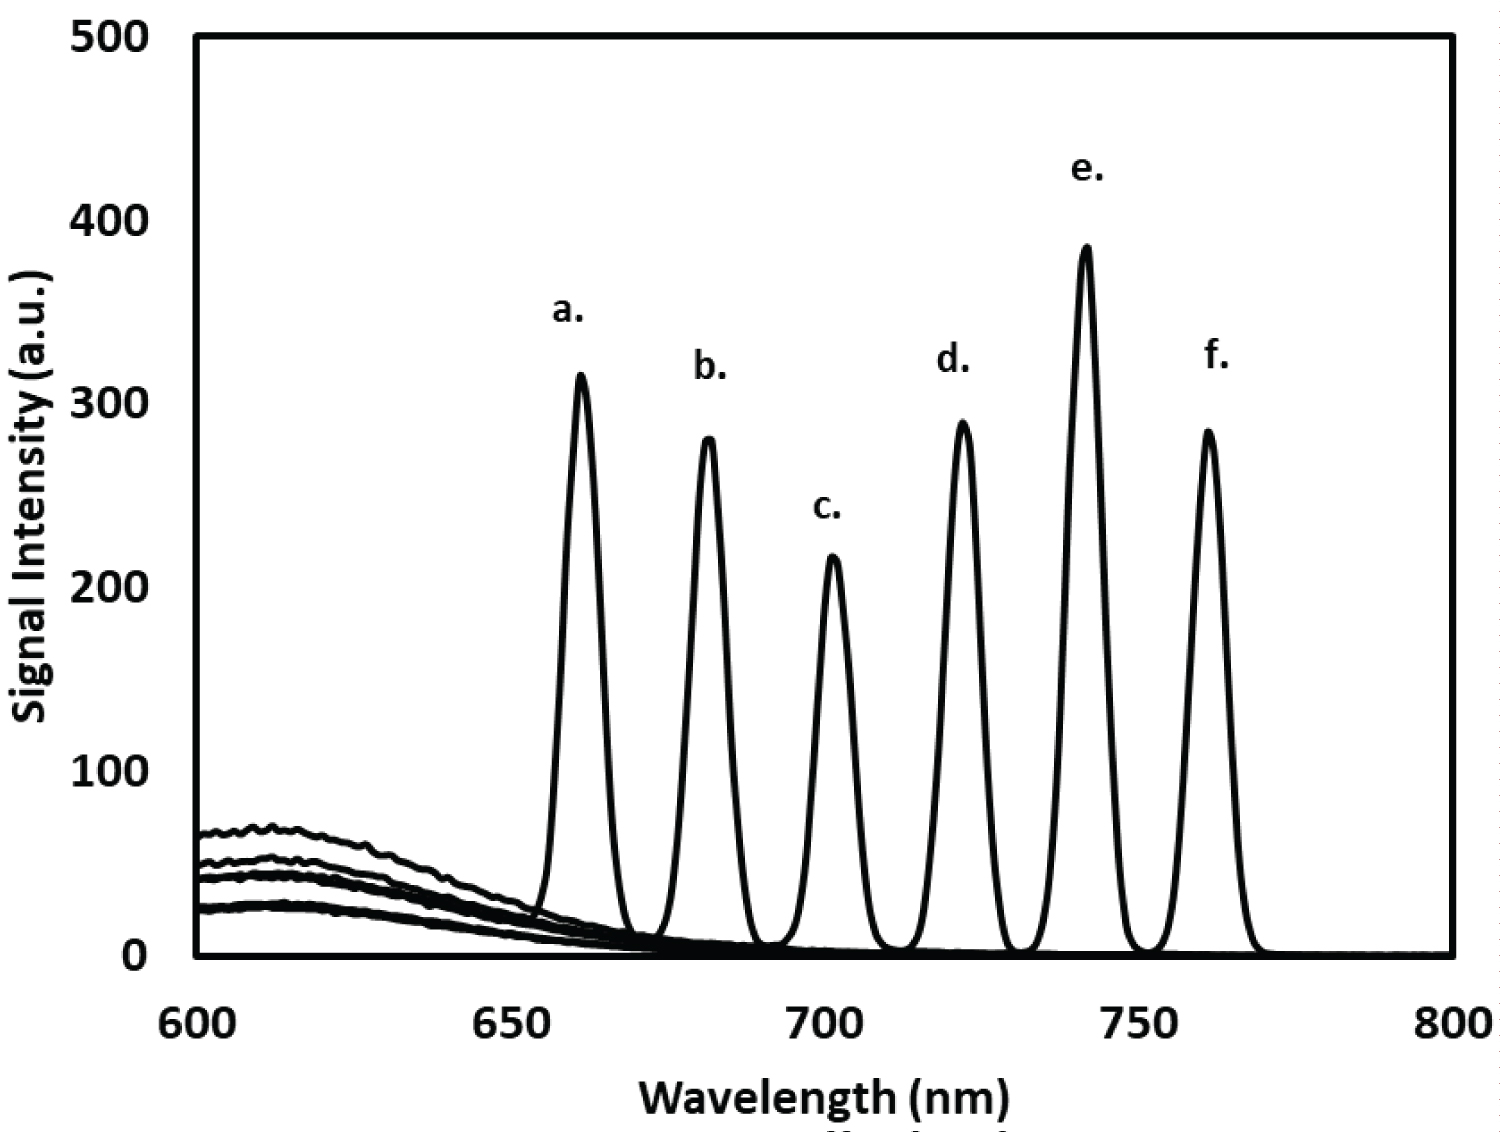
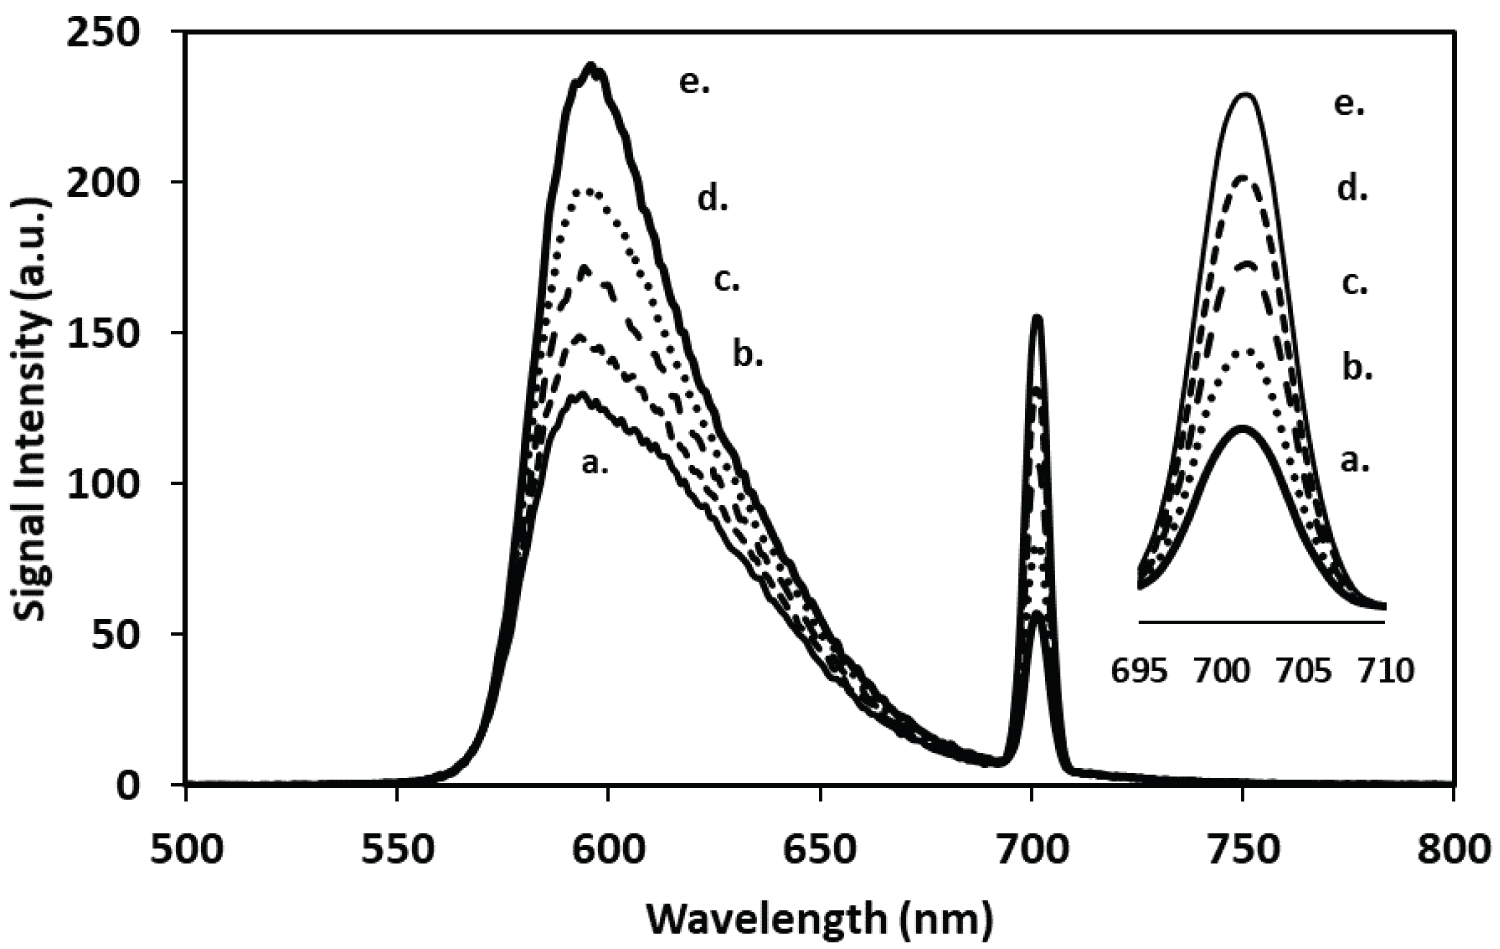
The scattering effect of incident light by the R-B-Mo P complex is illustrated in Figure 2. Varying the wavelength of the incident light resulted in a proportional change in the wavelength of light emitted which is indicative that Mie scattering was being observed. This was not an unexpected result as the R-B-MoP complex is well known to form a colloidal complex in aqueous solution under acidic (pH = 1-2) reaction conditions [28,29]. Choosing incident wavelengths that would scatter light below 680 nm was avoided due to the possible spectral interference from the broad fluorescence peak at 550-650 nm. Incident wavelengths that resulted in emitted wavelengths longer than 660 nm were all generally useful for detecting the R-B-Mo P complex. For this study, an incident wavelength of 350 nm and the emitted (scattered) light at 700 nm was chosen for further study of using this approach to determine phosphate. The formation of the aggregate in aqueous solution between the Rhodamine B with molybdo- phosphate at room temperature (21 °C) develops over a relatively short period of time. This can be observed by the growth of the peak at 700 nm in Figure 3. Quenching of the fluorescence peak at 550-650 nm of Rhodamine B coincides with the aggregation of the colloidal Rhodamine B complex [26]. In this experiment, phosphate was added to the Rhodamine B molybdate complex under acidic conditions.
The intensity of scatter light can be directly related to the concentration of phosphate which allowed the construction of a calibration curve in the range of 0 to 1 µg mL-1 (P). The equation for the calibration curve gave a linear equation of y = 505.9x + 41.2 with a linear regression (r2) of 0.999. Detection limits were determined by D.L. = 3s/m, where s is the standard deviation of the lowest concentration of the lowest standard (0.2 mg L-1) and m is the slope of the calibration curve. This gave a detection limit of 13.1 ng mL-1 for phosphate (PO4-3). To further test the feasibility of this approach, dissolved phosphate in soil pore water was also determined using three different types of soils. The soils chosen were from different locations in Southern Manitoba. All of these soils can also be described as moderate to highly calcareous. These soils were chosen as they provided a range of soluble phosphate concentrations from 0.8 to 3.0 mg L-1. The experimental approach of using a flooded soil in a packed glass jar was identical to the spike recovery experiment. Filtered pore water samples were obtained using Rhizon Flex samplers that were submerged in the flooded soils. To assess the relative accuracy of the Rhodamine Bmolybdo-phosphate method, samples were also analyzed using the well-established method, commonly referred to as the molybdenum blue method (834 nm). The results of this experiment which are summarized in Table 1, indicate that both approaches give similar results for the concentration of phosphate with a bias of between 2 and 10%. This would strongly suggest that measuring scattered light from the Rhodamine B molybdo-phosphate complex using a bench top spectrofluorimeter performs equally as well as the molybdenum blue method useful for determining PO4-3 in pore water.
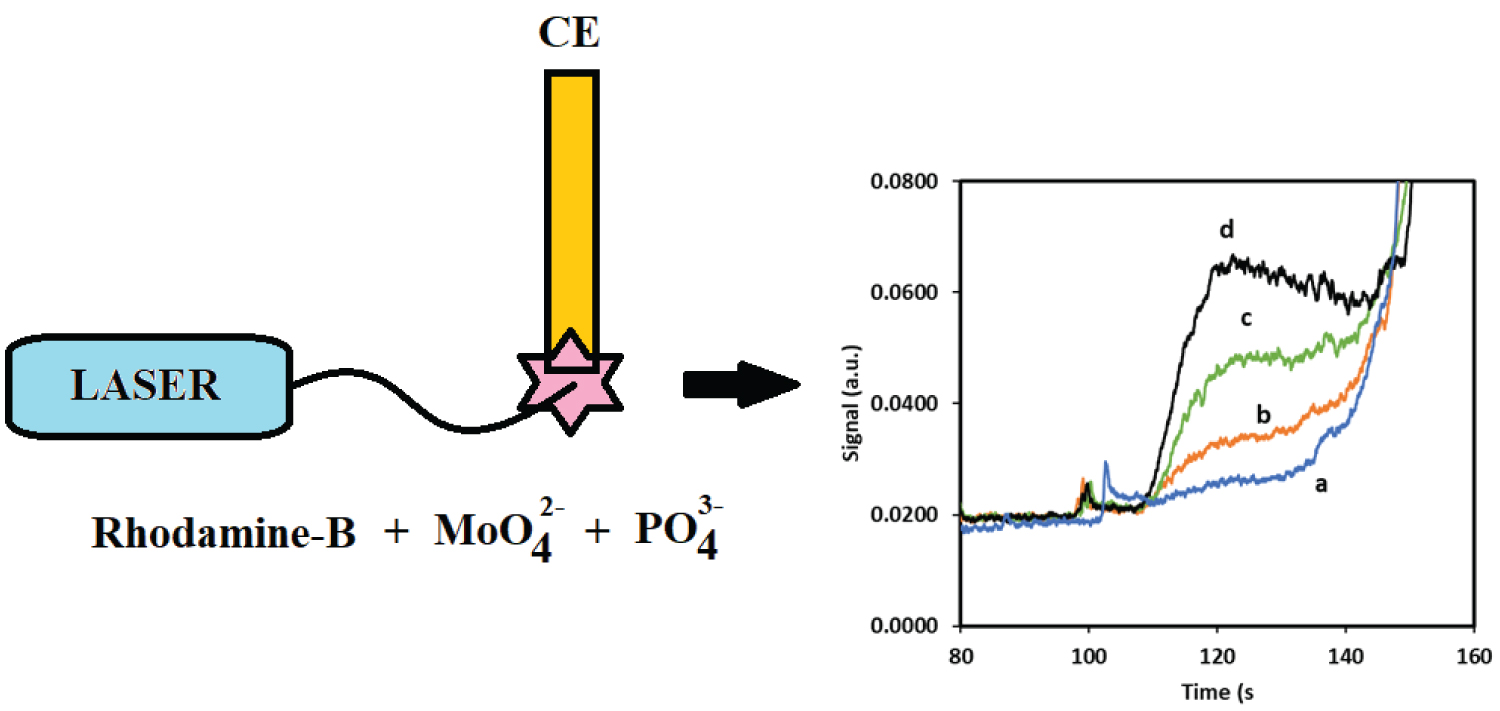
Capillary electrophoresis (CE) Detection of Phosphate
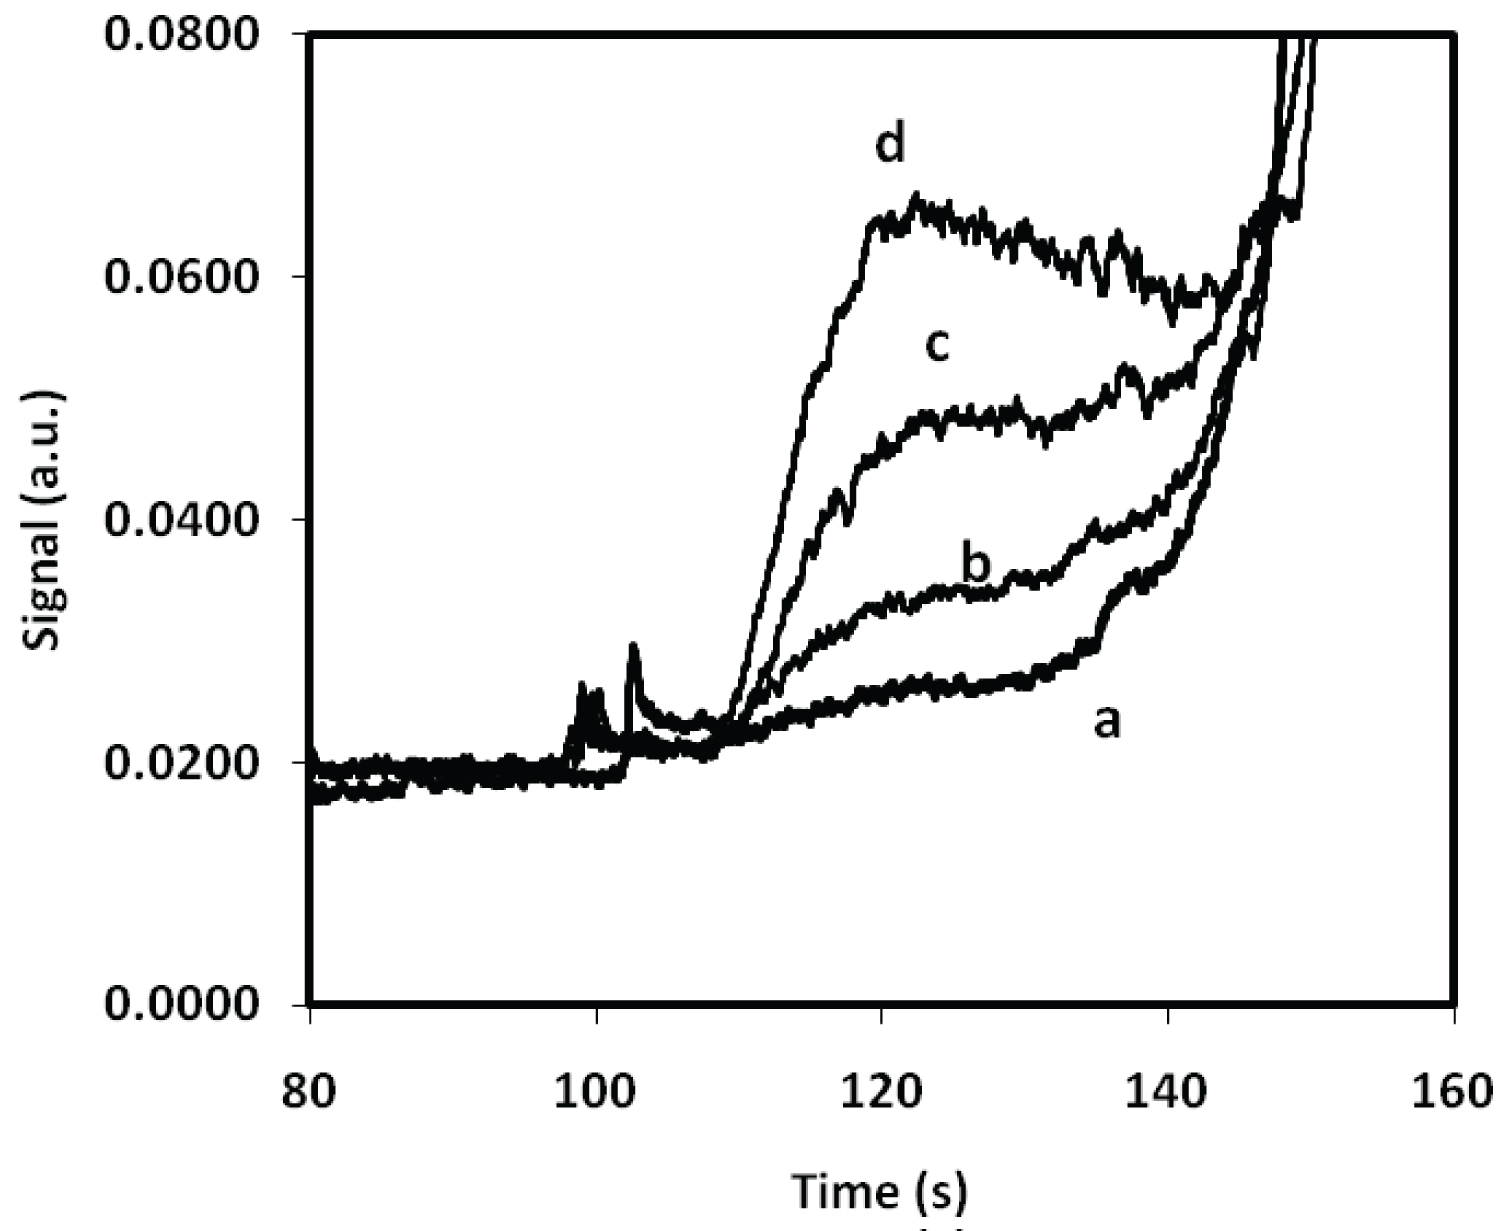
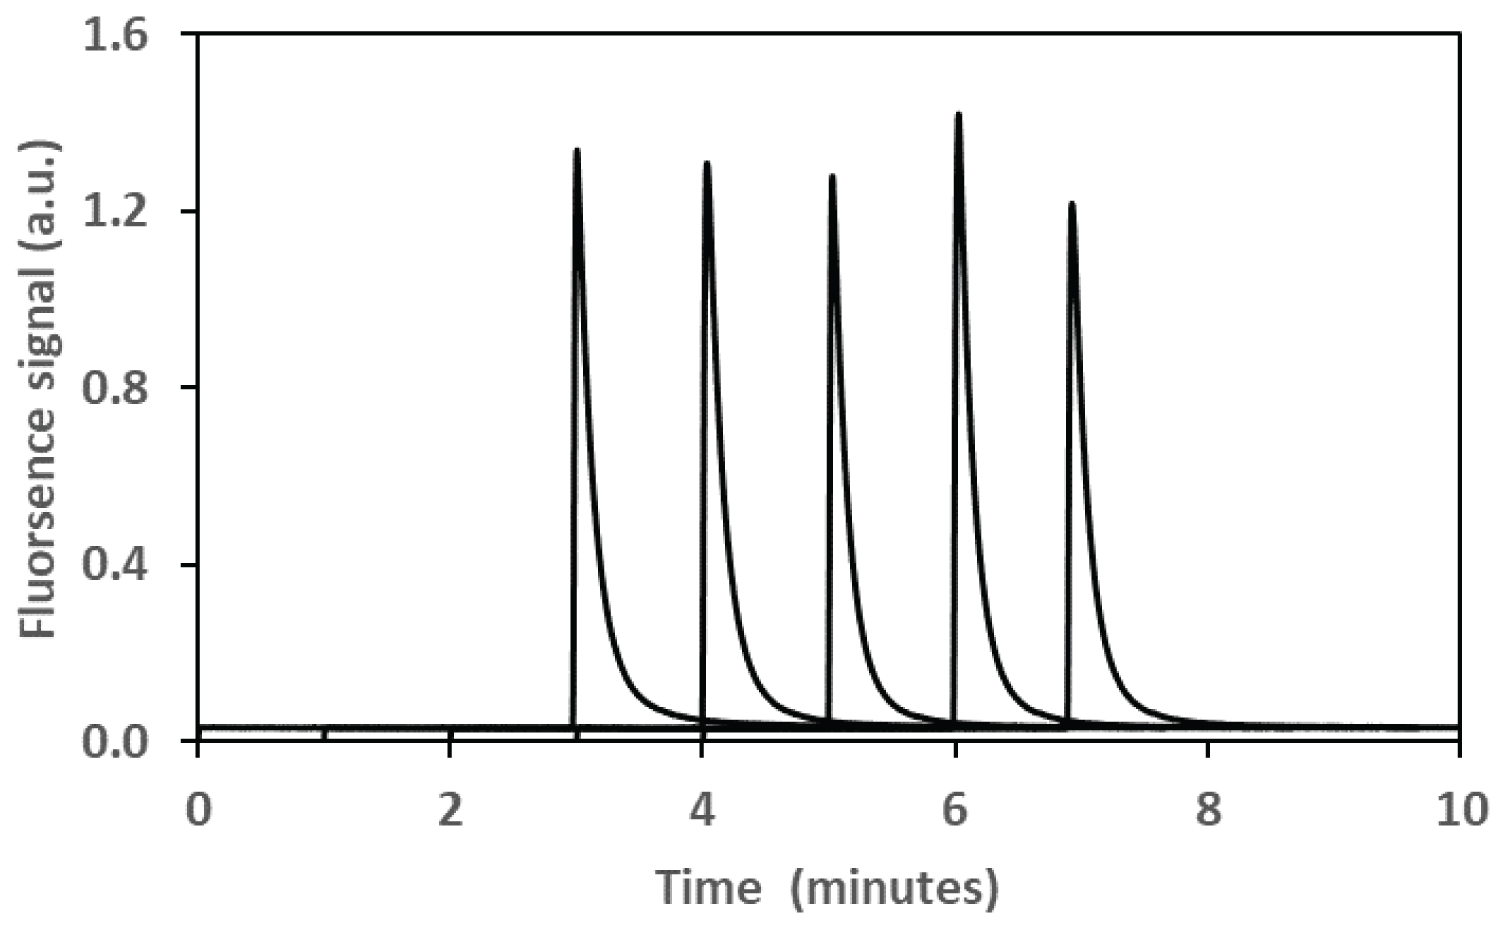
One of the challenges with using a spectrometric approach to detect phosphate as aggregate species of Rhodamine B is the sample size requirement. Targeted studies of small samples, such as the spatial detection of phosphate near root tips becomes challenging. Therefore, capillary electrophoresis with laser induced fluorescence was explored as an alternative method that was analogous the bench top fluorescence spectrometer. To this end the feasibility of using capillary electrophoresis with laser induced fluorescence detection was investigated for detecting the R-B-Mo P complex in aqueous solutions. For these experiments, a stock solution of 0.011M Rhodamine B dye was initially dissolved in DMSO rather than water. The Rhodamine B reagent was prepared by mixing 3.0 mL of 1.074 × 10⁻³ M of RB with 1.0 mL of 0.05M 2-(N-morpholino)- ethanesulfonoate (MES) buffer and 1.0 mL of 0.017 M ammonium heptamolyb date. For separations, 0.5 mL of sample was added to 0.3 mL of the mixture and diluted to a final volume of 2.5 mL in a centrifuge tube. For these separations a 20 cm capillary was used (10 µm id). A407 nm LASER was used as an incident light source and the scattered light was detected with an 770 nm interference filter. Elution of the R-B-MoP complex from a 30 cm capillary (10 µm) required approximately 2 minutes. The electropherograms shown in Figure 4 reveals that a sharp peak for the R-B-Mo P was not observed, rather a broad peak emerged which that preceded an intense fluorescence signal. This rather broad peak was not unexpected as the very nature of this large complex species would suggest that the light scattering particles formed from this complex must be somewhat defined in terms of mass and charge. Reproducible signals were observed by maintaining reasonably consistent sample preparation and measurement conditions. Figure 4 also shows the change in the signal of scattered light from the RB-complex with different concentrations of phosphate. When peak height is plotted against concentration a linear calibration curve was achieved between 0 and 0.6 µg mL-1 P (as PO4-3) as shown in Figure 5.
An interesting property of the R-B-MoP complex is that it adheres to ground glass and plastic surfaces. To take advantage of this property experiments were also conducted to investigate the feasibility of quantifying phosphate by detecting quantity R-B-MoP complex that is adsorbed on the plastic surface of a plastic centrifuge tube. For these experiments, 1.0 mL of the Rhodamine-B-Mo complex in 5M HCl was placed in a 1.5 mL plastic centrifuge tube. Phosphate containing standards or samples (0.1 mL) were added to the complex and allowed to sit for 5 minutes. The mixture was then centrifuged for 6 minutes at 13000 rpm. The supernatant solution was removed with an Eppendorf pipette and the complex adhering to the plastic was washed twice with 1M HCl before dissolving it with 1 mL of 50 mM CHES buffer (pH = 9.5). Prior to injection into the CE, the sample was diluted 5-fold with running buffer (30 mM CHES with 40% formamide, pH = 9.5). Addition of this alkaline buffer caused the Rhodamine-B molybdo-phosphate complex to dissociate very quickly during the dissolution step. As a result of the dissociation, the quantity of dissolved Rhodamine-B detected using CE was proportional to the quantity of phosphate in the sample.
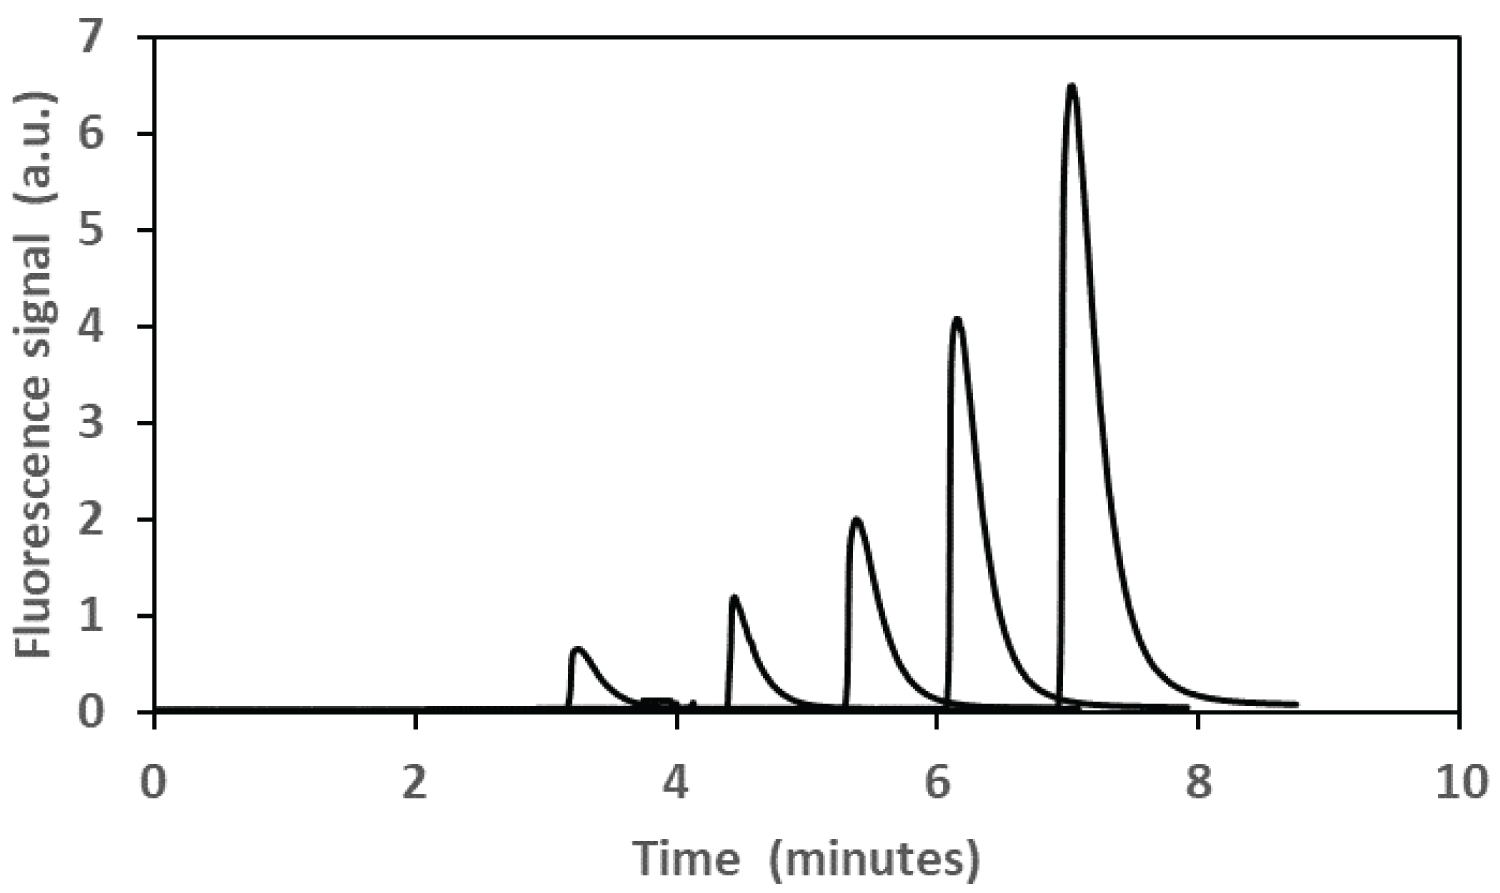
For these experiments, samples were injected electro-kinetically for 5s and the retention time was just over 3 minutes at 16kV. A 407 nm diode LASER was used for the incident light and a 680 nm interference filter was used to capture the fluorescent light from the Rhodamine B. As expected, the Rhodamine B produced a well-defined peak in the electropherogram that could be integrated with a high degree of reproducibility as the peaks did not tail. To investigate this property a series of five samples containing an identical concentration of phosphate standard (0.06 µg mL-1 P) were prepared and the results of this experiment are summarized in Figure 6. The reproducibility of the signals achieved using 5 different samples was ± 6.08%. Figure 7 shows the relationship between the concentration of phosphate and the fluorescence of the Rhodamine B detected using capillary electrophoresis.
The useful concentration range for detecting Rhodamine B was 0 to 1.6 µg mL-1 (P) with an r2 = 0.999. Although the sample size chosen was 1.5 mL, significantly smaller volumes can also be used for detecting reactive phosphate in aqueous samples since the CE can inject from a sample volume of as little as 1 µL. Sensitivity was also a function of the applied voltage on the PMT detector. Using this data, a limit of detection was determined (D.L. = 3 s/m) using CE-LIF was determined to be 0.014 µg mL-1. Overall, the range of concentrations, limit of detection and sensitivity of CE would make this approach entirely suitable for determining reactive phosphate in soil solutions (pore water or flood water).
Conclusions
Determining the concentration of PO4-3 using a bench top fluorescence spectrometer was achieved. Detecting light at 700 nm likely resulted in minimal chemical and spectroscopic interferences. Formation of the light scattering aggregate species requires some time (e.g. 10 minutes) to form and therefore, allowing the complex-formation time to form will give the best results. This is comparable to the molybdate blue method which also requires time for the blue coloured complex to form. Addition of PVA to the sample solutions was particularly helpful, however to achieve the best results it is recommended that a reasonably consistent amount of time for the aggregates compounds to form for all measurements. Overall, reasonably low detection limits for PO4-3 can be achieved and the working range (0-1 mgL-1) for this approach is well within the concentrations for PO4-3 that you would expect in pore water samples with most soils. The simplified procedure and reasonably short turnaround of samples gives this approach comparable a significant advantage of most separation techniques such as HPLC or ion chromatography.
Acknowledgments
We declare that we do not have any commercial or associative interest in connection with the work submitted. The authors wish to acknowledge financial support from the National Sciences and Engineering Research Council of Canada (NSERC) and well as support for this research from the University of Winnipeg.
Statement of Novelty
• Rhodamine B forms a complex with molybdate that will selectively form a charge complex with reactive phosphate (PO4-3).
• The Rhodamine B molybdo-phosphate complex will scatter light (MIE scattering).
• A method was developed to measure PO4-3 in aqueous samples by measuring scattered light at 700 nm with a spectrofluorimeter as well as with capillary electrophoresis.
• This approach offers the possibility of rapid analysis of PO4-3 using small sample sizes with very low detection limits.
References
- Van Loon GW, Duffy SJ (2000) Environmental Chemistry: A global perspective. Oxford University Press 295-298.
- Cade-Menun BJ, Doody DG, Liu CW, et al. (2017) Long-term changes in grassland soil phosphorus with fertilizer application and withdrawal. J Environ Qual 46: 537-545.
- Borda T, Celi L, Zavattaro L, et al. (2011) Effect of agronomic management on risk of suspended solids and phosphorus losses from soil to waters. J Soils Sediments 11: 440-451.
- Tang W, Shan B, Zhang H (2010) Phosphorus buildup and release risk associated with agricultural intensification in the estuarine sediments of Chaohu Lake Valley, Eastern China. Clean-Soil Air Water 38: 336-343.
- Schindler DW (1977) Evolution of phosphorus limitation in lakes. Science 195: 260-262.
- Schindler DW, Carpenter SR, Chapra SC, et al. (1997) Reducing phosphorous to curb lake eutrophication is a success. Environ Sci Technol 50: 8923-8929.
- Benson-Evans K, Antoine R, Antoine S (1999) Studies of the water quality and algae of Llangorse Lake. Aquatic Conservation-Marine and Freshwater Ecosystems 9: 425-439.
- Xia Y, Zhang M, Tsang DCW, et al. (2020) Recent advances in control technologies for non-point source pollution with nitrogen and phosphorous from agricultural runoff: Current practices and future prospects. Applied Biological Chemistry 63: 8.
- Turner B, Frossard E, Baldwin D (2005) Organic phosphorus in the environment. (1st edn), CABI Publishing, Wallingford, UK.
- Baldwin DS (2013) Organic phosphorus in the aquatic environment. Environ Chem 10: 439-454.
- El-Rifai H, Heerboth M, Gedris TE, et al. (2008) NMR and mass spectrometry of phosphorus in wetlands. Eur J Soil Sci 59: 517-525.
- Cooper WT, Llewelyn JM, Bennett GL, et al. (2005) Mass spectrometry of natural organic phosphorus. Talanta 66: 348-358.
- Van Moorleghem C, Six L, Degryse F, et al. (2011) Effect of Organic P Forms and P present in inorganic colloids on the determination of dissolved P in environmental samples by the diffusive gradient in thin films technique, ion chromatography, and colorimetry. Anal Chem 83: 5317-5323.
- Ruiz-Calero V, Galceran MT (2005) Ion chromatographic separations of phosphorus species: A review. Talanta 66: 376-410.
- Goyal SS (1997) Applications of column liquid chromatography to inorganic analysis in agricultural research. J Chromatogr 789: 519-527.
- Curtius AJ, Schlemmer G, Welz B (1987) Determination of phosphorus by graphite furnace atomic absorption spectrometry. Part 2. Comparison of different modifiers. J Anal At Spectrom 2: 115-124.
- Curtius AJ, Schlemmer G, Welz B (1986) Determination of phosphorus by graphite furnace atomic absorption spectrometry. Part 1. Determination in the absence of a modifier. J Anal At Spectrom 1: 421-427.
- Hughes DM, Grégoire DC, Naka H, et al. (1997) The vaporization of phosphorus compounds and the use of chemical modifiers for the determination of phosphorus by electrothermal vaporization inductively coupled plasma mass spectrometry. Spectrochim Acta-Part B: Atom Spectrosc 52: 517-529.
- Adesanwo OO, Ige DV, Thibault L, et al. (2013) Comparison of colorimetric and ICP methods of phosphorus determination in soil extracts. Commun Soil Sci Plant Anal 44: 3061-3075.
- Bandura DR, Baranov VI, Tanner SD (2002) Detection of ultratrace phosphorus and sulfur by quadrupole ICPMS with dynamic reaction cell. Anal Chem 74: 1497-1502.
- Murphy J, Riley JP (1962) A modified single solution method for the determination of phosphate in natural waters. Anal Chim Acta 27: 31-36.
- Basova EM, Ivanov VM (2012) Spectrophotometric determination of orthophosphate ions for conducting indicator investigations in stratal waters. Moscow University Chemistry Bulletin 67: 109-121.
- Grudpan K, Ampan P, Udnan Y, et al. (2002) Stopped-?ow injection simultaneous determination of phosphate and silicate using molybdenum blue. Talanta 58: 1319-1326.
- Kröckel L, Lehmann H, Wieduwilt T, et al. (2014) Fluorescence detection for phosphate monitoring using reverse injection analysis. Talanta 125: 107-113.
- Taga M, Kan M, Nasu T (1989) Determination of phosphate by flotation-fluorophotometry using ion-pair of molybdophosphate with Rhodamine 6G. Fresenius' Zeitschrift für analytische Chemie 334: 45-48.
- West TS, Kirkbright GF, Narayanaswamy R (1971) Spectrofluorimetric determination of orthophosphate as Rhodamine B molybdophosphate. Anal Chem 43: 1434-1438.
- Nasu T, Minami H (1989) Flotation-spectrofluorimetric determination of phosphate in natural water using Rhodamine B as an ion-pair reagent. Analyst 114: 955-958.
- Oshima M, Goto N, Susanto JP, et al. (1996) Determination of phosphate as aggregates of ion associates by light-scattering detection and application to flow injection. Analyst 121: 1085-1088.
- Motomizu S, Li ZH (2005) Trace and ultratrace analysis methods for the determination of phosphorus by flow-injection techniques. Talanta 66: 332-340.
- Li Z, Oshima M, Sabarudin A, et al. (2005) Trace and ultratrace analysis of purified water samples and hydrogen peroxide solutions for phosphorus by flow-injection method. Anal Sci 21: 263-268.
- Frank C, Schroeder F, Ebinghaus R, et al. (2006) Using sequential injection analysis for fast determination of phosphate in coastal waters. Talanta 70: 513-517.
Corresponding Author
Douglas Goltz M, Department of Chemistry, University of Winnipeg, Richardson College for the Environmental and Science Complex, The University of Winnipeg, Canada, Tel: 204-786-9748.
Copyright
© 2022 Carolyn GG, et al. This is an open-access article distributed under the terms of the Creative Commons Attribution License, which permits unrestricted use, distribution, and reproduction in any medium, provided the original author and source are credited.