Chemical Profiling of White, Red, and Black Rice (Oryza Sativa L.) During Grain Development Based On LC-QTOF-MS/MS
Abstract
In this study, the chemical constituents of the three rice varieties were investigated at each of the five stages of grain development using Accurate-Mass Spectrometry (LC-ESI-QTOF-MS/MS). The varieties were: White (Dok Mali105), red (red Dok Mali), and black (Rice Berry) in acidified methanolic extract. Over 80 compounds of the primary and secondary metabolites were tentatively identified. Significant differences in phytochemical content of the rice varieties and maturing stage were clarified. All three varieties used in this study contained the primary metabolites: Sugar, fatty acids, organic acids and amino acids in a free and conjugated form. The secondary metabolites of rice pigments; cyanidin and peonidin glycosides occur in black rice, whereas red rice contains catechin, a compound in procyanidin. The phenolic compounds protocatechuic acid and vanillic acid were found in red and black rice. The secondary metabolites are reported as bioactive and beneficial to health. These phytochemical compounds revealed a distinct grouping of the different rice species on the basis of their metabolite profiles via principal component analysis. This result can be used for selecting a rice variety and stage of grain development at which phytochemical presents relevance to the health benefit and new breeding.
Keywords
Chemical profiling, Grain development, PCA, Rice, Oryza sativa
Introduction
Rice (Oryza sativa L.) is a staple food of many Asian countries. Thai rice is well known for its unique texture, tenderness, jasmine aroma and distinguished taste. White rice is commonly consumed while red, black, and brown (unpolished white rice) have increased in popularity due to their antioxidant properties and phenolic content. Phenolic compounds are secondary metabolites and are known to have various beneficial physiological effects in humans, such as protection against the development of various cancers, cardiovascular diseases, diabetes, osteoporosis and neurodegenerative diseases [1,2]. Black and red rice varieties were likewise demonstrated to have a beneficial anti-oxidative and anti-inflammatory effect in rabbits in vivo [3,4]. The cyanidin-3-glucoside and peonidin-3-glucoside in black rice showed antioxidant activities in preventing DNA damage and LDL deterioration in vitro and also suppressed the production of nitric oxide in the activated macrophage without introducing cytotoxicity [5].
Three rice varieties; white (Dok Mali105; W), red (red Dok Mali; R) and black (Rice berry; B) were used in this study. Red rice is a gene mutation from white rice with red color at the pericarp and has a jasmine aroma similar to white rice. The rice berry is a cross-breed between Hom Nil (glutinous black rice) and Dok Mali 105 rice resulting in black color grain and a fragrant smell. The major classes of phenolic compounds present in rice are phenolic acids, flavonols, anthocyanins and procyanidins. While non-pigmented varieties generally contain only phenolic acids, pigmented rice is rich in polyphenolic compounds. In particular, red rice is characterized by the presence of procyanidins, whereas black rice contains anthocyanins and procyanidins may also be present, depending on the variety [6]. The major phenolic acids found in whole grains are ferulic acid, vanillic acid, caffeic acid, syringic acid and p-coumaric acid [7]. Four different anthocyanins (cyanidin-3-glucoside, peonidin-3-glucoside, cyanidin-3, 5-diglucoside, cyanidin-3-rutinoside) have been identified in black rice [8]. Mavidin and petudinin-3-glycoside have also been found in black rice while the red rice cultivar contains only malvidin [9]. As well as anthocyanins, flavonoids such as; taxifolin, myricetin, isorhamnetin in glycoside form have been detected in Thai black rice bran [10]. Beside this, sucrose esters of hydroxycinnamic acid, ferulic acid and sinapic acid were isolated from methanol extracts of rice bran [11].
Recently, High-performance liquid chromatography coupled to electrospray ionization quadrupole time-of-flight mass spectrometry (HPLC-ESI-QTOF-MS/MS) is a useful technique in metabolites study. This technique can separated and identify a vast number of chemical compounds present within the plants without purification step. The accuracy of the mass data together with their exact mass, molecular formulas and fragment ions pattern enables good interpretation of results. Thus, structural elucidation can be performed in the absence of the authentic standards.
Several researchers have studied bioactive and phenolic compounds in rice grain and husk during the stages of grain development [12-16], but information on the phytochemical constituents in the rice grain varieties is limited.
The purpose of this study is to characterize phytochemical constituents in five stages of grain development of three rice variety using Accurate-Mass Spectrometry (LC-ESI-QTOF-MS/MS). As well as principal component analysis (PCA) was used for discrimination of rice varieties by means of their phytoconstituents.
Experimental
Chemicals and reagents
Acetonitrile (ACN), methanol (MeOH) and water (LC/MS reagent) were purchased from RCI Lab Scan (Bangkok, Thailand). Formic acid (analytical grade) was obtained from Merck (Darmstadt, Germany). A 0.2 μm Nylon disposable membrane filter was supplied from Vertical Chromatography, Thailand. Other unmarked reagents were of analytical grade.
Reference standard; Cyanidin chloride (PubChem CID: 68247), Peonidin-3-glucoside chloride (PubChem CID: 443654), Cyanidin-3-glucoside (PubChem CID: 92131208); (+)-Catechin (PubChem CID: 9064), were purchased from Fluka, Germany.
Rice grain production
Three rice varieties; white rice; Dok Mali105 (W), red rice; Red Dok Mali (R) and black rice; Rice berry (B) were used in this study based on the color. Rice plants of each variety was cultivated in Phichit Province, Thailand with the same location and cultivation methods. All rice cultivars were planted in July 2015 and harvested in November 2015. The grain was sampled at 7, 14, 21, 28, and 35 days after the flowering day. The grains were gradually de-hulled by hand, freeze dried, ground with pestle and mortar and kept in plastic bags and then stored at -20 °C for further use [16].
Acidified methanolic extract of rice samples
The rice powder was defatted and color using hexane, and then the powder was dried in a hot air oven at 50 °C for 5 h. The dried powder (0.5 g/20 ml) was then macerated in acidified methanol (1M HCL:MeOH; 15:85 v/v) for 1 h, and vortexed for 2 min (Vortex genie2, USA) and supernatant was separated by centrifugation at 5000 rpm for 10 min. The residual was re-extracted twice with similar procedures. The pool of supernatant was evaporated to dry at 40 °C under vacuum, after which the extract was freeze dried to make a powder [16]. The extracted powder was weighed and re-dissolved in methanol at a concentration of 15 mg/mL for structure elucidation.
Standard solutions preparation
Stock solutions of the reference compounds were prepared by dissolving each compound in methanol at concentration 1 mg/mL. The reference compounds mixtures at a concentration of 10 μg/mL were prepared and used for confirmation of the identity.
Instrumentation LC-ESI-QTOF-MS/MS conditions
Chemical profiling from the acidified methanolic extracts of the rice cultivars with different grain maturity were analyzed by mass spectrometry. The analysis was performed on a 6540 UHD Accurate-Mass-Q-TOF-LC/MS (Agilent Technologies, Palo Alto, CA, USA). The HPLC column was reversed phase Luna C-18, 4.6 × 150 mm, 5 μm (Phenomenex, USA). The mobile phases were 0.1% formic acid in water (A) and 0.1% formic acid in acetonitrile (B). The conditions for HPLC were as follows: at 0 min 95:5 (A:B v/v) linear gradient to 30:70 (A:B v/v) in 15 min. Post run 5 min for column equilibrium before starting a new injection. Column temperature 35 °C, flow rate 0.5 mL/min, and injection volume 5 μL, were used for all analyses. Mass spectra in the m/z range 100-1200 amu were obtained by both (+) ESI and (-) ESI modes with a 250 ms/spectrum. In the ESI source, nitrogen was used as a nebulizer for drying and as a collision gas. The heated capillary temperature was set to 350 °C and nebulizer pressure to 30 psig. The drying gas flow rate was 10 L/min, and the ion source parameters, voltage for the Vcap, was set at 3500 V, the fragmentor 100 V, skimmer 65 V and octopole RF Peak 750 V. The MS/MS analyses were acquired by auto MS/MS fragmentation where the three most intense mass peaks were fragmented. Collision energy values for MS/MS experiments were fixed at 10 V, 20V and 40 V for each selected mass. Accurate mass measurements were obtained by the auto mass calibration method which was performed using an external mass calibration solution (ESI-L Low Concentration Tuning Mix; Agilent calibration solution B). Acquisition of the data was done using the Agilent LC-MS-QTOF Mass Hunter Data Acquisition Software version B.05.01 and the data subsequently analyzed using the Agilent Mass Hunter Qualitative Analysis Software B 06.0 (all software from Agilent Technologies, USA).
Mass data interpretation
Chemical identification was performed by comparison of the retention times, mass spectra and fragmentation patterns, with reference compounds, and the published data discovered in our search of the Mass Hunter Metlin metabolite PCD/PCDL database (Agilent Technologies) and the publicly available databases Chemspider (http://www.Chemspider.com), Massbank (http://www.massbank.eu), Lipid Maps Structure Database (http://www.lipidmaps.org). Human Metabolome database (http://www.hmdb.ca). Molecular formula was generated by the Agilent Mass Hunter Qualitative Analysis Software B 06.0. Principal component analysis (PCA) was performed on the statistical software package SIMCA 13.0.3 (Umetrics, Sweden).
Results and Discussion
In this study, the molecular formula was established by high-accuracy quasi-molecular ions such as [M-H]-, [M + Cl]-, [M + HCOO]- and [M + Na]+, [M + H]+ with in a mass error of 15 ppm and fractional isotope abundance, and the most rational molecular formula was searched in the various chemical databases. The mass fragmentations were used to further confirm the chemical structure. The chloride adduct [M + Cl]- occurred due to the extraction solvent containing hydrochloric acid (HCl).
Identification of chemical constituents in rice; Primary metabolites
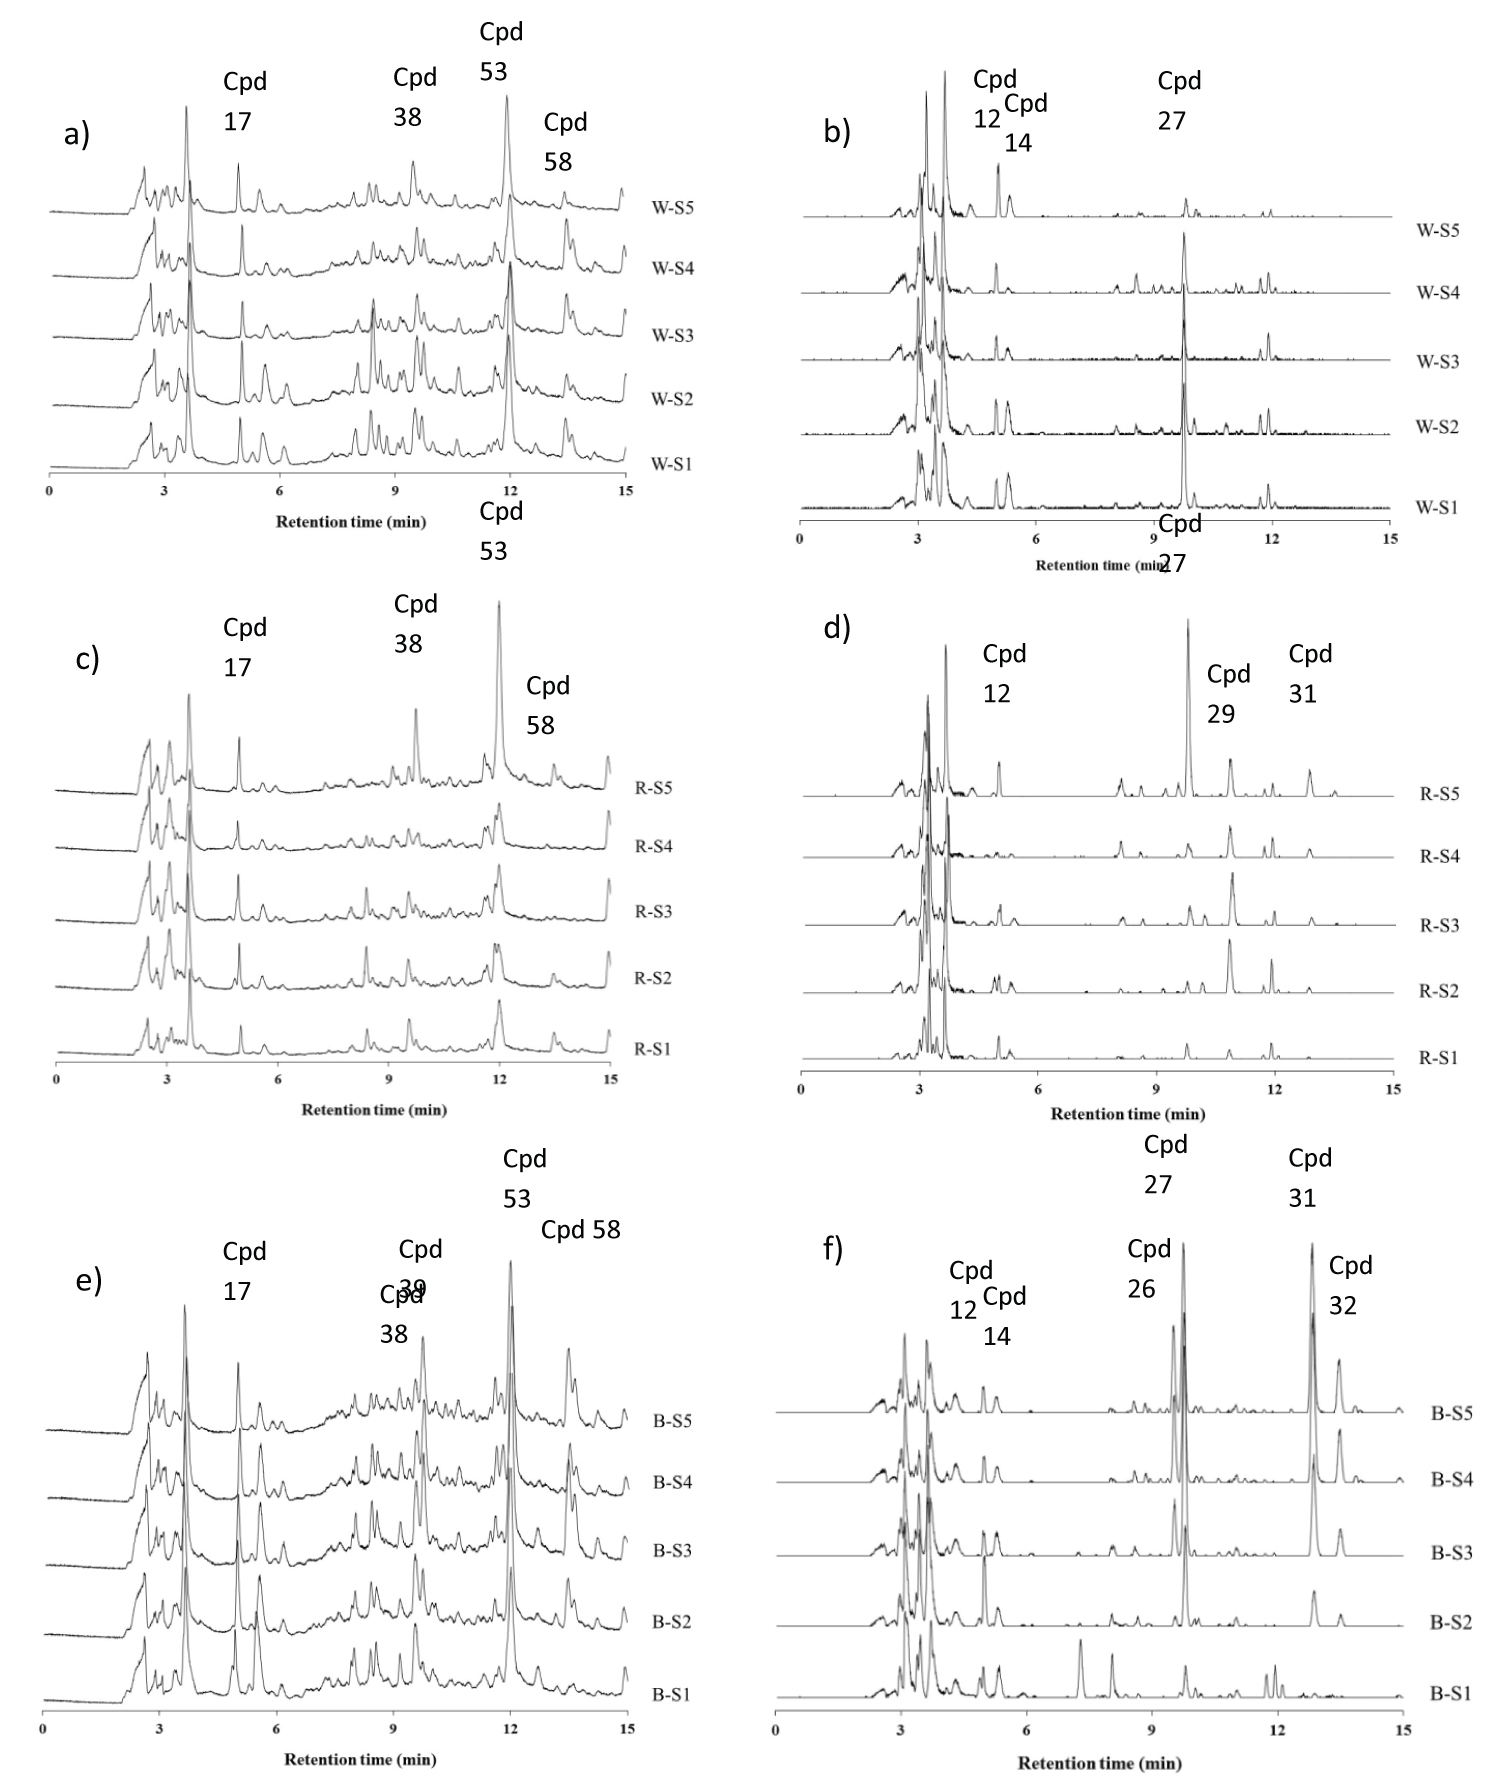
The mass data in the positive and negative modes showed m/z as an even number which implies that the nitrogen contained at least one molecule. Thirty-eight compounds were identified as amino acids in free and conjugated form, but which varied depending on rice varieties and stage of grain development. The sugars: Glucose and sucrose were also found, as were fatty acids conjugated with amino acids. The basis of the proposed identifications is shown in (Table 1) [positive mode (+ ESI)] and (Table 2) [negative mode (-ESI)]. The data in table is category in each variety of rice, two combinations and all found in three varieties. The total ion chromatograms of phytochemical profiling of the three rice varieties at each stage of grain development are shown in (Figure 1). The chemical compounds clearly change during gain development are marked.
Identification of chemical constituents in rice; Secondary metabolites
Secondary metabolites are named as bioactive compounds. In black rice at stages 3-5, the m/z 449[M]+ (8.8 min) and m/z 463 [M]+ (9.3 min) were observed. These two mass spectra had ion fragments of m/z 287 and 301, respectively, suggesting the loss of one glucose moiety (m/z 162). These two compounds are cyanid in-3-glucoside and peonidin-3-glucoside which we identified by comparisons with authentic compounds. Cyanidin was also found in black rice at stages(S) 4,5. Other phenolic compounds found included trans-4-hydroxy-3-methoxycinnamate,4,2',4'-Trihydroxydihydrochalcone (B:S1), Protocatechuic acid (R: S4-5,B: S2-5), Catechin (R: S2,3), p-Hydroxybenzoic acid,Tricetin-7-glucoside (B: S5),Vanillic acid (R: S2-5,B: S2-5), 3,3',4,5'-Tetrahydroxy-trans-stilbene, and 5,8,4'-Trihydroxy-3,6,7-trimethoxy flavone. In this experiment, red rice does not contain anthocyan in pigments, which is in agreement with Pengkumsri, et al. [17] and also with Kim, et al. [18] who concluded also that red rice does not contain anthocyanin pigments, but also found that red rice contains the procyanidin called catechin, which we found as well. The chromatogram and proposed identification are shown in (Figure 1) and (Table 1 and Table 2).
Discrimination of white, red and black rice grain by LC-MS fingerprint analysis and chemometrics
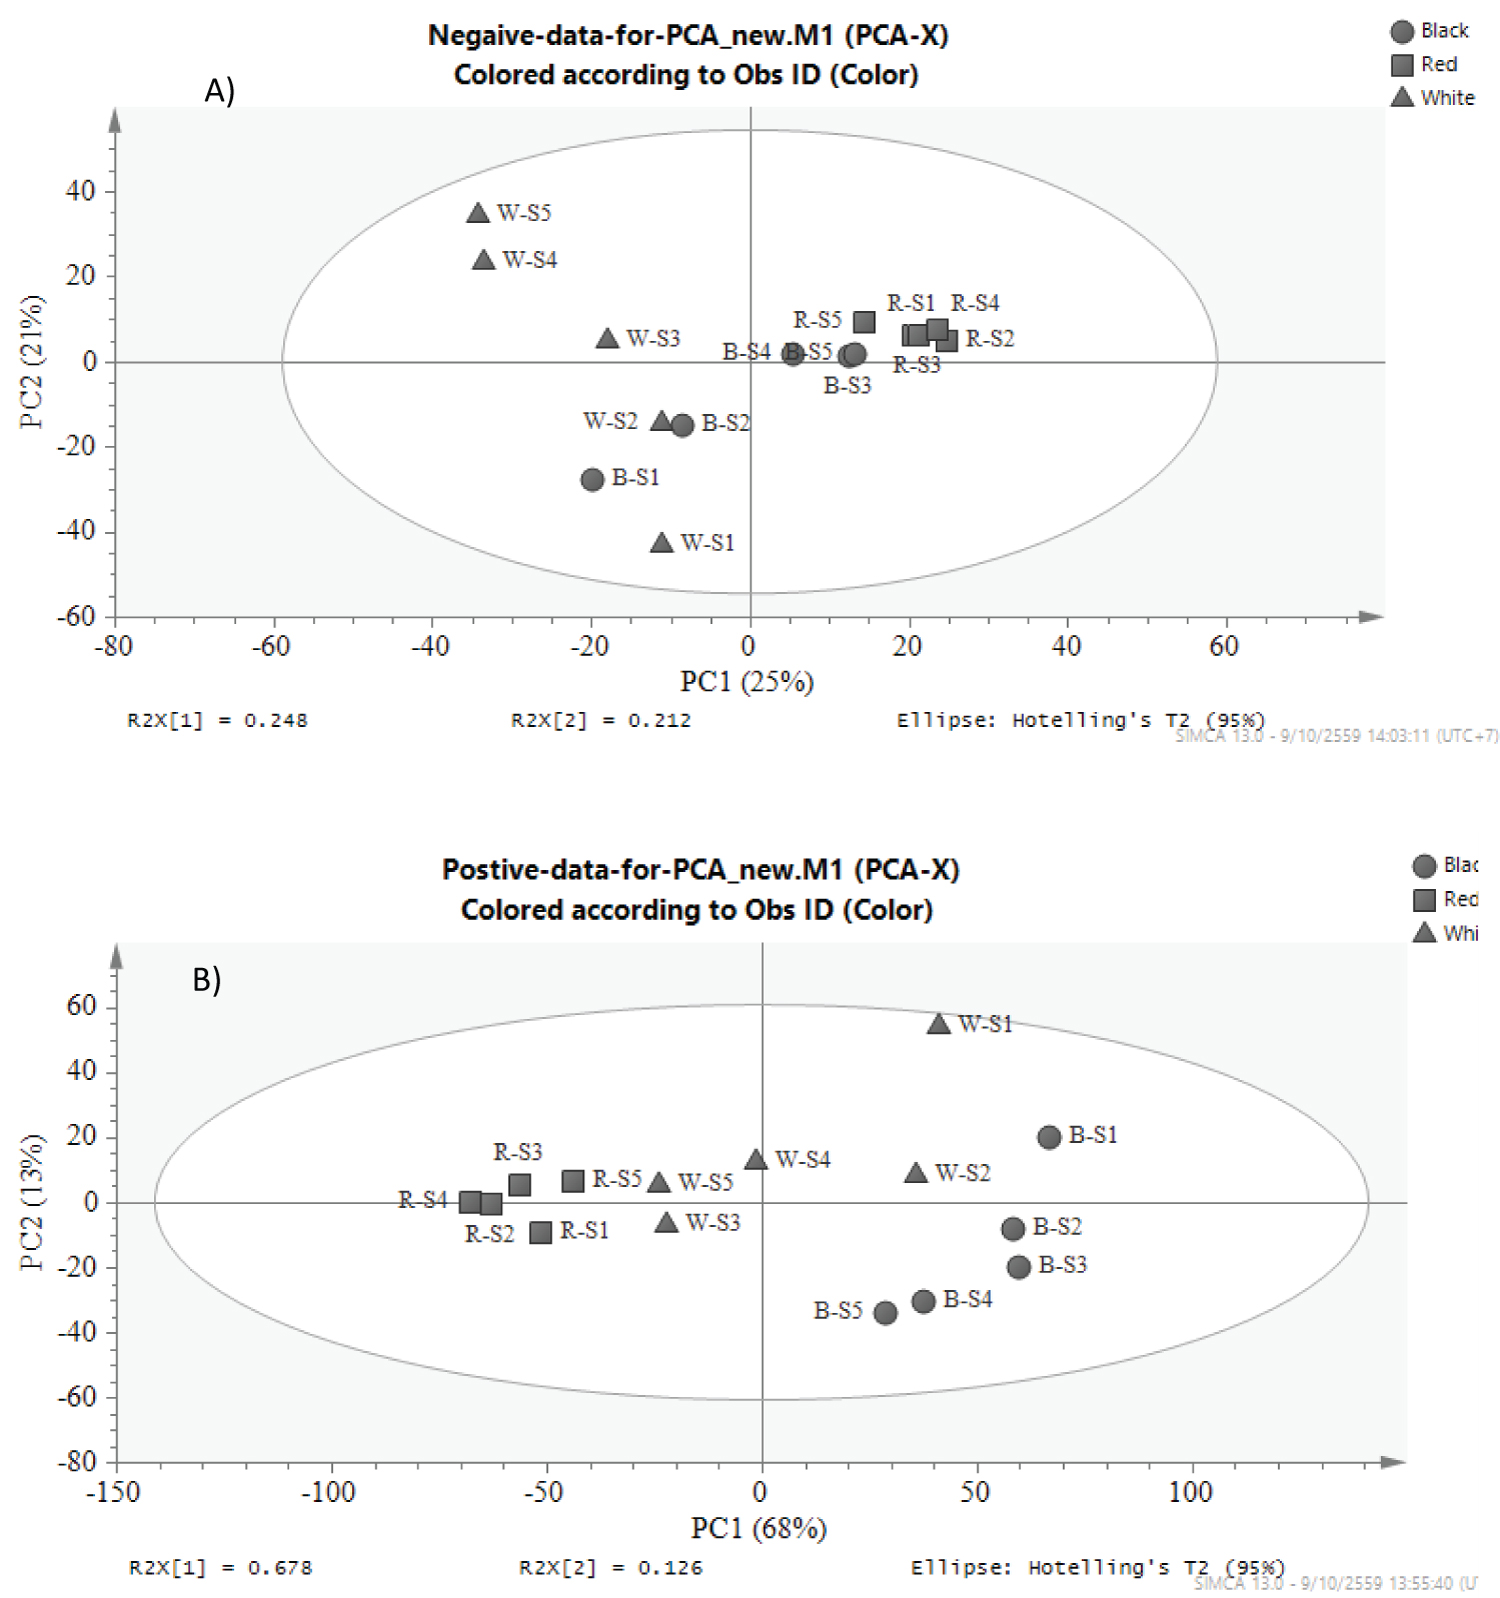
Remarkable differences were observed in the contents of the compounds in all samples. PC A model was used for discrimination and classification of samples according to their type of the rice and stages of grain development. In this PCA study, retention times and peak intensities of each chromatogram in both negative and positive modes were bucketed at every 0.004 min using the SIMCA Software. All obtained data were then analyzed for giving scores plots of principle component 1 (PC1) versus principle component 2 (PC2) (Figure 2). The PCA scores plot of the data from negative ionization presented that the separation between red rice and white rice is more significant than red rice and black rice (Figure 2a) which explained by PC1 with 25% variance, while the group of red rice and black rice is more significant difference in positive ionization using PC1 for explaining with 68% variance (Figure 2b). These results indicated that the fingerprint of red rice is different from other rice in terms of different chemical constituents and the quantity of compounds. In the case of the stages of grain development, red rice is not that much different in each stage when compared to other rice varieties, especially white rice. Red rice is a gene mutation from white rice. Black rice is bred from white rice therefore the chemical constituents are close to white rice.
Conclusions
This study describes a comprehensive investigation of phyto-constituents in three rice varieties with different phenotypic background and stages of grain development. The complex development of phytochemicals in rice varieties which we confidently suggest will be of significant benefit to the agri-food industry, informing the future work of developing new rice varieties with enhanced health promoting phytochemicals. In addition to phytochemical information, we provide an important frame work for quality control analysis and the determination of varieties by applying chemical profiling in our analysis. The established LC-ESI-QTOF-MS/MS approach is shown to be a suitable and powerful for the qualitative analysis of the phytochemicals in rice.
Credit Author Ship Contribution Statement
Nitra Nuengchamnong: Conceptualization, Methodology, Visualization, Software, Writing-Review & Editing. Tongchai SaeSong: Data Curation, Software. Paradon Ngamdee: Methodology. Sudarat Jiamyangyuen: Project Administration, Resources, Conceptualization.
Declaration of Competing Interest
The authors declare no conflict of interest.
Acknowledgements
The financial support of this work was provided by Office of the Higher Education Commission (Fiscal year 2015) through Naresuan University, Thailand. The authors greatly appreciated. Thanks also to Mr. Kevin Roebland Mr. Roy Morien of the Naresuan University Language Centre for his editing assistance and advice on English expression in this document.
References
- Graf BA, Milbury PE, Blumberg JB (2005) Flavonols, flavonones, flavanones and human health: Epidemological evidence. Journal of Medicinal Food 8: 281-290.
- Arts IC W, Hollman PCH (2005) Polyphenols and disease risk in epidemiologic studies. American Journal of Clinical Nutrition 81: 317-325.
- Ling WH, Cheng QX, Ma J, et al. (2001) Red and black rice decrease artherosclerotic plaque formation and increase antioxidant status in rabbits. Journal of Nutrition 131: 1421-1426.
- Ling WH, Wang LL, Ma J (2002) Supplementation of the black rice outer layer fraction to rabbits decreases the atherosclerotic plaque formation and increases antioxidant status. Journal of Nutrition 132: 20-26.
- Hu C, Zawistowski J, Ling H, et al. (2003) Black rice (Oryza sativa L. indica) pigmented fraction suppresses both reactive oxygen species and nitric oxide in chemical and biological model systems. Journal of Agricultural and Food Chemistry 51: 5271-5277.
- Finocchiaro F, Ferrari B, Gianinetti A (2010) A study of biodiversity of flavonoid content in the rice caryopsis evidencing simultaneous accumulation of anthocyanins and proanthocyanidins in a black-grained genotype. Journal of Cereal Science 51: 28-34.
- Zhou ZK, Robards K, Helliwell S, et al. (2004) The distribution of phenolic acids in rice. Food Chemistry 87: 401-406.
- Hou Z, Qin P, Zhang Y, et al. (2013) Identification of anthocyanins isolated from black rice (Oryza sativa L.) and their degradation kinetics. Food Research International 50: 691-697.
- Chen XQ, Nagao N, Itani T, et al. (2012) Anti-oxidative analysis, and identification and quantification of anthocyanin pigments in different coloured rice. Food Chemistry 135: 2783-2788.
- Sriseadka T, Wongpornchai S, Rayanakorn M (2012) Quantification of flavonoids in black rice by liquid chromatography-negative electrospray ionization tandem mass spectrometry. Journal of Agricultural and Food Chemistry 60: 11723-11732.
- Tian S, Nakamura K, Kayahara H (2004) Analysis of phenolic compounds in white rice, brown rice and germinated brown rice. Journal of Agricultural and Food Chemistry 52: 4808-4813.
- Butsat S, Weerapreeyakul N, Siriamornpun S (2009) Changes in phenolic acids and antioxidant activity in Thai rice husk at five growth stages during grain development. Journal of Agricultural and Food Chemistry 57: 4566-4571.
- Lin PY, Lai HM (2011) Bioactive compounds in rice during grain development. Food Chemistry 127: 86-93.
- ShaoY, Xu F, Sun X, et al. (2014) Phenolic acids, anthocyanins, and antioxidant capacity in rice (Oryza sativa L.) grains at four stages of development after flowering. Food Chemistry 143: 90-96.
- Kim NH, Kwak J, Baik JY, et al. (2015) Changes in lipid substances in rice during grain development. Phytochemistry 116: 170-179.
- Jiamyangyuen S, Nuengchamnong N, Ngamdee P (2017) Bioactivity and chemical components of Thai rice in five stages ofgrain development. Journal of Cereal Science 74: 136-144.
- Pengkumsri N, Chaiyasut C, Saenjum C, et al. (2015) Physicochemical and antioxidative properties of black, brown and red rice varieties of northern Thailand. Food Science and Technology (Campinas) 35: 331-338.
- Kim MK, Kim H, Koh K, et al. (2008) Identification and quantification of anthocyanin pigments in colored rice. Nutr Res Pract 2: 46-49.
Corresponding Author
Nitra Nuengchamnong, Science Laboratory Centre, Faculty of Science, Naresuan University, 99 Moo 9, Thapho, Muang, Phitsanulok, 65000, Thailand, Tel: +66-55-963176
Copyright
© 2020 Nuengchamnong N, et al. This is an open-access article distributed under the terms of the Creative Commons Attribution License, which permits unrestricted use, distribution, and reproduction in any medium, provided the original author and source are credited.