The Influence of UV Irradiation on Diabetic Mice Skin: A Vibrational FT-IR and Raman Spectroscopic Study
Abstract
The aim of this study was to investigate the effect of UV irradiation on streptozotocin-induced diabetic skin. 42 hairless male mice were divided into three groups of control non-diabetic and with dose of streptozotocin 20 and 30 mg/kg. Both FT-IR and Raman spectra showed considerable changes between the diabetic and non-diabetic mice, as well as after irradiation. The most important changes between healthy and diabetic groups were observed in the reduction of vOH intensity absorption bands (4000-3600 cm-1), resulting from dehydration of the skin and hyaluronic acid degradation. The increase of the absorption bands of symmetric and antisymmetric methylene groups in the spectral region 3000-2850 cm-1 is related to the increased lipophilic environment of diabetic mice skin. The intensity of these bands increases further upon irradiation. The characteristic "marker band" for the oxidative stress at 1744 cm-1, due to malondialdehyde formation, increases upon irradiation and it is higher in diabetic tissues. The absorption bands of amide I at 1650 cm-1and amide II at 1550 cm-1 shift to higher and lower frequencies, respectively, concerning the production of amyloid like proteins, in agreement with the increase of the lipophilic environment. These shifts are more pronounced in infrared spectra. The band at 1171 cm-1, assigned to C-O-C vibration, increases upon diabetes and skin cancer development. It is important to notice that the mice who received 30 mg/kg streptozotocin showed high resistance to UV irradiation. It seems that streptozotocin inhibits the free radicals, which are produced by UV radiation, to interact with important biological molecules. The protective role of streptozotocin on diabetic mice skin from UV irradiation are unclear. The above observations were in agreement with clinical and literature data.
Keywords
Diabetes, Skin cancer, Streptozotocin, UV irradiation, Infrared spectroscopy, Raman spectroscopy
Introduction
Diabetes is a metabolic disorder characterized by hyperglycemia leading to access of advanced glycation end-products. It is well documented that the elevated glucose levels in serum causes significant pathological changes and increases the morbidity and mortality [1,2]. It is estimated that it affects about 6.1% of the population in Greece [3]. Diabetes is associated with a number of secondary implications due to oxidative stress. Streptozotocin (SZT) is an antibiotic and is worldwide used to induce experimental diabetes in mice [4].
Vibrational spectroscopies (infrared absorption and Raman scattering) have gained a lot of attention from the medical community as interesting tools for a non-invasive (non-destructive) characterization and identification of the molecular features of cancer [5-8]. Infrared spectroscopy (IR) is based on the changes of dipole moment of the molecules during the interaction with the infrared radiation [9,10], while Raman is based on the change of electric polarizability of the molecules [11,12]. Thus, the vibration spectra arise from the all active modes of biological molecules. IR and Raman spectroscopy are complimentary to each other. Both methods reveal information not only for the characteristic functional groups, such as CH, NH, OH, C-O-C, PO, etc. of hydrocarbon lipid chains, proteins, glycans, DNA, but also for the changes of the surrounding environment induced by the diseases. The most important spectral region to study the stretching vibrations of methyl and methylene group is located at 3200-2750 cm-1. The intensity changes and shifts of the vibration bands of CH3 and CH2 groups give important information concerning the fluidity and permeability of the membranes [1,6,7]. The increase or decrease of these bands is related with the order and disorder of lipids and the lipophilic environment [5-10] due to the interaction of acyl chains and the van der Waals and London forces which attract them [13]. Another IR sensitive region is located at 1700-1500 cm-1. In this special spectral region are found the vibrations of amide I and amide II of proteins. The shifts of the absorption bands to lower frequencies, the intensity changes, the shape of the bands, as well as the appearance of new bands reveal information about protein conformational changes and protein folding, induced by the diseases [5-10].
The infrared spectra are the "fingerprint" of cancers and they are very sensitive to structural changes of the biological molecules that are formed during the disease state leading to cancer [5-10]. FT-IR and Raman spectroscopy today are rapid and easy methods and can take vibrational spectra of excellent quality of skin cancerous tissues without any pre-preparation of the samples obtained from surgery. This is a major advantage of the application of ATR-FT-IR spectroscopy for histopathological assessment of skin cancers in the minimum sample preparation required in order to obtain very good infrared spectra. In the present work Fourier transform infrared (FT-IR) and Raman spectroscopy were used in order to study the influence of SZT dose administration and skin cancer development upon UV irradiation on diabetic mice skin. In the literature, there is not much data on the effect of long life exposure to UV radiation on diabetic skin. Moreover, we will study the role of SZT on diabetic skin upon irradiation.
Experimental Groups
Forty-two (42) SKH-2 hairless male mice were divided into six groups consisting of 7 mice each. The control non-diabetic (N) mice and irradiated control (IrN) mice; the diabetic mice injected with 20 mg/kg SZT (D20) and the corresponding irradiated (IrD20); the diabetic mice injected with 30 mg/kg SZT (D30) and the irradiated mice (IrD30). Diabetes was induced by given to each mouse five daily intraperitoneal IP injections of SZT (20 or 30 mg/kg) solution in sodium citrate buffer 0.1 M, pH 3.5-4.5.
The mice were irradiated by UVA (320-400 nm) and UVB (290-320 nm), using appropriate filters for these wavelengths. The dose rate was 6.5 mW/week (0.75 M.E.D., 4.5 s) during the first week and an increase of the dose 25% every next week until the 8th week with a maximum dose of 3.5 M.E.D, three times per week. The irradiation dose was calculated before every experiment by a Coldilux Smart Meter (70239) of Oriel Instruments, as described elsewhere [14].
Glucose levels were estimated electrochemically, using Freestyle Precision Model (Abbott Laboratories, USA) on a small blood drop taken from the tail of the mouse. Results were expressed in mg/dL. The mice were characterized diabetic when the glucose level was above 180 mg/dL with symptoms of polydipsia and polyuria.
Skin hydration was measured before and after irradiation through changes in the dielectric constant by applying the probe of the apparatus Corneometer CM 820 (Courage + Khazaka electronic GmbH, Köln, Germany) on the back treated skin of mice [14].
The last day of the experiments the mice were sacrificed and the mice samples were kept at -80 ℃ for further processing.
Skin Histology
For histopathological evaluation the skin biopsies were fixed in 10% formalin and embedded in paraffin. The 6 micrometer thick sections were stained with hematoxylin-eosin (HE) and evaluated at Athens Naval Hospital.
ATR-FT-IR Spectroscopy
In order to obtain the FT-IR and Raman spectroscopic data the skin sections immediately after the surgery were stored in formalin. Then, the samples were freeze dried. We have observed that by removing the paraffin of the samples the organic solvents remove also the soluble components of the tissues and thus important information about the progression of the disease. Furthermore, the formalin does not affect the infrared spectra and it is removed during the freeze-drying of the samples.
The Infrared spectra were recorded with an Attenuated Total Reflection (ATR)-FT-IR Nicolet 6700 thermo scientific spectrometer. With the ATR-FT-IR technique the samples were not homogenized and this allowed us to obtain spectra from different parts of the site in the tissues of each animal. In order to minimize the signal-to-noise ratio each spectrum consisted of 120 co-added spectra at a spectral resolution of 4 cm-1. The OMNIC 7.2a software was used for data analysis [6,7].
Raman Spectroscopy
The Raman spectra were recorded by using a micro-Raman spectrometer Invia confocal microscope (Renishaw, UK), with excitation at 785 nm and the power hit the sample was at 145 mwatt. Raman scattering was measured throughout with sequential 10 s integration time and microscope objective magnification x20. The excitation of 785 nm was more suitable for our skin tissues since the received spectra did not show any auto-fluoresce.
Results and Discussion
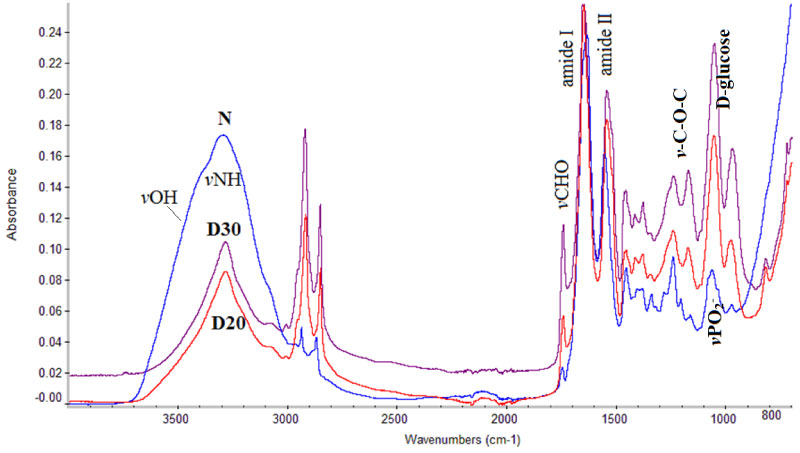
In Figure 1 are shown the FT-IR spectra of control (N), diabetic mice administrated with 20 mg/kg of SZT (D20) and diabetic mice administrated with 30 mg/kg of SZT (D30). In the spectral region of 3500-3000 cm-1 appear the bands due to the stretching vibrations of vNH and vOH groups of collagen and glycosaminoglycans in skin, as well as the stretching vibration bands of water molecules [10-12,15].
The band at 3484 cm-1 is assigned to the stretching vibration of vOH groups of water molecules, and to the polysaccharides of hyaluronic acid [15]. The intensity of this band decreases from normal non diabetic mice to diabetic D20 and D30. This observation leads to the suggestion that upon diabetes development dehydration of the skin is taking place. These results were confirmed upon the comparison of dielectric constant of the skin. It is known that hyaluronic acid is considered as the gold standard molecule to improve skin hydration [16]. The intense band at 3292 cm-1 is assigned to stretching vibration of vNH groups of proteins and shows that the protein formulation is in the form Amide A [15]. The band at about 3060 cm-1, increases in intensity from D20 to D30, suggesting that upon diabetes development the amide conformation of peptide bond changes form amide A conformation to amide B. The coexistence of the two bands shows that the proteins changed their secondary structure from α-helix to β-sheet. This observation was also found in coronary arteries of diabetic patients [1].
In the region between 3000-2850 cm-1 are the absorption bands of stretching vibrations of vC-H modes of methyl, vCH3 and methylene, vCH2 groups of membrane lipids, phospholipids and other macromolecules of the membranes. These bands were first characterized by Coblentz and Bonino in 1905 and 1929, respectively [17,18]. The frequencies and intensities of these bands give important information about the molecular structure of the molecules, as well as the fluidity of microenvironment. The shift of the frequencies antisymmetric and symmetric vibration bands of vCH2, at 2924 cm-1 and 2853 cm-1, respectively and the increase of their intensities in diabetic tissues indicates that the puckering of the aliphatic long chain of membrane lipids has changed. These changes affect the permeability and fluidity of the membranes, which shows an increase of the membrane crystallinity, as a result of the increase of lipophilic environment [6-10,19-22]. The observed changes in the lipophilicity of the membranes' environment has been found to be strongly associated with amyloid protein and fibril formation, as well as with cancer development [5-7]. Moreover, it was found that in non-melanoma skin cancer the lipophilic environment affects the low weight antioxidants [23,24] and inhibits the endogenous skin immune system.
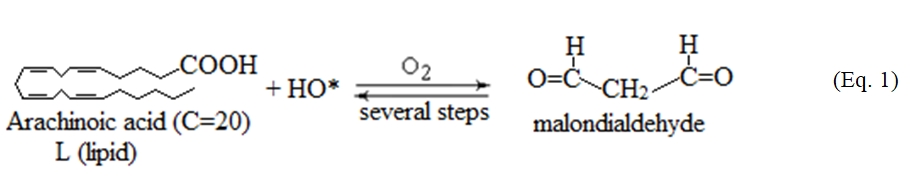
The spectral region 1800-700 cm-1 contains information about the secondary structure of proteins. The high intensity band at 1742 cm-1, which appeared at the spectra of diabetic mice, is assigned to stretching vibration of the aldehyde group (-CHO), as a result of lipid peroxidation [1,6,21]. In order to see if the free radical mechanism is implicated in the production of aldehydes we compared the FT-IR spectra of the diabetic mice with the corresponding spectra recorded from irradiated human cartilage, which is rich in hyaluronic acid and collagen [15]. It was found that the hydroxyl free radicals, which are produced during irradiation interact with the lipids (fatty acids) of membranes, that are sensitive targets, by abstraction of hydrogen atoms from the methylene groups (-CH2-) located between two double bonds. The resulting lipid radicals (L*) react with the molecular oxygen to form lipid peroxide (LOO*) and through chain reactions lead finally to malondialdehyde [15] according to the reaction (1):
The oxidation of lipids is observed in vivo in many diseases, such as atherosclerosis, diabetes mellitus, aging and cancer [1,6,7,15].
The next high intensity band at 1650 cm-1 is assigned to the bending vibration δNH of the amide I mode of the peptide bond (-NHCO-) of proteins [1,21,22]. The Amide I band is a combination band of the stretching vibration vC-N group and the in-plane bending vibration δN-H of the peptide bond and is very sensitive to changes in both the environment and the conformations of the protein chains depending on the form of collagen and on the state of the disease [1,6,17-22]. This band shifts to lower frequencies in the spectra of diabetic mice D20 and D30 suggesting the conformational changes of α-helix to random coil. These findings in combination with the band at 3484 cm-1 lead to the suggestion that hyaluronic acid and collagen, the most important components of skin, by losing their molecular structure lose also the possibility to interact with water molecules by hydrogen bonds and thus to hydrate the skin. The change of protein molecular structure enhances also the development of lipophilic environment.
The Amide II band is the next intense absorption band at about 1550 cm-1, which is assigned to β-turns of the proteins and in combination with the band at 1655 cm-1 characterizes the protein configuration of α-helix. Upon the diabetes development this band shifts to lower frequencies, indicating the changes of protein secondary structure.
At the spectral region 1250-800 cm-1 absorb the vibrational modes of the groups -C-O-C-, where an oxygen atom linking two carbon atoms of the sugar moiety of glycosaminoglycan together with the exocyclic C-O-C inter-molecule group. Significant changes were also observed upon diabetes development concerning the glycosylation and D-glucose formation (Figure 1). The band at the region 1100-900 cm-1 in the spectra of the normal tissues (N) arise from the stretching vibrations of vPO2- and vPO42- of phospholipids and DNA as it is indicated from the shape of the band.
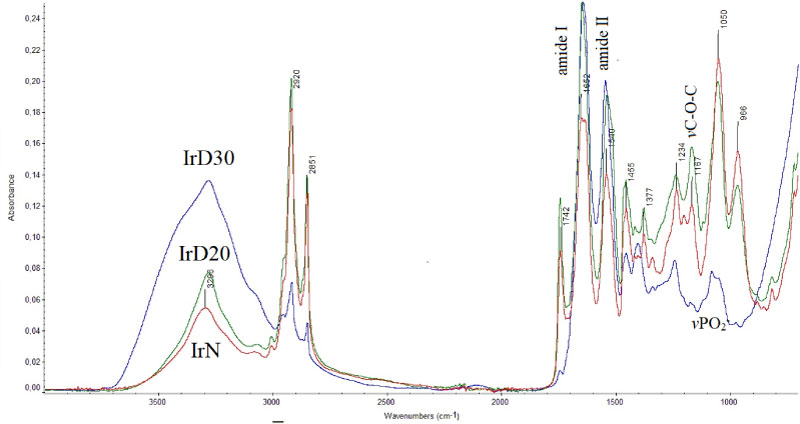
FT-IR spectra of irradiated control IrN, diabetic IrD20 and IrD30 tissues are shown in Figure 2. Comparison of the spectra shows significant variations in intensity, shifts and shape. As it is shown the broad band at the region 4000-3000 cm-1, where the absorption bands of stretching vibration of vOH groups of water molecules and from polysaccharides of hyaluronic acid (glycosaminoglycans) and vNH of proteins and DNA decrease considerably in the spectra of the irradiated control-non diabetic mice (IrN).
Very interesting is the observation that the intensity of the band at the spectra of IrD30 mice increases comparing in it with the spectra of IrN and IrD20. It seems that the skin of D30 mice is more hydrated and is close to the FT-IR spectra of normal skin (Figure 1 - N). On the contrary, the irradiated non diabetic mice (IrN) skin is almost dehydrated. The band at about 3296 cm-1, which is attributed to vNH vibration of proteins decreases in intensity from IrD30, IrD20 to IrN. From this result it is suggested that after irradiation the proteins change their amide A conformation. The intensity of the band at about 3060 cm-1 increases after irradiation for IrN and IrD20, while for the IrD30 becomes a shoulder, concerning that most of the proteins have the configuration of amide B. This finding means that the effect of the NH group of the peptide bond -NHCO- is stronger than C=O, unlike in amide A, where the effect of C=O in the peptide bond is stronger. The coexistence of both A and B protein conformations illustrates the prevalence of different hydrogen bonds that hold the protein strands together. As it is known, the hydrogen bond is important in stabilizing the protein helix and any change implies that the physiological environment has changed. We have found that these changes are very important and constitute a basic criterion in order to characterize the disease and its progression. This spectral region is not sensitive in Raman spectra.
The bands in the spectral region between 3000 cm-1 to 2870 cm-1 are assigned to the symmetric and antisymmetric stretching vibrations of methyl (vasCH3, vsCH3) and to methylene (vasCH2) groups of lipids, proteins and glycosides. A considerable increasing of intensity of these bands was observed after irradiation at the spectra of IrN and IrD20 showing that the environment of the membranes has now changed and that the surrounding medium became more lipophilic. On the contrary, in the case of IrD30 the spectral bands have the shape of normal skin as it is shown in Figure 1.
The bands in the spectral region between 3000 cm-1 to 2870 cm-1 are assigned to the symmetric and antisymmetric stretching vibrations of methyl (vasCH3, vsCH3) and to methylene (vasCH2) groups of lipids, proteins and glycosides. A considerable increasing of intensity of these bands was observed after irradiation at the spectra of IrN and IrD20 showing that the environment of the membranes has now changed and that the surrounding medium became more lipophilic. On the contrary, in the case of IrD30 the spectral bands have the shape of normal skin as it is shown in Figure 1.
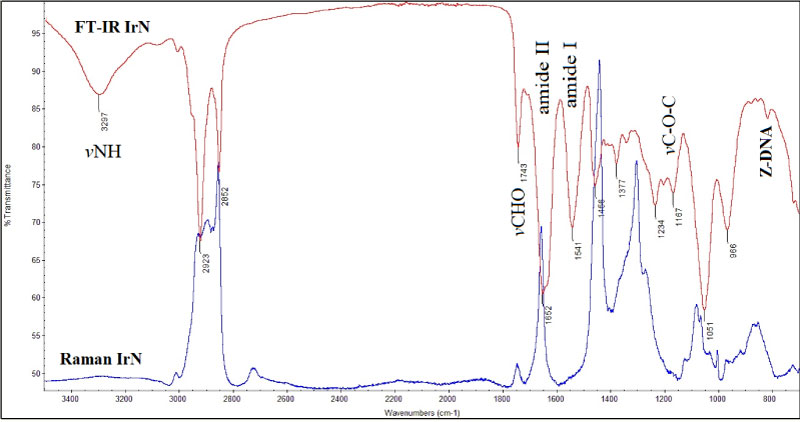
In Figure 3 are shown for comparison the FT-IR and Raman spectra of non-irradiated (N) and irradiated (IrN) control mice.
The spectra show that the two vibrational techniques are complimentary to each other. The Raman spectra is not sensitive to give information about the stretching vibrations of vOH and vNH of water molecules and proteins. Raman spectroscopy is more sensitive to the skeletal modes (C-C) of lipids. The band at about 812 cm-1 is atributed to sugar-phosphate groups of DNA arising from the conformational changes of B-DNA to cancerous Z-DNA conformation [28,29]. This band was also observed in human skin cancers [7].
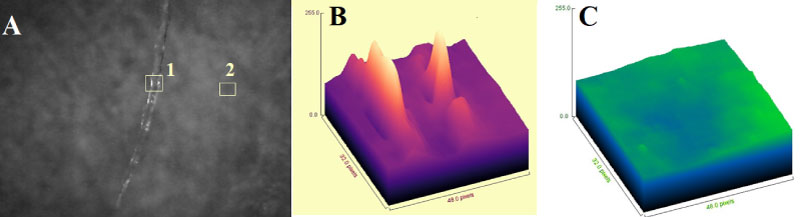
Figure 4 shows ImageJ analysis of the picture received from the Raman microscope (Figure 4A) of irradiated control mice (IrN), which developed SCC.
Figure 4A shows the surface architecture of the irradiated control mice skin. It is observed the damaged protein, which is shown as rich in white spots. ImageJ analysis at the point 1 shows high conductivity, resulting from Na+ and Ca+ cation deposition on the surface of the pigments. It seems that the UV radiation can imbalance intracellular Ca+activity of the IrN skin. From this picture it is also found the hydrogen bonds, which hold the polysaccharides of hyaluronic acid with collagen brake, suggesting that they are responsible for protein folding/unfolding, in agreement with spectroscopic data. ImageJ analysis at the point 2 shows a well suggesting the total absence of conductivity. This result indicates the formation of lipophilic environment, as well suggested from the increasing of the intensity bands of the stretching vibrations of methylene groups (Figure 1).
Conclusions
FT-IR and Raman spectroscopy can be used to characterize and differentiate the diabetic skin and its damages, which are induced upon long time exposure to UV irradiation. It was found that the long time exposure to UV irradiation causes skin damage and even cancer. The new and high intensity band at 1742 cm-1 is due to formation of aldehyde groups and is considered as a "Marker band" for oxidative stress. Another important finding was the observation that high dose of SZT (30 mg/kg) in mice inhibits cancer development upon UV radiation. The mechanism of the SZT action on prevention of skin cancer development and the ability to reduce the blood glucose after diabetic skin irradiation is not clear.
References
- Kotoulas C, Mamarelis I, Koutoulakis E, et al. (2017) The influence of diabetes on atherosclerosis and amyloid fibril formation of coronary arteries. A FT-IR spectroscopic study. Hell J Atheroscler 8: 15-29.
- Pitocco D, Tesauro M, Alessandro R, et al. (2013) Oxidative stress in diabetes: Implication for vascular and other complications. Int J Mol Sci 14: 21525-21550.
- Richardson E, JelkaZaletel J, Nolte E (2016) On behalf of Joint Action CHRODIS, Diabetes the policy puzzle: Towards Benchmarking in EU 25. Federation European Nurses in Diabetes.
- Ward DT, Yau SK, Mee AP, et al. (2001) Functional, molecular, and biochemical characterization of streptozotocin-induced diabetes. J Am Soc Nephrol 12: 779-790.
- Anastassopoulou J, Boukaki E, Conti C, et al. (2009) Microimaging FT-IR spectroscopy on pathological breast tissues. Vibrational Spectroscopy 51: 270-275.
- Anastassopoulou J, Kyriakidou M, Kyriazis S, et al. (2018) Oxidative stress in aging and disease development studied by FT-IR spectroscopy. Mech Ageing Dev 172: 107-114.
- Kyriakidou M, Anastassopoulou J, Tsakiris A, et al. (2017) FT-IR spectroscopy study in early diagnosis of skin cancer. In Vivo 31: 1131-1137.
- Eikje NS, Aizawa K, Ozaki Y (2005) Vibrational spectroscopy for molecular characterization and diagnosis of benign, premalignant and malignant skin tumors. Biotechnol Annu Rev 11: 191-225.
- Theophanides T (2015) Infrared Spectroscopy: Anharmonicity of Biomolecules, Crosslinking of Biopolymers, Food Quality and Medical Applications. IntechOpen.
- Theophanides T (2012) Infrared Spectroscopy: Life and Biomedical Science. IntechOpen.
- Larkin PJ (2017) Infrared and Raman spectroscopy: Principles and spectral Interpretation. Elsevier, Amsterdam, The Netherlands.
- Gardiner DJ, Graves PR, Bowley HJ (1989) Practical Raman Spectroscopy. Springer-Verlag.
- Barth A, Zscherp C (2002) What vibrations tell us about proteins. Q Rev Biophys 35: 369-430.
- Dimaki A, Kyriazi M, Leonis G, et al. (2019) Diabetic skin and UV light: Protection by antioxidants. Eur J Pharm Sci 127: 1-8.
- Mavrogenis A, Kyriakidou M, Kyriazis S, et al. (2016) Fourier transform infrared spectroscopic studies of radiation-induced molecular changes in bone and cartilage. Expert Rev Qual Life Cancer Care 1: 459-469.
- Majewski GP, Rodan K, Fields K, et al. (2019) Characterization of bound water in skin hydrators prepared with and without a 3D3P interpenetrating polymer network. Skin Res Technol 25: 150-157.
- Coblentz WW (1905) Investigation of infrared spectra. Canergie Institute Washington, Part I.
- Stair R, Coblentz WW (1933) Infrared absorption spectra of some plant pigments. Part of Bureau of Standards Journal of Research 11.
- Kyriakidou M, Mavrogenis AF, Kyriazis S, et al. (2016) An FT-IR spectral analysis of the effects of γ-radiation on normal and cancerous cartilage. Ιn Vivo 30: 599-604.
- Güler G, Gärtner RM, Ziegler C, et al. (2016) Lipid-protein interactions in the regulated betaine symporter BetP probed by infrared spectroscopy J Biol Chem 291: 4295-4307.
- Mammarelis I, Koutoulakis E, Kotoulas C, et al. (2016) Amyloid like formation and aortic valve calcification promoted by oxidative stress. Hellenic J Atherosclerosis 7: 84-96.
- Mamarelis I, Koutoulakis E, Kotoulas C, et al. (2017) The role of oxidative stress on amyloid-like protein formation and aortic valve calcification. Hellenic J Cardiology 58: 148-150.
- Grammenandi K, Kyriazi Μ, Katsarou-Katsari A, et al. (2016) Low molecular weight hydrophilic and lipophilic antioxidants in nonmelanoma skin carcinomas and adjacent normal like skin. Skin Pharmacology Physiology 29: 324-331.
- Hebert DN, Molinari M (2007) In and Out of the ER: Protein folding, quality control, degradation, and related human diseases. Physiol Rev 87: 1377-1408.
- Waer HF, Helmy SA, Mahmoud RM (2012) Protective effects and its relative mechanisms of low dose ionizing radiation on pancreatic cells of male diabetic rat's. The Egyptian J Hospital Medicine 49: 521-538.
- Nedergaard M, Egeberg J, Kromann H (1983) Irradiation protects against pancreatic islet degeneration and hyperglycaemia following streptozotocin treatment of mice. Diabetologia 24: 382-386.
- Karunanayake EH, Hearse DJ, Mellows G (1975) The metabolic fate and elimination of streptozotocin. Biochem Soc Trans 3: 410-414.
- Tajmir-Riahi HA, Theophanides Τ (1985) An FT-IR Study of DNA and RNA conformational transitions at low temperatures J Biomol Struct Dyn 3: 537-542.
- Theophanides Τ, Tajmir-Riahi HA (1985) Flexibility of DNA and RNA upon binding to different metal cations. An investigation of the B to A to Z conformational transition by Fourier transform infrared spectroscopy J Biomol Struct Dyn 2: 995-1004.
Corresponding Author
Michael Rallis, Department of Pharmacy, School of Health Science, Kapodistrian University of Athens, Athens, Greece, Tel: (+30)-7273699
Copyright
© 2019 Anastassopoulou J, et al. This is an open-access article distributed under the terms of the Creative Commons Attribution License, which permits unrestricted use, distribution, and reproduction in any medium, provided the original author and source are credited.