Carbon Storage and Emission Factor of Savanna Ecosystems in Soudano-Sahelian Zone of Cameroon
Abstract
Savana ecosystems can play an important role in climate change regulation. In this study, the carbon storage and emission factor of Savanna ecosystems in soudano-sahelian zone of Cameroon was assessed from measurement of the major pools including the aboveground biomass, belowground biomass, dead tree biomass, plant litter and soil organic carbon. The total carbon storage capacity of Savanna ecosystems ranged from 39.85 ± 14.65 tC/ha for degraded area to 152.18 ± 43.76 tC/ha for the swampy area. The carbon stock in aboveground biomass is higher in reforested areas (54.26 ± 6.54 tC/ha) and lower in degraded areas (10.04 ± 0.97 tC/ha). Carbon stocks in belowground biomass were lower in the degraded area (2.66 ± 1.02 tC/ha) and higher in reforested areas (11.82 ± 2.54 tC/ha). Carbon stock in litter are higher in swampy areas (0.81 ± 0.06 tC/ha) and lower in inselbergs (0.59 ± 0.05 tC/ha). The average carbon stocks in dead wood obtained in this study differed between habitats and tended to increase from degraded areas (1.35 ± 0.53 tC/ha) to plantation and reforested areas with respectively 2.75 ± 1.03 tC/ha each. Soil carbon was lower in degraded areas (25.10 ± 2.09 tC/ha) and higher in swampy areas (100.60 ± 9.65 tC/ha). The average total emission factor obtained in this study differed between habitats and tended to increase from degraded areas (103.09 ± 29.54 teqCO2/ha) to plantations (427.17 ± 45.06 teqCO2/ha). These results therefore confirm the contributing role of savannah ecosystems studied in the fight against the mitigation of climate change in Sudano-Sahelian zone of Cameroon.
Keyword
Cameroon, Climate change, Carbon, Deforestation, Emission of CO2eq, Savanna ecosystems
Introduction
The storage of carbon in plants and soils contributes both to climate change mitigation and adaptation of territories [1]. Soils and plants capture greenhouse gas (GHG) emissions in the atmosphere and store them in their biomass, thus constituting carbon sinks [1]. This process is called carbon sequestration [2] and is related to photosynthesis in plants and the decomposition of organic matter in the soils. This is an argument for both the preservation of natural, agricultural and forestry and the development of nature. The soils are carbon sinks, natural reservoirs that absorb carbon from the atmosphere and thus contribute to reducing the concentration of atmospheric CO2. Photosynthesis is the main driver of CO2 sequestration, which allows the extraction of terrestrial carbon storage and carbon sinks [1]. In addition, sustainable management of these areas is conducive to the development of renewable resources, contributing among other things to the need to adapt to climate change [1]. For these reasons, carbon sequestration is a major focus in project implementation to achieve the goal of carbon neutrality by 2050 [1]. The Agroforestry systems are favorable for carbon storage with a potential between 1.5 and 4 tC per hectare per year (5.5 to 14.8 tCO2/ha/year) according to the type of growth and density of trees [3]. They can be largely offset by substituting the ecosystem pruning's to fossil fuels for heating. For over half a century, sub-Saharan Africa faces an accelerated degradation of its plant biodiversity due to human activities and natural events [4]. Climate change and its many consequences on the lives of men are a major challenge for developing countries. Living populations in these countries depend heavily on natural plant resources and often have a relatively limited adaptive capacity [5]. Therefore, these countries are often among the most seriously affected by climate change. In Cameroon, as in many other sub-Saharan countries, the effects of climate change are ever more noticeable, especially in the northern part of Cameroon [6]. In the coming decades, experts predict that climate change will affect the livelihoods and plant biodiversity significantly [1]. Objective of the study is the evaluation of carbon storage and ecological inputs in different carbon pools of savannah ecosystems. Hence the interest of the present study is to present savanna ecosystems as measures to reduce greenhouse gas (GHG) emissions due to deforestation. This study was conducted in Northern Cameroon during the dry season of 2018. This study shows the positive impact of savannah ecosystems in climate change mitigation due to deforestation.
Materials and Methods
Study area
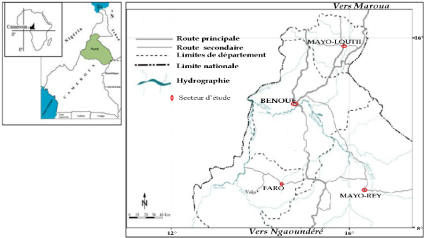
The study was conducted during the dry season of 2018 in four departments (Benoue, Faro, Mayo-Loutii and Mayo-Rey) of the North Region in Cameroon, located between latitude 9°18 'North and longitude 13° 23' East [7]. The landscape is characterized by a wide pediplain between the Mandara Mountains (1442 m) in the north and the tray of the Adamawa to the south. The climate is Sudano-Sahelian with two seasons: A dry season (November-May) and a rainy season (June-October), both with a duration of six months [8]. Mean monthly temperatures range from 26 ℃ in August to 40 ℃ in March. The soil is ferruginous, characterized by high acidity (pH 5.5 to 6), and a low cation exchange capacity [8,9]. The vegetation is predominately Sudanian shrub savannahs with areas of cleared degraded savannahs around the villages [10]. Agriculture is the main activity of the population in the North Region, mainly practiced as subsistence farming (corn, peanut and millet) [11] (Figure 1).
Data collection
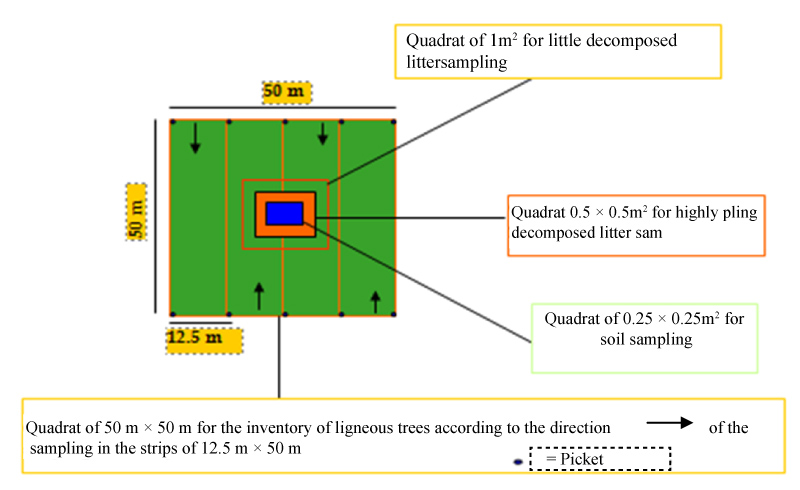
Data were collected in quadrats 50 × 50 square meters (north-south) 2500 m2 non-variable surface were installed in the savanna ecosystems in the end make a comparison. Geographic coordinates were taken using the GPS for every tree that is part of the sample to determine its location on the ground. Within 4 quadrats sub-set with the son and compass, all woody plants with a DBH ≥ 10 cm were consistently measured and counted using a tape to 1.30 m above ground for large trees and 50 cm of soil for shrubs and bushes. To assess the biomass, present in several components (overhead and underground), in addition to consider the soil organic matter. The living aboveground biomass: All trees having a diameter to height of upper chest or equal to 10 cm were measured in the main plot of 2500 m2. Biomass dead wood: Two perpendicular lines 50 m intersecting at the center of the plot are drawn and snuff variables considered were the case, the circumference, total height, and the status of the tree. Sampling dead wood was done in two categories:- For the dead timber, DBH was measured by making use of methods for living trees and the height was measured using the measuring tape. The diameters of trunks or branches fell to the ground and intercepting this line is measured using a caliper. Only diameters greater than 5 cm will then be considered in the analysis. The biomass of the litter is collected in a metal square frame of of 1 m × 1m and 0.5 × 0.5 m2. Floor biomass: Soil samples were taken at 0-30 cm deep in quadrats 0.25 m × 0.25 m is delimited in the quadrats plot of 2500 m2. The total carbon is obtained by the sum of the aboveground carbon, belowground carbon, litter, dead wood and soil (Figure 2).
Estimate Carbon in Biomass of Different Compartments of Savanna Ecosystems
Aboveground biomass
The allometric equation developed by Brown, et al. [12] for dry tropical climates was used to calculate the biomass of each individual and to deduce carbon in wood of the system studied.
AGB = expo (-1.996 + 2.32* ln (DBH)) with AGB
Aboveground biomass in kilogram (kg), DBH: Diameter Breast Height (cm). From this biomass, the amount of carbon (tC/ha) was obtained by multiplying this biomass by 0.475 conversion factor [10,13]; then it was converted to tons of carbon per ha.
Belowground biomass (BGB)
Belowground biomass was estimated according to the allometric equation developed by [14,15], BGB = Expo (-1.0587 + 0.8836* ln AGB).
Dead wood biomass
The calculation of the volume of dead timber was done using the formula by Mund [16] as follows: v = π*h*h*(DBH/2)2 where V: Volume of death timber (m3); DBH: Diameter Breast Height (m); h: height of death timber (m); f = form factor (0.627). The lying on the dead wood biomass was measured using the line intersect method presented by Harmon and Sexton [17]. Calculating the volume of the coated dead wood was done using the formula used by Waren and Olsen [18] as follows: V = π² (Σdi²)/8L with V: volume of wood density (m3/ha); Di: diameter of each wood debris sampled (m); L: Length of the quadrant (m) = 50 m in the case of our study. Translating the results obtained from the bulk volume was made by setting the value of wood density to 0.47 KgMS.m-3 [19]. The portion of the dry mass of carbon stock was made by the following equation: Carbon stock in dead wood = Quantity of dry matter (QDM) × 0.5 [20,21]. Litter Biomass: The litter plant samples were dried in an oven at 65 ℃ for 72 hours and then ground and the organic carbon was determined using dry ashing method. Equation (4): DM = (PSE/PHE)*100 where DM = percentage of dry matter (%); PSE = dry weight of the sample after three days in the oven at 65 ℃ (g); PHE = wet weight of the sample measured in the field (g). Equation (5): B = (PHT*DM)/100; where: B = biomass (g); PHT = total wet weight in measured in the field (g); DM = percentage of dry matter (%) [22,23].
Soil organic carbon
The soil organic carbon was determined by the method of Walkley and Black [24], which consists in oxidizing soil organic matter with potassium bicarbonate (K2Cr2O7) in a sulfuric acid medium (H2SO4) in a solution/K2Cr2O7 ratio of 0.25/10. The analysis was done by calorimetry. The organic content was determined by multiplying the organic carbon content with the Sprengel [25] factor, which is 1.724 for cultivated soils and 2 for non-crop land. Soil carbon (SCOS) (tC/ ha) = Da. (% COS). S. P [26] with Da: bulk density in tones /m3; %COS: organic carbon content of the soil; S: area in m2; p: depth m.
Total carbon
CT = AGB + BGB + CL + CBM + SCOS with AGB: Carbon in aboveground biomass; BGB: Carbon in belowground biomass; CL: Litter carbon; CBM: carbon dead wood; SCOS: Soil carbon.
Calculation of emission factors CO2 equivalent in biomass of different compartments of Savanna Ecosystems
The emission factors relate five (05) carbon pools: Aboveground biomass, belowground biomass, litter, dead wood and soil.
Aboveground biomass emission factor
FEAGB = AGB × FCFCMSBV × FCC with FEAGB
FEAGB: Aboveground biomass emission factor; AGB: Aboveground biomass; FCFCMSBV: Conversion factor of the carbon fraction of dry matter in the living biomass, 0.47; FCC: Carbon Conversion factor CO2 equivalent = 44/12 [2,3,27].
Belowground biomass emission factor
FEBGB = FEAGB × TBS with FEBGB: Belowground biomass emission factor; TBS: Belowground biomass ratio relative to aboveground biomass [2,3,27].
Litter emission factor
FEL = CL × FCC with FEL: litter emission factor;
CL: Carbon litter; FCC: Carbon Conversion factor CO2 equivalent = 44/12 [2,3,27].
Dead wood emission factors
FEBM = BBM × FC FCMSBM × FCC with FEBM: Dead wood emission factors; BBM: Dead wood biomass; FCFCMSBM: Conversion factor of the carbon fraction of solids in the dead wood, 0.49 [2,3,27].
Total Carbon emission factors
FES = CT × FCC with CT: Total Carbon; FCC: Carbon Conversion factor CO2 equivalent = 44/12 [2].
Data analysis
The data was encoded in EXCEL sheets and analyzed using the software Statgraphics plus 5.0. ANOVA and Kruskal-Wallis tests (with an level of significance of 1%) were performed by this software in order to test for correlations and significant differences.
Results and Discussion
Carbon stock in the different compartments of Savanna Ecosystems
The carbon stock in aboveground biomass is higher in reforestation (54.26 ± 6.54 tC/ha) and lower in degraded area (10.04 ± 0.97 tC/ha). Statistical analysis showed a significant difference between habitats (df = 6; F = 85.84; p-Value ˂ 0.001). The carbon stocks in belowground biomass of the study area varied between 2.66 ± 1.02 and 11.82 ± 2.54 tC/ha, with an average of 6.83 ± 3.20 tC/ha. On average, belowground biomass was lower in degraded areas (2.66 ± 1.02 tC/ha) and higher in reforested areas (11.82 ± 2.54 tC/ha). Statistical analysis a significant difference between habitats (Kruskal-Wallis test, df = 6; F = 84.74; p-Value ˂ 0.001). The carbon stock in litter obtained in this research ranged from 0.59 ± 0.05 tC/ha to 0.81 ± 0.06 tC/ha, with an overall average of 0.72 ± 0.09 tC/ha. The carbon stock in litter was higher in swampy area (0.81 ± 0.06 tC/ha) and lower on inselberg (0.59 ± 0.05 tC/ha), yet statistical analysis showed no significant difference between habitats (Kruskal-Wallis test, df = 6; F = 0.44; p-Value < 0.001). The average carbon stocks in dead wood obtained in this study differed between habitats and tended to increase in degraded areas (1.35 ± 0.53 tC/ha) for planting and reforestation respectively 2.75 ± 1.03 tC/ha each, but statistical analysis did not reveal any significant differences between habitats (Kruskal-Wallis test, df = 6; F = 0.73; p-Value < 0.001). The soil carbon (0-30 cm) varied between habitats. The average soil carbon (0-30 cm) obtained in all habitats was 65.18 ± 27.53 tC/ha. On average, soil carbon was lower in the degraded areas (25.10 ± 2.09 tC/ha) and higher in swampy areas (100.60 ± 9.65 tC/ha). Statistical analysis by the Kruskal-Wallis test at the 1% evidenced a significant variation between habitats (df = 6; F = 80.59; p-Value ˂ 0.001). Total carbon stock has an average of 104.3 ± 43.55 tC/ha in all studied habitats. The average total carbon stocks obtained in this study differ between habitats and tend to increase the degraded area (39.85 ± 14.65 tC/ha) to the plantation (152.18 ± 43.76 tC/ha). Statistical analysis by the Kruskal-Wallis test at the 1 % evidenced a significant variation between habitats (df = 6; F = 86.05; p-Value ˂ 0.001), (Table 1).
Emission factors in the different compartments of Savanna Ecosystems
The aboveground biomass emission factors obtained in this research ranges from 17.31 ± 1.97 to 93.59 ± 10.4 teqCO2/ha, representing an overall average of 51.02 ± 15.44 teqCO2/ha. The aboveground biomass emissions factors are higher in reforestation (93.59 ± 10.4 teqCO2/ha) and lower in degraded areas (17.31 ± 1.97 teqCO2/ha). Statistical analysis by the Kruskal-Wallis test at the 1% evidenced a significant variation between habitats (df = 6; F = 95.68; p-Value ˂ 0.001). The belowground biomass emission factors of the study area varies 2.59 ± 1.02 to 14.13 ± 1.05 teqCO2/ha, with an average of 7.40 ± 3.20 teqCO2/ha; have an average lower in the degraded area (2.59 ± 1.02 teqCO2/ha) and higher plantation (14.13 ± 1.05 teqCO2/ha). Statistical analysis by the Kruskal-Wallis test at the 1% evidenced a significant variation between habitats (df = 6; F = 88.85; p-Value ˂ 0.001). The litter emission factors obtained in this research ranges from 2.16 ± 0.65 to 2.97 ± 1.76 teqCO2/ha, represents an overall average of 2.64 ± 1.08 teqCO2/ha. The litter emission factors are higher in swampy area (2.97 ± 1.76 teqCO2/ha) and lower in Inselberg (2.16 ± 0.65 teqCO2/ha). Statistical analysis by the Kruskal-Wallis test at the 1% threshold is no evidence no significant variation between habitats (df = 6; F = 0.23; p-Value < 0.001). The averages dead wood emission factors obtained in this study differ between habitats and tend to increase the degraded area (2.42 ± 2.05 teqCO2/ha) for plantation and reforestation respectively 4.94 ± 2.03 teqCO2/ha each. Statistical analysis by the Kruskal-Wallis at the 1% threshold is no evidence no significant variation between habitats (df = 6; F = 0.13; p-Value < 0.001). The average of the soil emission factors obtained in all habitats is 200.86 ± 27.53 teqCO2/ha. They have an average lower in degraded area (92.11 ± 32.9 teqCO2/ha) and higher in swampy area (341.67 ± 38.65 teqCO2/ha). Statistical analysis by the Kruskal-Wallis test at the 1% evidenced a significant variation between habitats (df = 6; F = 84.40; p-Value ˂ 0.001). The total Carbon emission factor has an average of 371.87 ± 47.46 teqCO2/ha in all studied habitats. Average total carbon emission factor obtained in this study differ between habitats and tend to increase the degraded area (103.09 ± 29.54 teqCO2/ha) to the plantation (427.17 ± 45.06 teqCO2/ha). Statistical analysis by the Kruskal-Wallis test at the 1% evidenced a significant variation between habitats (df = 6; F = 86.05; p-Value ˂ 0.001) (Table 2).
Relationship between carbon storage and emission factors of Savanna Ecosystems
The minimum and maximum values SCAGB, SCBGB, SCL, SCBM, SCOS (0-30 cm) and total Carbon are respectively 10.04-54.26 tC/ha; 2.66-11.82 tC/ha; 0.59-0.81 tC/ha; 1.35-2.75 tC/ha, 25.10-100.60 tC/ha and 39.85-152.18 tC/ha with coefficients of variation of respectively 52.19%; 46.85%; 12.50%; 29.44%; 42.23% and 41.75%. From all the calculated variables, the coefficient of variation SCL (12.50%) is the lowest compared to the other four variables. A very strong and highly significant correlation was observed between SCAGB with FEAGB (R² = 0.98; p ≥ 0.001); FEL (R² = 0.94; p ≥ 0.001); FEBM (R² = 0.96; p ≥ 0.001); FETC (R² = 0.94; p ≥ 0.001). As against a weaker and not significant correlation was observed between the SCAGB and FEBGB (R² = 0.49; p > 0.05) but a fairly strong and significant correlation was observed between the SCAGB and FES (R² = 0.59; p < 0.05). Correlations between SCBS with FEAGB (R² = 0.81; p ≥ 0.001); FEBGB (R² = 0.98; p ≥ 0.001); FETC (R² = 0.96; p ≥ 0.001) are very strong and highly significant. By cons between SCBGB with FEL (R² = 0.56; p < 0.05); FEBM (R² = 0.51; p < 0.05); FES (R² = 0.68; p < 0.05), a fairly strong and significant correlation was observed.
Correlations between SCL with FEAGB (R² = 0.88; p ≥ 0,001); FEBGB (R² = 0.80; p ≥ 0.001); FEL (R² = 0.98; p ≥ 0.001); FES (R² = 0.90; p ≥ 0.001) and FETC (R² = 0.89; p ≥ 0.001) are very strong and highly significant but between SCL with FEBM a less strong correlation and no significant differences were observed (R² = 0.48; p > 0.05). A very strong and significant correlation was observed between the SCMB with FEBM (R² = 0.99; p ≥ 0.001) and FETC (R² = 0.94; p ≥ 0.001) but weaker and not significant with FEL (R² = 0.24; p > 0.05) yet strong enough and with significant FEAGB (R² = 0.51; p < 0.05); FEBGB (R² = 0.59; p < 0.05); FES (R² = 0.59; p < 0.05). The results in Table 3 show that there is a significant and positive correlation between SCOS (0-30 cm) and FEL (R² = 0.56; p < 0.05); and a very strong and positive correlation between SCOS (0-30 cm); FEAGB (R² = 0.88; p≥0.001); FEBGB (R² = 0.87; p ≥ 0.001); FEBM (R² = 0.81; p ≥ 0.001); FES (R² = 0.88; p ≥ 0.001) and FETC (R² = 0.96; p ≥ 0.001). In the end very strong correlations, very positive and highly significant were observed between the total Carbon with FEAGB (R² = 0.88; p ≥ 0.001); FEBGB (R² = 0.90; p ≥ 0.001); FEL (R² = 0.89; p ≥ 0.001); FEBM (R² = 0.98; p ≥ 0.001); FES (R² = 0.90; p ≥ 0.001) and FETC (R² = 0.98; p ≥ 0.001, (Table 3).
The carbon stock in aboveground biomass is higher in reforestation (54.26 ± 6.54 tC/ha) and lower in degraded areas (10.04 ± 0.97 tC/ha). Several factors could explain the spatial variability of carbon stocks recorded in the different habitats studied. Clark and Clark [28] and Gourlet-Fleury and colleagues [29], emphasize the influence of the type of soil in the spatial variability of biomass stocks, and thus their carbon in the tropics. In fact, the type of soil controls the specific composition [30] and explains its difference between ecosystems by natural selection related to species adaptation [31]. Bocko and colleagues [32] also point out that structural variables explain more of the spatial variation of biomass in African rainforests. In fact, air carbon stock tends to increase with the increase of certain structural parameters such as basal area [29,33]. It is then noted that the most significant differences between the different biotopes carbon stocks may reside in the importance of their basal surfaces [31] and their means DBH. Carbon stocks in belowground biomass of the study area vary 2.66 ± 1.02 to 11.82 ± 2.54 tC/ha, with an average of 6.83 ± 3.20 tC/ha; have an average lower in the degraded area (2.66 ± 1.02 tC/ha) and higher in reforestation (11.82 ± 2.54 tC/ha). The main change factors agroforestry soil carbon stocks are climate, the dominant species, in connection with the type of humus, and qualitative characteristics (pedogenetic type) and quantitative soil (clay content and soil depth). The carbon stock in litter is higher in swampy area (0.81 ± 1.76 tC/ha) and lower in inselberg (0.59 ± 0.65 tC/ha). This variation could be explained by two main reasons: Because litters were plantations comes in addition to crops, timber left standing, the swampy area adjacent to the latter and the resulting wasteland unprotected above its established. Moreover, although the lighting rate is higher in the woody savanna and degraded area, the humidity is lower in inselberg; which significantly affects the rate of decomposition of organic matter that will be most important in swampy areas studied in the inselberg. The average carbon stocks in dead wood obtained in this study differ between habitats and tend to increase the degraded area (1.35 ± 1.53 tC/ha) for planting and reforestation respectively 2.75 ± 2.03 tC/ha each. Hence, the presence of a larger number of fallen trees. The reason plantations and reforestation store more carbon in this component is certainly due to the fact that farmers have very little involvement in this type of system, unlike the degraded area where fallen trees are mostly harvested for purposes of firewood and charcoal production. The soil carbon (0-30 cm) varies from one habitat to another.
The average carbon soil (0-30 cm) obtained in all the habitats is 65.18 ± 27.53 tC/ha. It has an average lower in the degraded area (25.10 ± 2.09 tC/ha) and higher in swampy area (100.60 ± 9.65 tC/ha). This gap could be explained mainly in part by the different biochemical textures and compositions of the soil and also the fact that in degraded areas, anthropogenic factors (bushfires, logging, growing up slash and burn) and biophysical factors (erosion, stripping surface layers, mechanical action and clearing the oxidation of organic matter) that destroy and reduce organic refunds from the middle towards the ground. Indeed, the carbon storage dynamics in agroforestry soil depends on changes in land use (deforestation, afforestation, etc.), climate and silvicultural practices mineralization increasing the activity of micro-organisms in the soil (plowing, drainage, fertilization). Total carbon stock has an average of 104.3 ± 43.55 tC/ha in all studied habitats. The average total carbon stocks obtained in this study differ between habitats and tend to increase the degraded area (39.85 ± 14.65 tC/ha) to the swampy area (152.18 ± 43.76 tC/ha). This is due to different geographical areas studied, the dbh, basal area and density of trees selected and studied ecosystems. Aboveground biomass Emission factors obtained in this search range from 17.31 ± 1.97 and 93.59 ± 10.4 teqCO2/ha, representing an average of 51.02 ± 15.44 teqCO2/ha. Aboveground biomass emission Factors are higher in reforestation (93.59 ± 10.4 teqCO2/ha) and lower in degraded areas (17.31 ± 1.97 teqCO2/ha). The reforestation is the major sink of CO2; this explains the absence of anthropogenic emissions of greenhouse gas effects. Aboveground biomass emission factors low in degraded areas, this is due to the presence of anthropogenic (bush fires, logging, slash and burn cultivation setting). These results are lower than the results cited by [27,34] for the dense tropical forest (248.16 teqCO2/ha) and the tropical moist deciduous forest (151.31 teqCO2/ha) in the Mé Region. The belowground biomass emission factors in this study area range from 2.59 ± 1.02 to 14.13 ± 1.05 teqCO2/ha, with an average of 7.40 ± 3.20 teqCO2/ha; have an average lower in the degraded area (2.59 ± 1.02 teqCO2/ha) and higher plantations (14.13 ± 1.05 teqCO2/ha). The high value in plantations, perhaps due to the fact that these plantations are undisturbed ecosystems, with important litter inputs, significant microbial activity and decomposition leading to the accumulation of more humus in the soil. These results are lower than the results cited by FAO and SEP-REDD +. [27,34] for the dense tropical forest (91.82 teqCO2/ha) and the tropical moist deciduous forest (30.26 teqCO2/ha) in Mé region. The litter Emission factors are higher in swampy area (2.97 ± 1.76 teqCO2/ha) and lower in Inselberg (2.16 ± 0.65 teqCO2/ha). These results are lower than the results cited by GIEC, 2006 in Ouattara, 2017 for the mature evergreen forest (7.7 teqCO2/ha) and the tropical moist deciduous forest (7.7 teqCO2/ha) in the Soul Region. The average dead wood emission factors obtained in this study differ between habitats and tend to increase the degraded area (2.42 ± 2.65 teqCO2/ha) for plantations and reforestation with respectively 4.94 ± 2.03 teqCO2/ha each. These results are lower than the results cited by FAO and SEP-REDD +,2017 in Ouattara, 2017 for the dense tropical forest (61.81 teqCO2/ha) and the tropical moist deciduous forest (74.92 teqCO2/ha) of the Mé Region. The average of Soil emission factors obtained in all habitats is 200.86 ± 27.53 teqCO2/ha. They have an average lower in the degraded region (92.11 ± 32.9 teqCO2/ha) and higher in swampy area (341.67 ± 38.65 teqCO2/ha). This can be explained by the fact the largest density trees results in greater accumulation of litter in the floor of the swampy area, which favors the accumulation of carbon in the soil resulting in a high CO2 sink. The total emission factor has an average of 371.87 ± 47.46 teqCO2/ha in all studied habitats. The average total emission factor obtained in this study differ between habitats and tend to increase the degraded area (103.09 ± 29.54 teqCO2/ha) to the swampy area (427.17 ± 45.06 teqCO2/ha). These results are lower than the value found by Zapfack, et al. 2013 in the Primary forest (17,463.01 teqCO2/ha); Secondary forest (1182.829 teqCO2/ha); Wetland (540.84 teqCO2/ha); Planting (3394.64 teqCO2/ha); Young fallow (5084.62 teqCO2/ha); Old fallow (4244.67 teqCO2/ha) of Cameroon. But still higher than the results found by Noiha, et al. 2017a in the plantations of cashew (146.88 teqCO2/ha) and savannah (48.28 teqCO2/ha) in Northern Region Cameroon. From these savanna ecosystems studied value can offset the CO2 emissions resulting from human activities.
Conclusion
The savanna ecosystems contain remarkable carbon stocks. View their importance on social, ecological, environmental riparian populations; such ecosystems are considered for CO2 emission reductions factors therefore contribute to the mitigation of climate change mitigations. Which should be as through the different land use activities, land tenure security, agriculture "zero deforestation", reforestation, sustainable forest management, REDD + and CDM projects need to focus on the valuation of these savanna ecosystems North Cameroon to motivate local communities to develop conservation strategies for protecting these ecosystems to benefit from carbon credits and also while improving their conditions of life. These results show that these different ecosystems studied are large carbon reservoirs and can justify the use of judicious combination agricultural and woody crops to enhance the total carbon stock and therefore the amount of CO2 in degraded ecosystems such as degraded areas.
Acknowledgments
Authors thank all the reviewer whose contributions have been very significant for the improvement of this study.
Conflict of Interest
The authors declare that there is no conflict of interests regarding the publication of this manuscript.
References
- IPCC (2002) Changements climatiques et biodiversité. Document technique, 89.
- athryn Bickel, Gary Richards (2006) Représentation cohérente des terres. Lignes directrices 2006 du Groupe d'experts intergouvernemental sur l'évolution du climat (GIEC) pour les inventaires nationaux de gaz à effet de serre. Volume 4 : Agriculture, foresterie et autres affectations des terres. Geneva, Switzerland, 47.
- EP-REDD+ (2017) Niveau d'Emission de Référence pour les Forêts de la Côte d'Ivoire. Présentation à la convention cadre des Nations Unies pour le Changement Climatique, 40.
- djidda (2001) Structure et dynamiques des espèces ligneuses dans les zones Sud Est du Parc National de Waza. Mémoire du Diplôme d'Ingénieur des Eaux et Forêts. Université de Dschang, 62.
- PCC (2007) Groupe de travail I du GIEC. Quatrième Rapport d'évaluation, Bilan 2007 des changements climatiques les bases scientifiques physiques, Résumé à intention des décideurs, 25.
- afo G (2008) Les aires protegées de l'Extreme-Nord Cameroun entre politique de conservation et pratiques locales, Thèses de doctorat en géographie - Amenagement-Environnement, Université d'Orléans, France, 325.
- bdoulay M (2012) Migrations dynamiques agricoles et problèmes fonciers en Afrique subsaharienne Le périmètre irrigué de Lagdo (Nord-Cameroun). Cybergeo European Journal of Geography 10.
- guemhe Fils SC, Etouna J, Hakdaoui M (2014) Apport de l'OT et du SIG à la cartographie des zones à risque d'érosion hydrique dans le bassin versant productif de Sanguéré, Nord Cameroun, Afrique Centrale. International Journal of Innovation and Applied Studies 9: 449-479.
- Offossou D'Andous K (2011) Remise en culture des jachères enrichies à acacia sénégal au nord-cameroun : productions forestière et agricole, et perceptions paysannes. Mémoire de Stage. AgroParisTech, Centre de Montpellier 121.
- Noiha Noumi V, Zapfack L, Awé Djongmo V, et al. (2017a) Floristic structure and sequestration potential of cashew agroecosystems in Africa: A case study from Cameroon. Journal of Sustainable Forestry 36: 277-288.
- Awe Djongmo V, Noiha Noumi V, Zapfack L, et al. (2019) Carbon sequestration potential and economic value in agroforestry parkland to tectona grandis L. f. (Verbenaceae) in Central Africa: A case study to Department of Poli (Northern Region in Cameroon). Advances in Research 18: 1-16.
- Brown S, Gilespie AJR, Lugo AE (1997) Biomass estimation methods for tropical forest with application to forest inventory data. For Sci 35: 881-902.
- Zapfack L, Noiha Noumi V, Dziedjou Kwouossu PJ, et al. (2013) Deforestation and carbon stocks in the surroundings of lobéké national park (cameroon) in the congo basin. Environment and Natural Resources Research 3: 78-86.
- Cairns MA, Brown S, Helmer EH, et al. (1997) Root biomass allocation in the world's upland forests. Oecologia 111: 1-11.
- Cairns MA, Olmsted I, Granados J, et al. (2003) Composition and aboveground tree biomass of a dry semi-evergreen forest on Mexico's Yucatan Peninsula. Forest ecology and Management 186: 125-132.
- Mund M (2004) Carbon Pools of European beech forests (Fagus sylvatica) under different silvicultural management. Der Georg-August-University Göttingen, 268.
- Harmon ME, Sexton J (1996) Guidelines for Measurements of Woody Detritus in Forest Ecosystems (US LTER Publication No. 20) US LTER Network Office, University of Washington, Seattle, WA, USA, 73.
- Warren W, Olsen P (1964) A line intersects technique for assessing logging waste. Forest Science 10: 267-276.
- Ifo AS, Koubouana F, Jourdain C, et al. (2015) Stock and flow of carbon in plant woody debris in two different types of natural forests in bateke plateau, central africa. Open Journal of Forestry 5: 38-47.
- Woldendorp G, Keenan R J, Barry S, et al. (2004) Analysis of sampling methods for coarse woody debris. Forest Ecology and Management 198: 133-148.
- Awe DV, Valery NN, Louis Z, et al. (2019) Vegetation Structure, Root Biomass Distribution and Soil Carbon Stock of Savannah Agrosystems in Sudano-Sahelian Zone of Cameroon. J Bot Res 2: 60-70.
- Valentini G (2007) Evaluation de la séquestration du carbone dans des plantations Agro-forestières et des jachères issues d'une agriculture migratoire dans les territoires autochtones de Talamanca au Costa Rica. Mémoire de MSc. en Biologie Végétale, Université de Laval Québec, Canada, 128.
- Saidou A, Dossa AFE, Gnanglè PC, et al. (2012) Evaluation du stock de carbone dans les systèmes agroforestiers à karité (Vitellaria paradoxa C.F. Gaertn.) et à néré (Parkia biglobosa Jacq. G. Don) en zone Soudanienne du Bénin. Bulletin de la Recherche Agronomique du Bénin India, 9.
- Walkley A, Black I Armstrong (1934) An experimentation of the degtjareff method for determinig soil organic matter rand a proposed modification of chromic acid titration method. Soil Sci 37: 29-38.
- Awe AD, Valery NN, Louis Z, et al. (2019) Vegetation Structure, Root Biomass Distribution and Soil Carbon Stock of Savannah Agrosystems in Sudano-Sahelian Zone of Cameroon. J Bot Res 2: 71-80.
- Mugheni ES (2016) Etude de la dynamique de carbone organique du sol et biomasse aérienne des forêts monodominantes à Gilbertiodendron dewevrei dans la réserve forestière de Yoko territoire d'Ubundu (Province de la Tshopo, RD Congo). Mémoire pour l'obtention du diplôme de Grade d'Ingénieur, Université de Kisangani, 59.
- Ouattara TA (2107) Niveau d'émission de référence pour les forêts de la Région de la Mé. Etc Terra-Rongead Représentation en Côte d'Ivoire 25, BP 691 Abidjan, 25 Riviera Golf-Cocody, Abidjan 28.
- Clark DB, Clark DA (2000) Landscape-scale variation in forest structure and biomass in a tropical rain forest. Forest Ecology and Management 137: 185-198.
- Gourlet-Fleury S, Rossi V, Rejou-Mechain M, et al. (2011) Environmental filtering of dense wooded species controls above-ground biomass stored in African moist forests. Journal of Ecology 99: 981-990.
- Laurance WF, Fearnside PM, Laurance SG, et al. (1999) Relationship between soils and Amazon forest biomass: a landscape-scale study. Forest Ecology and Management 118: 127-138.
- Jaffré T, Veillon JM (1990) Etude floristique et structurale de deux forêts denses humides sur roches ultrabasiques en Nouvelle Calédonie. Rapports scientifiques et techniques, sciences de la vie botanique n°3, 45.
- Bocko Yannick E, Ifo Suspense A, Loumeto Jean J (2017) Quantification des stocks de carbone de trois pools clés de carbone en Afrique Centrale : Cas de la forêt marécageuse de la likouala (Nord Congo). European Scientific Journal 13: 1857-7881.
- Rahaingoson F, Rakotoarimanana V, Edmond R (2013) Analyse structurale et floristique de la végétation selon les différents types de gestion sur le Plateau Calcaire Mahafaly. Rôle et place des transferts de gestion des ressources naturelles renouvelables dans les politiques forestières actuelles à Madagascar 8.
- FAO et SEP-REDD+ (2017) Données forestières de base pour la REDD+ en Côte d'Ivoire. Inventaire de la biomasse forestière pour estimation des facteurs d'émission. Abidjan 49.
Corresponding Author
AWE DJONGMO Victor, Department of Biological Sciences, Faculty of Science, University of Ngaoundere, P.O.BOX: 454, Ngaoundere, Cameroon.
Copyright
© 2019 Victor AD, et al. This is an open-access article distributed under the terms of the Creative Commons Attribution License, which permits unrestricted use, distribution, and reproduction in any medium, provided the original author and source are credited.