Vegetation Structure, Root Biomass Distribution and Soil Carbon Stock of Savannah Agrosystems in Sudano-Sahelian Zone of Cameroon
Abstract
The present work aims to provide key knowledge on vegetation structure, root biomass distribution and soil carbon stock of savanna agrosystems in Sudano-Sahelian zone of Cameroon. The transect method is used to carry out the investigations in order to characterize the vegetation. The excavation method was used to soil and roots sampling. The experimental device used is the split plot. These results showed that the highest densities were recorded in Anogeissus leiocarpus stands (408 ± 11.12 stems/ha). Higher values of basal area (11.56 ± 0.57 m2/ha), biovolume (116.78 ± 16.57 m3/ha) and eco-volume (157.82 ± 22.12 m3/ha) were recorded in Khaya senegalensis stands. The highest total large roots biomass (65.81 ± 5.37 tC/ha) and fine roots biomass (11.42 ± 0.67 tC/ha) were recorded in Khaya senegalensis stands. The highest total medium root biomass is recorded in Burkea Africana stands (23.21 ± 1.15 TC/ha). The soil carbon stock is higher in Khaya senegalensis stands (132.16 ± 16.34 tC/ha). These results show that savannah agrosystems in Sudano-Sahelian zone of Cameroon can be considered as carbon sinks.
Keywords
Cameroon, Carbon, Climate change
Introduction
Root biomass is therefore of paramount importance to the contribution of plants to organic carbon in soils and to the real benefits of climate change mitigation methods [1]. The amount of root biomass, but also its carbon concentration, should be considered when trying to measure the carbon reserve of a plant [2]. Carbon variation in the various root sizes must be taken into account in calculating the average carbon concentration of the entire root system [3]. The two main functional roles of the roots are the acquisition of nutrients and water [4]. A number of secondary roles are also important, such as reserve formation, growth regulator production and propagation [5]. The woody roots with bark have rather an anchoring role as well as means of transportation and reserve of nutrients. Fine roots, on the other hand, provide nutrients and water [6]. Climate change, land degradation and loss of biodiversity, soils have become one of the most vulnerable resources in the world. Soils are a major reservoir of carbon [7]. They contain more carbon than the atmosphere and the terrestrial vegetation combined [7]. However, soil organic carbon is dynamic and anthropogenic actions on the soil can make it a sink or a net source of greenhouse gases (GHGs) [7]. Soil organic carbon is the main component of soil organic matter [7]. As an indicator of soil health, soil organic carbon is important for its contributions to food production, climate change mitigation and adaptation, and the achievement of sustainable development goals [8]. High levels of organic matter provide nutrients to plants and improve water availability. Both improve soil fertility and lead to improved food production [7]. Soils being dynamic systems, they generate a multitude of functions supporting several ecosystem services. Ecosystem services can be defined as beneficial flows derived from natural assets and fulfilling human needs [9]. Soil borne ones depends on soil processes and their physico-chemical and biological properties as well as the interaction between mineral and soil compartments [10]. Relatively few studies have linked soil properties to ecosystem services in Africa [9-11]. Soils are the basis for the provision of most of these services [9,11]. In particular, soil processes allow maintenance of the dynamic equilibrium supporting the provision of several ecosystem services [12]. They provide a reservoir of biodiversity that promotes soil resilience to disturbance. Soil development provides soil cover, a physical environment for agriculture. The soil also regulates nutrient recycling, which maintains its fertility through the exchange of mineral elements between its abiotic and abiotic components. Finally, soils house part of the water cycle and thus provide a reserve of drinking water. Soils also provide regulatory services [9,11]. Finally, soils provide cultural and aesthetic services such as the maintenance of geological, ecological and archaeological records [10,11]. Several studies have highlighted the important role of soils in several ecosystem services such as carbon sequestration and support for food security [3]. However, as with any natural resource, the formation and degradation of soil capital evolves over time [11], thus maintaining sustainability as one of the current global issues.
Materials and Methods
Study area
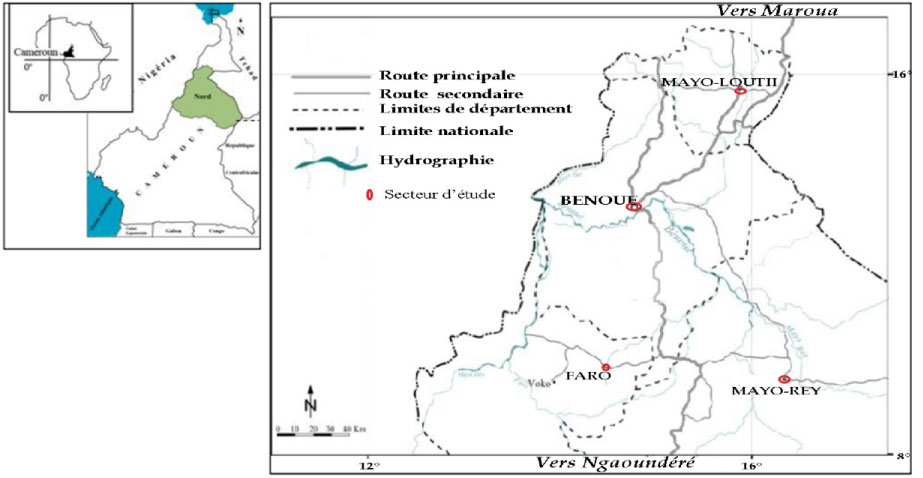
The study was conducted in Northern Region Cameroon. This region is located between latitude 9° 18' North and longitude 13° 23' East [13] (Figure 1). The terrain is a wide pediplain Between the Mandara Mountains (1442 m) in the North and the plateau of the Adamawa to the south. The climate is Sudano sahelian type with two seasons: A dry season of duration of six months (November-May) and a rainy season of duration of six months (June-October) [14]. The mean monthly temperature evolving from 26 ℃ in August to 40 ℃ in March. The soil is ferruginous type characterized by an acidity (pH = 5.5 to 6), and a low cation exchange capacity [14,15]. The vegetation is a savannah shrub Sudanian zone having an aspect of clear savannah and degraded around the villages [16]. Agriculture is the main activity of the populations in Northern region. The population practice subsistence farming (corn; peanut and mil) [17] (Figure 1).
Data collection
Vegetation structure sampling: Data were collected in transects methods 100 m in length to 50 m in width. These transects were arranged in a north-south direction to cover most or the entire stand studied. The sampling tapes were established using the wires and the compass. At the ends of each strip, the milestones were marked equidistant 20 m from the base. At each distance of 20 m, all the trees have been inventoried. Geographic coordinates were collected using GPS for each tree in the sample to determine its geographical location on the ground. All the trees were systematically counted and measured. Dendrometric data were based on dbh (Diameter of Breast height) and (H) height. The study aimed to compare the vegetation structure in four different stands: (1) Khaya senegalensis stands, (2) Burkea africana stands, (3) Anogeissus leiocarpus stands and (4) Piliostigma reticulatum stands in Sudano-sahelian zone of Cameroon. The analysis of vegetation structure in four different stands focused on: The density (D): D = n/S; D: density (stems/ha), n: number of trees present on the surface considered and S: surface area (ha). The basal area of a tree corresponds to the area occupied by the tree trunk at the level of the dbh. It is given by the formula: Basal area (m2/ha) = (dbh)2 × 0.25 × 9 [18]. Biovolume is defined as the volume of wood provided by vegetation in a given area. It allows to timer the wood potential of the plant formation. It is given by the formula of Dawkins [18]: V = 0.53 ∑ gi × Hi × ni with gi: basal area (m2/ha). Hi: height (m); ni: number of individuals; V: biovolume (m3/ha). According to Roger and Rabarison [19], biovolume is high when it is higher than 250 m3/ha, average when it is between 50 and 250 m3/ha, and low when it is less than 50 m3/ha. We have defined the approach below to estimate the ecovolume (Ev): Ev = S * ΣHi where Hi is the height of each tree i on an area (S) [19].
Soil and root sampling: Soil samples are collected in August-September 2017. In each 500 m² survey, soil samples were taken from the 0.25 m × 0.25 m quadrats. These samples are taken at 0-10 cm, 10-20 cm, and 20-30 cm depth on the elementary plots. Each level of soil depth taken using a machine and a trowel is immediately put in a closed bag in a cooler, in the shade to avoid evaporation. A total of 3 samples were collected per sample unit, which corresponds to a total of 9 samples per stand and 36 samples for all 4 stands studied were dug into the soil to a depth of 30 cm. Whole biomass of large roots (> 5 mm), biomass of medium roots (1 < d < 5 mm) and biomass of fine roots (d< 1 mm) were manually extracted from the soil in the trenches by the successive flotation method, always according to the five levels of sampling depths. All these samples were conditioned/dried in the open air at the pedology laboratory of the Faculty of Management of Natural Renewable Resources of the International University of Central Africa. They were then milled and screened for later use in determining the organic carbon content of the soil. Another sampling of soil samples was done using a 502 cm3 soil cylinder (8 cm diameter and 10 cm height) to determine bulk density. These samples were weighed using a precision scale and then placed in an oven at a temperature of 105 ℃. They were then removed from the oven and placed in the desiccator for two hours for cooling before being weighed again. The dry weight obtained made it possible to determine the dry biomass and to deduce the organic carbon content of the soil then the soil organic carbon stock. These analyzes consisted in the determination of the organic carbon was determined by the method of Walkley J. & W. Black. [20], which is an oxidation with potassium bicarbonate (K2Cr2O7) in sulfuric acid (H2SO4). The assay was done by calorimetry. The organic matter content was obtained by multiplying the organic carbon content by the Springer factor which is 1.724. Determination of bulk density was made by the paraffin method on undisturbed earth clods air dried. This method consists in attaching the material with a wire, then weighing it (P1), then introducing it into a container containing paraffin. After drying and cooling of this material, the material (P2) is weighed again, and then the weight difference is made which is the weight of the added paraffin (P3). Then, the method of Archimedes' thrust is used to separate the different constituents by finding the volume of the sample (V). The weight of the sample alone (P1) divided by the volume of the sample (V) which gives the value of the apparent density (Da). Da = P/V. The soil carbon stock is obtained by the following formula: SCOS (tC/ha) = Da. (% COS) .S. P [21,22] with: Da: apparent density in tones/m3;% COS: soil organic carbon content; S: area in m2; p: depth in m. The study aimed to compare the distribution of root biomass (fine, medium and large roots) and soil carbon stocks in four different stands: (1) Khaya senegalensis stands, (2) Burkea Africana stands, (3) Anogeissus leiocarpus stands and (4) Piliostigma reticulatum stands in Sudano-sahelian zone of Cameroon.
Data analysis
The data were encoded in the EXCEL software and then analyzed using the STATGRAPHICS plus 5.0 software. The significance and correlation tests were examined with an analysis of variance (ANOVA) and the Duncan test at 5%.
Results and Discussion
Vegetation structure in four different stands study
Density: The minimum and maximum values of mean density within (Khaya senegalensis, Burkea africana, Anogeissus leiocarpus, Piliostigma reticulatum) stands are 110-306 stems/ha, 204-590 stems/ha, 305-511 stems/ha, 282-306 stems/ha respective coefficients of variation with 4.12%, 2.73%, 2.72%, 3.07% (Table 1). The coefficient of variation of density within Anogeissus leiocarpus stands (2.72%) is the lowest compared to the others. The analysis of variance shows a significant difference (F = 15.65, P = 0.031 < 0.05) between the densities inside the stands. It is highest in Anogeissus leiocarpus stands (408 ± 11.12 stems/ha), then decreases progressively in Burkea Africana stands (397 ± 10.85 stems/ha) to the Piliostigma reticulatum stands (294 ± 9.03 stems /ha) and Khaya senegalensis stands (208 ± 8.57 stems/ha) (Table 1).
Basal area: The analysis of variance showed a significant difference (F = 8.87, P = 0.043 < 0.05) between the average basal areas within the stands. It is highest in Khaya senegalensis stands with (11.56 ± 0.57 m²/ha) and then gradually decreases in Burkea Africana stands (8.97 ± 0.35 m²/ha) towards Anogeissus leiocarpus stands with (5.08 ± 0.22 m²/ha) and Piliostigma reticulatum stands with (2.94 ± 0.13 m²/ha) (Table 2). The minimum and maximum values of basal area within (Khaya senegalensis, Burkea africana, Anogeissus leiocarpus, Piliostigma reticulatum) stands respectively are 2.84-20.28 m²/ha, 2.80-15.14 m²/ha, 3.05-7.11 m²/ha, 2.82-3.06 m²/ha coefficients of variation with 4.94%, 3.90%, 4.33%, 4.42% (Table 2). The coefficient of variation of basal area within Burkea africana stands (3.90%) is the lowest compared to the others (Table 2).
Biovolume: The minimum and maximum values of biovolume inside (Khaya senegalensis, Burkea africana, Anogeissus leiocarpus, Piliostigma reticulatum) stands respectively are 30.84-202.72 m3/ha, 20.80-111.14 m3/ha, 30.05-58.11 m3/ha, 20.82-45.06 m3/ha respectively coefficients of variation with 14.18%, 15.23%, 13.20%, 9.19% (Table 3). The coefficient of variation of the average biovolume within Burkea Africana stands (9.19%) is the lowest compared to the others (Table 3). ANOVA showed a significant difference (F = 58.87, P = 0.0000 < 0.05) between biovolume within the stands. It is highest in Khaya senegalensis stands (116.78 ± 16.57 m3/ha) and then decreases progressively in Burkea Africana stands (65.97 ± 10.05 m3/ha) to Anogeissus leiocarpus stands (44.08 ± 5.82 m3/ha) and Piliostigma reticulatum stands with (32.94 ± 3.03 m3/ha) (Table 3).
Ecovolume: The minimum and maximum values of the ecovolume inside (Khaya senegalensis, Burkea africana, Anogeissus leiocarpus, Piliostigma reticulatum) stands are respectively 90.84-224.8 m3/ha, 22.80-77.52 m3/ha, 13.05-56.69 m3/ha, 8.82-30.54 m3/ha with coefficients of variation of 14.01%, 24.40%, 20.76%, 10.77% (Table 4). The coefficient of variation of the mean ecovolume within Piliostigma reticulatum stands with (10.77%) is the lowest compared to the others (Table 4). Analysis of variance showed a significant difference (F = 55.87; P = 0.0000 < 0.05) between ecovolume within the stands. It is highest in Khaya senegalensis stands (157.82 ± 22.12 m3/ha) and then decreases progressively in Burkea Africana stands (50.16 ± 12.24 m3/ha) to Anogeissus leiocarpus stands (34.87 ± 7.24 m3/ha) and Piliostigma reticulatum stands with (19.68 ± 2.12 m3/ha) (Table 4).
Roots biomass
Large roots Biomass: The analysis of variance showed a significant difference (F = 24.88; P = 0.0000 < 0.05) for the total large roots biomass for depth (0-30 cm) between the four stands studied. At depth (0-10 cm), the highest large root biomass (37.78 ± 2.87 tC/ha) was observed in Khaya senegalensis stands. Analysis of variance showed a significant difference (F = 7.54; P = 0.004 < 0.05) for the total large roots biomass for depth (0-10 cm) between the four stands studied. The largest large root biomass for depth (10-20 cm) was observed in Anogeissus leiocarpus stands (24.18 ± 0.89 tC/ha). Analysis of variance showed a significant difference (F = 8.44, P = 0.003 < 0.05) for the total large roots biomass for depth (10-20 cm) between the four stands studied. At depth (20-30 cm), the highest large roots biomass (9.58 ± 0.52 tC/ha) was observed in Khaya senegalensis stands. The analysis of variance showed a significant difference (F = 20.50; P = 0.0000 < 0.05) for the total large roots biomass for the depth (20-30 cm) between the four stands studied (Table 5).
Medium root biomass: The analysis of variance showed a significant difference (F = 58.88, P = 0.0000 < 0.05) for the Medium root biomass for depth (0-30 cm) between the four stands studied. The highest Medium root biomass for depth (0-10 cm) was observed in Burkea africana stands (8.54 ± 0.41 tC/ha). The analysis of variance showed a significant difference (F = 56.50; P = 0.0000 < 0.05) for the total Medium root biomass for depth (0-10 cm) between the four stands studied. At depth (10-20 cm), the highest medium root biomass (7.80 ± 0.39 tC/ha) was found in Burkea africana stands. Variance analysis showed a significant difference (F = 52.95, P = 0.0000 < 0.05) for total root mean biomass for depth (10-20 cm) between the four stands studied. At depth (20-30 cm), the highest medium root biomass (6.87 ± 0.35 tC/ha) was found in Burkea Africana stands. The analysis of variance showed a significant difference (F = 54.54; P = 0.047 < 0.05) for the total medium root biomass for depth (20-30 cm) between the four stands studied (Table 6).
Fine roots biomass: The analysis of variance shows a significant difference (F = 18.88, P = 0.0000 < 0.05) for the total biomass of fine roots for depth 0-30 cm between the four stands studied. At depth (0-10 cm), the highest fine root biomass (5.78 ± 0.57 tC/ha) was observed in Khaya senegalensis stands. Analysis of variance showed a significant difference (F = 6.50, P = 0.038 < 0.05) for total fine root biomass for depth (0-10 cm) between the four stands studied. At depth (10-20 cm), the highest fine root biomass (3.05 ± 0.08 tC/ha) was observed in Anogeissus leiocarpus stands. The analysis of variance did not show a significant difference (F = 2.95, P = 0.054 > 0.05) for total fine root biomass for depth (10-20 cm) between the four stands studied. At depth (20-30 cm), the highest fine root biomass (2.80 ± 0.05 tC/ha) was observed in Khaya senegalensis stands. Analysis of variance showed a significant difference (F = 4.54, P = 0.047 < 0.05) for total fine root biomass for depth (20-30 cm) between the four stands studied (Table 7).
Soil carbon stock: The analysis of variance showed a significant difference (F = 78.88; P = 0.0000 < 0.05) for soil carbon stock (0-30 cm) between the four stands studied. At depth (20-30 cm), the highest soil carbon stock (33.54 ± 5.54 tC/ha) was observed in Khaya senegalensis stands. Analysis of variance showed a significant difference (F = 42.95; P = 0.000 < 0.05) for soil carbon stock for depth (20-30 cm) between the four stands studied. At depth (10-20 cm), the highest soil carbon stock (42.84 ± 4.93 tC/ha) was observed in Khaya senegalensis stands. Analysis of variance showed a significant difference (F = 42.95; P = 0.000 < 0.05) for Soil Carbon Stock for depth (10-20 cm) between the four stands studied. At depth (0-10 cm), the highest soil carbon inventory (55.78 ± 5.87 tC/ha) was observed in Khaya senegalensis stands. Analysis of variance showed a significant difference (F = 34.86; P = 0.000 < 0.05) for Soil Carbon Stock for depth (0-10 cm) between the four stands studied (Table 8).
Ratio between soil carbon stock and carbon stock in large, medium and fine roots: The ratio of soil carbon stocks to carbon in large roots ranges from 49.79 to 75.95%. It is higher in the stands at Piliostigma reticulatum. This indicates that the large roots of Piliostigma reticulatum absorb more than 75.95% of its soil carbon compared to the large roots of Anogeissus leiocarpus, Burkea Africana and Khaya senegalensis which absorb 71.85% respectively; 52.78% and 49.79% of the carbon in their soil (Table 9).The ratio of soil carbon stocks to carbon in average roots ranges from 13.40 to 22.88 percent. It is higher in Burkea africana stands. This indicates that the average roots to Burkea Africana absorb more than 22.88% of its soil carbon compared to the average roots to Anogeissus leiocarpus, Piliostigma reticulatum and Khaya senegalensis which absorb 14.56% respectively; 14.30% and 13.40% of the carbon from their soil (Table 9).The ratio of soil carbon stocks in fine roots ranges from 7.20 to 13.95%. It is higher in Piliostigma reticulatum stands. This indicates that the fine roots to Piliostigma reticulatum absorb more than 13.95% of its soil carbon compared to the fine roots to Anogeissus leiocarpus, Khaya senegalensis and Burkea africana stands which absorb 10.20% respectively; 8.64% and 7.20% of the carbon in their soil (Table 9).
Discussion
Vegetation structure
Anogeissus leiocarpus stands are the densest (408 ± 11.12 stems/ha). This result would translate into appreciable regeneration within the stands. In fact, the importance of regeneration in the stands studied is that it favors the protection of the land by preventing rainwater from having a beating effect thanks to the foliage and the root systems [23]. This result is superior to those Ali, et al. [24] in sacred forests in Southeastern Benin with a value of 103 to 267 individuals per ha. But remains below those Noiha, et al. [25] in cocoa trees (1477 individuals/ha), young cocoa trees (< 10-years-old) (1251 individuals/ha) and old cacao trees (1274 individuals/ha); Noiha, et al. [26] in Gmelina arborea stands (site1 (253 ± 10.23 individuals/ha), sites 2 (182 ± 4.57 individuals/ha) and site 3 (98 ± 2.01 individuals/ha)) ; Noiha, et al. [27] in Eucalyptus stands with young ages, middle ages and old ages with respectively 2054 ± 68.46; 985 ± 30.78; 3370 ± 60.17 individuals/ha; Noiha, et al. [16] in cashew stands of 0-10 years, 10-20 years and + 20 years respectively with 88.29 ± 57.51; 53.354 ± 48.4; 38.64 ± 47.42 individuals/ha. The difference in density of the stands studied with the other authors could be related to the ecological characteristics of the study environments, including soil types, topography, climate, and cover.
The higher value of basal area observed in Khaya senegalensis stands (11.56 ± 0.57 m²/ha). The highest basal area in Khaya senegalensis stands indicated the large tree specimens. Among the species of its undergrowth, some have a high shade rate. This may explain the high proportion of species that can provide shade in any season [28] These results are not close to those Savadogo, et al. [29]; Noiha, et al. [16] ; Noiha, et al. [27] and Noiha, et al. [26].
The highest biovolume were recorded in Khaya senegalensis stands (116.78 ± 16.57 m3/ha). This great value of the biovolume could be explained by the absence of human activities in this stand. And also by the protection and conservation of trees by farmers. The low values of biovolumes (> 50 m3/ha) in the other stands would be justified by their low wood potential. These results are lower than the 12047 m3/ha values found by Janssens, et al. [30] in the cashew plantations of the Ouémé basin in Germany; values 401; 372; 309; 290 and 205 m3/ha found by Dupuy, et al. [31] in plantations at Tectona grandis in Ivory Coast. On the other hand, the lowest values of the biovolume are observed in the pastures, this is the result of a strong human and animal pressure whose effect is remarkable both on the physical environment and on the floristic procession. Khaya senegalensis is the species best represented in terms of biovolume. This is explained by the fact that this species is not subject to any anthropogenic pressure which could lead to the almost complete destruction of airborne organisms and the attenuation of differences in sizes between individuals. The highest vegetation ecovolume was recorded in Khaya senegalensis stands (157.82 ± 22.12 m3/ha). These results are lower than the 63333 m3/ha value found by Janssens, et al. [30] in the cashew plantations of the Ouémé basin in Germany. According to Mulindabigwi & Janssens, et al. [32]. These large values of the eco-volume would justify keeping them away from several degradation activities, hence their high value.
Root biomass
The highest large roots biomass was observed in Khaya senegalensis stands. This is explained by these great rooting abilities and the type of soil. The first depth 0-10 cm of the soil contains more than 90% of the roots. These depths correspond to those from which these soils contain a negligible amount of fat. This leads us to conclude that large root biomasses have many advantages in nutrient and carbon accumulation as shown in previous studies [33,34]. Large roots, greater than 5 mm in diameter to Khaya senegalensis stands, have very high spatial variability compared to other stands. The finest roots (d < 1 mm) make up 24 to 35% of the total root mass in the 10-20 cm layer. In the most superficial layer (0-10 cm), they are even more abundant and represent 38 to 58% of the total. These results diverge from those of Dahlman & Kucera [35], which base their estimates on the differences in root weights at the beginning and end of the peak root growth period. These results are far inferior to those obtained by Guo, et al. [36]. These results are particularly observed in conditions of high seasonal water stress [37-41]. Total fine root biomass (0-30 cm) ranged from 2.80 ± 0.05 to 11.42 ± 0.67 tC/ha in Khaya senegalensis stands, 1.54 ± 0.01 to 7, 31 ± 0.1 tC/ha in Burkea Africana stands, from 1.50 ± 0.03 to 8.64 ± 0.23 tC/ha in Anogeissus leiocarpus stands and 2.70 ± 0.04 at 8.44 ± 0.11 tC/ha in Piliostigma reticulatum stands. These results obtained in this work; do not corroborate the work of many in the literature [42,43]. The fine roots biomass in stands studied is greater in depths 0-20 cm. On the other hand, in depths greater than 20 cm, biomass values of fine roots are noted. These low values may be explained in part by the installation of native soil cores in shallow horizons, at a maximum depth of 20 cm below the soil surface, where few roots have developed.
Soil carbon stock
Soil carbon stocks obtained through the present research varying between 60.46 ± 5.23 and 132.16 ± 16.34 tC/ha do not corroborate those Ananthi Selvaraj, et al. [44]; Mouwembe, et al. [22] ; Noiha, et al. [16]; Noiha, et al. [27]; Noiha, et al. [26]; Awé, et al. [45]; Kooke, et al. [46]. These values vary according to the type of soil and the climatic conditions. On the other hand, our results are superior to those estimated by IPCC [47] which is 31 tC/ha for the tropical dry zones and those obtained by Palm, et al. [48] in an agroforestry system based on cocoa at 42 tC/ha. Also these results are not contained in the range 12.2-22.3 ton C/ha obtained by Manlay, et al. [49] in Senegal and intervals of 4.3-21.3 ton C/ha obtained by Tschakert [50] in Senegal. The low values of soil carbon stock in Piliostigma reticulatum stands can be explained by the average quality of the physical properties of the soil in our study environment. The main factors of variation of soil carbon stocks in savannahs agroforestry are the climate, the dominant species, in relation to the type of humus, and the qualitative and quantitative characteristics of soils (clay content and soil depth) [51-53]. Soil carbon stock in Khaya senegalensis stands (132.16 ± 16.34 tC/ha) is higher to Burkea Africana, Anogeissus leiocarpus and Piliostigma reticulatum stands respectively with 101.42 ± 10 tC/ha; 84.67 ± 3.12 tC/ha and 60.46 ± 5.23 tC/ha. This gap could be explained mainly by the different textures and biochemical compositions of soils, anthropogenic factors (bush fires, logging, and slash and burn cultivation) and biophysical factors (erosion, stripping of surface layers). Mechanical clearing and oxidation of organic matter) which destroy and reduce the organic restitution of the medium to the soil. Indeed, the carbon storage dynamics in soils of savannah stands depend on changes in land use (deforestation, afforestation, etc.), climate and some silvicultural practices increasing the mineralizing activity of soil microorganisms (plowing, drainage, fertilization). According to Albrecht and Kandji [54], the carbon storage capacity an agro ecosystems varies between 12 and 228 tC/ha with an average value of 95 tC/ha. The values obtained during this search are within this range. The variation in carbon stock in the different plantations would therefore be due to the variation in planting density. The amount of carbon sequestered by agro ecosystem depends on the species set up, their density, the structure and function of the latter. Montagnini and Nair [55] state that the amount of sequestered carbon is a function of tree species, geographical regions (climate, soil), planting densities and system management. The results obtained are, on the other hand, greater than the interval of 60 and 90 tC/ha for an agro forest proposed by Palm, et al. [48]. On the other hand, this value is much higher than that found by Volkoff, et al. [56] who found that the carbon stock in tropical ferruginous soils in Benin was 32 tC/ha with a coefficient of variation of 40% for a depth of 0-50 cm [57]. The consequence of this situation is the rapid mineralization of organic matter in the Sudano-Sahelian zone and a decrease in the stock of organic matter in the soil. The relatively low levels of soil carbon stock can be explained by the average quality of the physical properties of the soil in our study environment. It is a ferruginous ground concretion (41.32% of concretion on average).
These soils are subject to intensive cultivation practices with a very short fallow period observation. It should be noted that agricultural practices in the fire-use area for plots cleaning can also contribute to the destruction of organic matter through intensification of mineralization. It is necessary that the services in charge of rural development sensitize the neighboring populations for a better management of these agroecosystems in the perspective of the reduction of greenhouse gases. The results show the important role of roots as a source of organic matter in the soils of the different stands studied. They lead to take the greatest account of the biological activity of the very superficial horizons, in the study of the operation and the development of these ecosystems. The average soil carbon stock in Khaya senegalensis stands with 132.16 ± 16.34 tC/ha, which is lower than the stocks advanced by Eglin [58] (153 tC/ha) but is very close to the value 136 tC/ha obtained by Lecointe, et al. [59] and at 130 tC/ha obtained by Mohamed Boulmane, et al. [60]. On the other hand, the values of its authors remain higher than our values obtained in Burkea Africana (101.42 ± 10 tC/ha); Anogeissus leiocarpus (84.67 ± 3.12 tC/ha) and Piliostigma reticulatum (60.46 ± 5.23 tC/ha). Studies by several authors [61,62] in Brazil, Jordan, India and Kenya show that organic carbon stocks vary considerably depending on the nature of the soil. Soil carbon stocks of the four stands are larger in depths 0-10 cm. This result would be explained by the relative stability of organic carbon at depth. Indeed, the decisive factor for the stability of carbon stocks in the deep layers of the soil (depth 20 cm) is the deficiency in the energy supplier substrate: The absence of plant litter, roots and dead leaves, rich in energy, prevents microorganisms from developing and breaking down carbon [63]. This result therefore suggests that as long as the decomposition of deep organic carbon is not reactivated by deep soil work [64]. It is clear that changes in the allocation to Pilisotigma thonningii stands in other modes of use (or deforestation) reduce stocks of soil organic carbon. According to Arrouays, et al. [64], deforestation typically results in near total loss of biomass and soil carbon loss of 40 to 50 percent within a few decades. The balance will then depend on the new land use. However, it is difficult to predict a very long-term equilibrium rate, nor to take into account aspects related to the renewal of organic matter [17].
Conclusion
This study gives us a better understanding of carbon stock in the root system and the soil of the studied stands. Soil is a non renewable resource whose quality must therefore be preserved, whether for its environmental or ecological functions. The results show that the total large and fine roots biomass is higher in Khaya senegalensis stands. On the other hand, those of medium roots are higher in Burkea africana stands. And so the soil carbon stock is more important in Khaya senegalensis stands. The dynamics of biomass accumulation in forest stands is central to the carbon balance. Carbon sequestration rates in biomass and soil reservoirs determine the ability of savanna agrosystems to remove carbon from the atmosphere. To obtain a precise organic carbon balance from the amount of root biomass and soil measured. The results confirm that the carbon concentration of roots and soil is indeed significant. Root biomass is therefore of paramount importance for the contribution of plants to organic carbon in soils and the real benefits of climate change mitigation methods. The amount of root biomass, but also its concentration of carbon, should be considered when trying to measure the carbon reserve of a savannah stand.
Acknowledgments
Authors thank all the referred whose contributions have been very significant for the improvement of this study.
Conflict of Interest
The author declares that there is no conflict of interests regarding the publication of this manuscript.
References
- Orjan (2001) The Interaction of Tree Roots and Sewers. City Trees, The Journal of the Society of Municipal Arborists.
- Pregitzer KS, Zak DR, Curtis PS, et al. (1995) Atmospheric CO2, soil nitrogen and turnover of fine roots. New Phytologist 129: 579-585.
- Lal R (2004) Soil carbon sequestration impacts on global climate change and food security. Science 304: 1623-1627.
- Pregitzer KS, Kubiske ME, Yu CK, et al. (1997) Relationship among root branch order carbon and nitrogen in four temperate species. Oecologia 111: 302-308.
- Fitter AH (1994) Architecture and biomass allocation as components of the plastic response of root systems to soil heterogeneity dans. In: MM Caldwell, RW Pearcy, Exploitation of environmental heterogeneity by plants: Ecophysiological processes above and belowground. Academic Press, UK, 305-323.
- Pregitzer KS (2002) Fine roots of trees - a new perspective. New Phytologist 154: 267-270.
- IPCC (2002) Les changements climatiques et la biodiversité. Document technique V du GIEC 89.
- Arrouays D, W Deslais, J Daroussin, et al. (1999) Stocks de carbone dans les sols de France: Quelles estimations? CRAAF 85: 278-292.
- Adhikari K, AE Hartemink (2016) Linking soils to ecosystem services-a global review. Geoderma 262: 101-111.
- Jónsson, Jón Örvar G, Davíðsdóttir, et al. (2016) Classification and valuation of soil ecosystem services. Agricultural Systems Elsevier 145: 24-38.
- Dominati E, M Patterson, M Mackay (2010) A framework for classifying and quantifying the natural capital and ecosystem services of soils. Ecological Economics 69: 1858-1868.
- Saint-Laurent S, R Ouimet, S Tremblay, et al. (2000) évolution des stocks de carbone organique dans le sol après la coupe d'une sapinière à bouleau jaune de l'est du Quebec. Can J Soil Sci 12: 507-514.
- Abdoulay M (2012) Migrations dynamiques agricoles et problèmes fonciers en Afrique subsaharienne Le périmètre irrigué de Lagdo (Nord-Cameroun). Cybergeo European Journal of Geography.
- Nguemhe Fils SC, Etouna J, Hakdaoui M (2014) Apport de l'OT et du SIG à la cartographie des zones à risque d'érosion hydrique dans le bassin versant productif de Sanguéré, Nord Cameroun, Afrique Centrale. International Journal of Innovation and Applied Studies 9: 449-479.
- Offossou D'Andous K (2011) Remise en culture des jachères enrichies à Acacia Sénégal au Nord-Cameroun Productions forestière et agricole, et perceptions paysannes. AgroParisTech Centre de Montpellier 121.
- Noiha Noumi V, Zapfack L, Awé Djongmo V, et al. (2017) Floristic structure and sequestration potential of cashew agroecosystems in Africa: A case study from cameroon. Journal of Sustainable Forestry 36: 277-288.
- Awe DV, Valery NN, Louis Z, et al. (2019) Carbon stocks in dead wood biomass of savannah ecosystems in Northern Region Cameroon. J Bot Res 2: 60-70.
- Dawkins HC (1958) The management of natural tropical high-forest, with special reference to Uganda. Commonwealth forestry, Institute University of Oxford, England, 155.
- Roger E, Rabarison H (2000) Contexte biologique de la conservation des forêts à Madagascar. Etude sur la politique de conservation des ressources forestières à Madagascar, 53.
- Walkley J, W Black (1934) An experimentation of the Degtjareff method for determinig soil organic matter rand a proposed modification of chromic acid titration method. Soil Sci 37: 29-38.
- Samantha J, Langley Turnbaugh, Donald R Keirstead (2005) Soil properties and land use history a case study in new hampshire. Northeastern Naturalist 12: 391-402.
- Mouwembe MAB, Ifo SA, Binsangou Malonga S, et al. (2017) Variabilité spatiale des stocks de carbone organique du sol des savanes dans les réserves de lésio-louna et de léfini plateaux tékés république du Congo. Afrique Science 13: 297-307.
- Malagnoux M, EH Sene et N, Atzmon (2007) Les forêts les arbres et l'eau dans les terres arides un équilibre précaire. Unasylva 58: 24-29.
- Ali MFKR, Odjoubere J, Tente HAB, et al. (2014) Caractérisation floristique et analyse des formes de pression sur les forêts sacrées ou communautaires de la basse vallée de l'ouémé au sud-Est du Bénin. Afrique Science 10: 243-257.
- Noiha Noumi V, Zapfack L, Mbade LF (2015) Biodiversity management and plant dynamic in a cocoa agroforêts (Cameroon). International Journal of Plant and Soil Science 6: 101-108.
- Noiha Noumi V, Zapfack L, Ngueguim JR, et al. (2018) Floristic diversity and structure of cocoa agro-ecosystems in southeastern Cameroon. Journal of Agriculture and Ecology Research International 14: 1-9.
- Noiha Noumi V, Zapfack L, Pelbara P, et al. (2018) Afforestation/reforestation based on Gmelina arborea (verbenaceae) in tropical Africa floristic and structural analysis carbon storage and economic value (Cameroon). Sustainability in Environment 3: 161-176.
- Leblanc M, Malaisse F (1978) Lubumbashi, un écosystème urbain tropical. Centre International de Sémiologie, Université Nationale du Zaïre, Lubumbashi, République du Zaïre.
- Savadogo O M, Ouattara K, windscreen S, et al. (2016) Structure specific composition and woody vegetation diversity in two contrasted zone in the Sahel of Burkina Faso. Electronic Journal of Environmental Science 16.
- Jansen ML, Daran-Lapujade P, de Winde JH, et al. (2004) Prolonged maltose-limited cultivation of saccharomyces cerevisiae selects for cells with improved maltose affinity and hypersensitivity. Appl Environ Microbiol 70: 1956-1963.
- Dupuy B, Loumeto JJ, Amsallem I, et al. (1999) Gestion des écosystèmes forestiers denses d'Afrique tropicale humide. 2. Congo. CIRAD-Foret, Montpellier, France, 145.
- Mulindabigwi V, Janssens MJJ (2004) Extension des superficies agricoles dans la haute vallée de l'Ouémé (HVO): Possibiltés, consequences et alternatives.
- Fortier J, D Gagnon, B Truax, et al. (2010) Biomass and volume yield after 6 years in multiclonal hybrid poplar riparian buffer strips. Biomass and Bioenergy 34: 1028-1040.
- Fortier J, D Gagnon, B. Truax, et al. (2010) Nutrient accumulation and carbon sequestration in 6 year-old hybrid poplars in multiclonal agricultural riparian buffer strips. Agriculture, Ecosystems & Environment 137: 276-287.
- Dahlman RC, Kucera CL (1965) Root productivity and turnover in native prairie. Ecology Society of America 46: 84-89.
- Guo DL, RJ Mitchell, JJ Hendricks (2004) Fine root branch orders respond differentially to carbon source-sink manipulations in a longleaf pine forest. Oecologia 140: 450-457.
- Comas LH, Anderson LJ, Dunst RM, et al. (2005) Canopy and environmental control of root dynamics in a long-term study of Concord grape. New Phytol 167: 829-840.
- Da Silva EV, Bouille JP, Gonçalves JLM, et al. (2011) Functional specialization of Eucalyptus fine roots: Contrasting potential uptake rates for nitrogen, potassium and calcium tracers at varying soil depths. Funct Ecol 25: 996-1006.
- Laclau JP, Ranger J, Gonçalves JLM, et al. (2010) Biogeochemical cycles of nutrients in tropical Eucalyptus plantations. Main features shown by intensive monitoring in Congo and Brazil. For Ecol Manag 259: 1771-1785.
- Christina M, Laclau JP, Gonçalves JLM, et al. (2011) Almost symmetrical vertical growth rates above and below ground in one of the world's most productive forests. Ecosphere 2: 1-10.
- Laclau JP, Nouvellon Y, Reine C, et al. (2013) Mixing eucalyptus grandis and acacia mangium trees leads to transgressive fine root over-yielding and vertical segregation between species. Oecologia 172: 903-913.
- Rich SM, Watt M (2013) Soil conditions and cereal root system architecture: Review and considerations linking Darwin and Weaver. J Exp Bot 64: 1193-1208.
- Marschner H (2012) Marschner's mineral nutrition of higher plants. (3rd edn), Academic Press, London.
- Ananthi Selvaraj, Sivasankari Jayachandran, Dhivya Priya Thirunavukkarasu, et al. (2016) Carbon sequestration potential, physicochemical and microbiological properties of selected trees Mangifera indica L., Manilkara zapota L., Cocos nucifera L. and Tectona grandis L. Bioscience Discovery 7: 131-139.
- Awe Djongmo V, Noiha Noumi V, Zapfack L, et al. (2019) Carbon sequestration potential and economic value in agroforestry parkland to tectona grandis L. f. (Verbenaceae) in Central Africa: A case study to Department of Poli (Northern Region in Cameroon). Advances in Research 18: 1-16.
- Kooke Gomido Xavier, Ali Rachad Kolawolé Foumilayo Mandus, Djossou Jean-Marie, et al. (2019) Estimation du stock de carbone organique dans les plantations de acacia auriculiformis A. Cunn. ex Benth. des forêts classées de Pahou et de Ouèdo au Sud du Bénin. Int J Biol Chem Sci 13: 277-293.
- IPCC (2003) Good Practice Guidance for Land Use, Land-use Change and Forestry (LULUCF). Institute for Global Environmental Strategies, Hayama, Japan.
- Palm CA, Woomer PL, Alegre J, et al. (2000) Carbon sequestration and trace gas émissions in slash-and-burn and alternative land uses in, the humid tropics. Final Report, Alternatives to Slash and Burn (ABS). Climate Change Working Group, Phase II. ICRAF, Nairobi, Kenya 29.
- Manlay RJ, Masse D, Chotte JL, et al. (2002) Carbon, nitrogen and phosphorus allocation in agro-ecosystems of a West African savanna. II. The soil component under semi-permanent cultivation. Agriculture, Ecosystems and Environment 88: 233-248.
- Tschakert P (2004) The costs of soil carbon sequestration: An economic analysis for small-scale farming systems in Senegal. Agric Sys 81: 227-253.
- Bohre P, Chaubey OP, Singhal PK (2012) Biomass accumulation and carbon sequestration in dalbergia sissoo Roxb. International Journal of Bio-Science and Bio-Technology 4: 29-44.
- Pandya IY, Salvi H, Chahar O, et al. (2013) Quantitative analysis on carbon storage of 25 valuable tree species of Gujarat, incredible India. Indian J Sci Res 4: 137-141.
- Suryawanshi MN, AR Patel, TS Kale, et al. (2014) Carbon sequestration potential of tree species in the environment of North Maharashtra University campus, Jalgaon (MS) India. Biosci Disc 5: 175-179.
- Albrecht A, Kandji ST (2003) Carbon sequestration in tropical agroforestry Systems. Agric Ecos Env 99: 15-27.
- Montagnini F, Nair P (2004) Carbon sequestration: An underexploited environmental benefit of agroforestry systems. Agroforestry Systems 61: 281-295.
- Volkoff B (1976) Notice explicative N° 66 (2). Carte pédologique de reconnaissance de la République populaire du Bénin à 1/200.000. Feuille de Porto- Novo (2). ORSTOM, Paris, France, 39.
- Saidou A, Dossa AFE, Gnanglè PC, et al. (2012) Evaluation du stock de carbone dans les systèmes agroforestiers à karité (Vitellaria paradoxa C.F. Gaertn.) et à néré (Parkia biglobosa Jacq. G. Don) en zone Soudanienne du Bénin. Bulletin de la Recherche Agronomique du Bénin (BRAB) 1-9.
- Eglin T (2005) Impact de l'hydromorphie et la topographie sur la variabilité spatiale des stocks de carbone en forêt de Fougères (Ille-et-Vilaine). Thèse INA, Paris-Grignon, France, 50.
- Lecointe S, C Nys, C Walter, et al. (2006) Estimation of carbon stocks in a beech forest (Fougères forest - W. France): Extrapolation from plots to the whole forest. Ann For Sci 63: 139-148.
- Mohamed Boulmane, Mohamed Makhloufi, Jean-Pierre Bouillet, et al. (2010) Estimation du stock de carbone organique dans la chênaie verte du Moyen Atlas marocain. Acta Botanica Gallica 157: 451-467 .
- Batjes NH (2005) Soil carbon stocks and projected changes within crosplands in Jordan. Geoderma 25: 415-423.
- Van Engelen VWP, NH Batjes, K Dijkhorn, et al. (2005) Harmonized global soil resources database (final rapport). Report 2005/06. FAO and ISRIC-World Soil Information, Wageningen, 17.
- Fontaine S, Barot S, Barré P, et al. (2007) Stability of organic carbon in deep soil layers controlled by fresh carbon supply. Nature 450: 277-280.
- Arrouays D, A Bispo, J Thorette, et al. (2005) Les sols et les changements climatiques. Lettre Inform. GIS Sols 6: 1-4.
Corresponding Author
AWE DJONGMO Victor, Department of Biological Sciences, Faculty of Science, University of Ngaoundere, P.O.BOX: 454, Ngaoundere, Cameroon.
Copyright
© 2019 Victor AD, et al. This is an open-access article distributed under the terms of the Creative Commons Attribution License, which permits unrestricted use, distribution, and reproduction in any medium, provided the original author and source are credited.