Dimensional Analysis and Constitutive Equations of Quantitative Microdialysis
Abstract
As a membrane-based sampling technique microdialysis can be quantified by the relative recovery and the time-to-reach-the-steady-state in sampling. In this paper dimensional analysis is applied to show that the performance can be collectively determined by three dimensionless numbers, the Péclet and Reynolds numbers of the perfusion flow and the membrane-to-channel area ratio. With three dimensionless numbers in place, combinatorial simulations were conducted to calculate the relative recovery and time-to-reach-the-steady-state of microdialysis under various operation conditions at different scales. The results are curve-fitted to formulate two constitutive equations for describing an optimal condition for operating microdialysis under continuous perfusion. When operating at an extremely slow speed of perfusion, microdialysis will become ineffective because of the prolonged temporal resolution. A discussion on this issue implies that new operation principles such as droplet-based microdialysis would be needed.
Keywords
Microdialysis, Reynolds number, Péclet number, Digital microdialysis
Introduction
Microdialysis is an invasive membrane-sampling technique for continuous sampling [1]. A microdialysis probe consists of a semi-permeable membrane at its tip. Microdialysis probes sample the extracellular fluid through the membrane by diffusion. When placing the probe in tissue, one side of the semi-permeable membrane is in contact with extracellular fluid and the other side is flushed with a dialysis fluid (Perfusate) that takes-up substances (Analyte) from the extracellular fluid through the membrane-perfusion in the probe builds up a concentration gradient that allows analyte to diffuse into the probe and then flows the analyte out of the tube for further analysis. When coupled with analytical separation techniques, microdialysis enables online monitoring of targeted bioactive analytes.
The ability to continuously sample the extracellular compartment has opened up a wide range of applications of microdialysis in biological sample cleanup [2], observation of metabolic activity in tissues in humans [3], and monitoring neurotransmitters in brains [4] since its first presentation in 1966 [5]. Microdialysis also allows for delivery of compounds into targeted extracellular sites [6].
The sampling performance of microdialysis can be quantified by relative recovery, a ratio of the steady-state concentration of the analyte in the perfusate to the concentration of the analyte in the extracellular fluid. Because the continuous sampling in microdialysis creates an environment that analyte can never saturate the probe chamber, relative recovery is always smaller than 100%. Relative recovery is determined by perfusate flow rate and the probe size. As a figure or merit, users stay with a rule of thumb that the slower perfusion rate, the higher the relative recovery [7]; the larger the probe is, the longer for analyte concentration to reach its steady-state value [1].
The relative recovery can be determined empirically or directly measured. The empirical approach at majority consists of mathematical models for describing the process analyte transportation in vitro or in vivo [8-12]. Direct measurement involves a few steps including calibration of the probe by estimating the in vivo efficacy [10,13-15] and the appropriate rate of perfusate flow for achieving an adequate level of relative recovery [1]. Given these abundant tools, however, users must either conduct an empirical estimation or proceed a measurement-both can be rigorous.
In this paper we numerically determine the relative recovery and the time-to-reach-the-steady-state of sampling. The predictive modeling to be introduced here in is based on dimensional analysis to disclose that microdialysis can be exactly governed by three dimensionless parameters, which is our first contribution in this paper. A combinatorial simulation is then conducted to calculate the relative recovery and the time-to-reach-the-steady-state in sampling at various combinations of the influencing parameters. The results are curve-fitted to exhibit a constitutive law for the relative recovery and time-to-reach-the-steady-state of sampling, individually. Finally, we conclude out work by discussing an important implication of the constitutive law in microdialysis.
Implicit Model for Quantitative Microdialysis
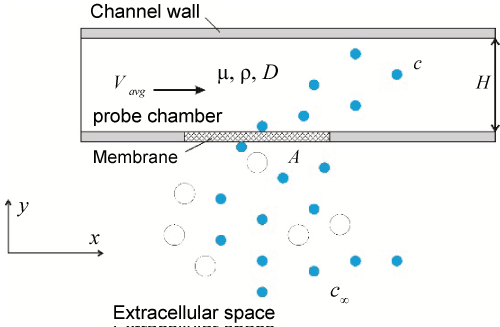
In operation, a microdialysis probe is continuously supplied with a clean perfusate to establish a concentration gradient across the probe chamber, through the porous membrane, and to the extracellular space. The concentration gradient allows molecular particles to diffuse from the Extracellular Space (ECS) through the membrane into the probe chamber. Once into the probe chamber, the molecular particles (i.e., analyte) are flushed by the perfusate flow to the outlet for further chemical analysis. The chamber thus can never be saturated, thus allowing continuous sampling of new particles. The process of microdialysis is illustrated by a two-dimensional model shown in Figure 1. Although this model is two-dimensional, it will not affect the steady-state distribution of analyte in the chamber because a face diffusion problem in three dimensions is equivalent to a line diffusion problem in two dimensions [16].
For simplicity, the model in Figure 1 has a rectangular domain, which is different from the conventional models described by the cylindrical coordinates [9,10]. Such a simplified, rectangular model is perfectly fit to the purpose of microfabricated prototypes. In Figure 1, analyte diffuse from the extracellular fluid, through the porous membrane, into the probe chamber. The perfusate fluid flows through the chamber from left to right as a Poiseuille flow. A non-slip boundary condition is imposed along the interior wall of the channel.
Here we consider eight parameters [10], as highlighted in Figure 1 and listed in Table 1, to model the transportation of analyte during the microdialysis. The relative recovery is rr is defined as the ratio between c and c∞. The concentration of analyte c is a function of the remaining parameters as follow:
Dimensional Analysis
By applying a dimensional analysis on Eq. (1) [17], we obtain:
From Eq. (2) it can see that the relative recovery rr is governed by three dimensionless parameters: HVavg /D which is the Péclet number, A/H2 the membrane-to-channel area ratio, and which is the Reynolds number. The larger the coefficient of diffusion, the smaller Péclet number. The faster the perfusate flow, the larger the Reynolds number. Stronger diffusivity of analyte (i.e., a smaller Péclet number) will increase the relative recovery, while a faster perfusate flow (i.e., a larger Reynolds number) will decrease the concentration. In as much, the Péclet number and the Reynolds number play a competitive role in determining the relative recovery. Smaller probes and larger membrane areas are advantageous of a higher relative recovery.
Numerical Scheme for Quantitative Microdialysis
The relative recovery in Eq. (2) is an implicit function. In this section we presented a numerical process dedicated to an empirical formulation of an explicit function of the relative recovery.
Microdialysis is a process of transportation of analytes by diffusion and flow convection, which can be formulated as [17]:
In extracellular space (ECS)
In membrane
In probe chamber
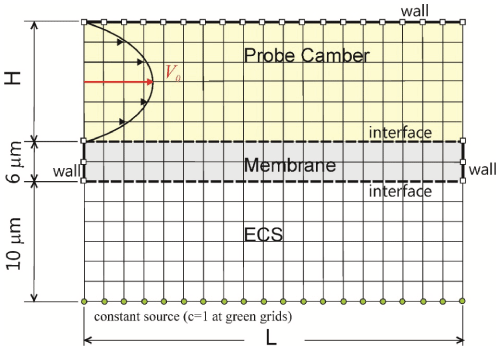
This problem was implemented in Matlab by the finite difference method with a schematic problem domain in Figure 2. In this illustration we have placed a constant line source in the extracellular fluid. Such an arrangement is appropriate for modeling microdialysis in vitro, as it depicts a scenario of placing a microdialysis probe in a large, well-stirred solution reservoir for instrumental performance quantification. The coefficients of diffusion were calculated separately to consider the pore geometry of the membrane and ECS. The boundary conditions include (1) Constant concentration at the designated grids as the source, (2) A reflective boundary condition imposed at the three walls indicated, (3) The diffusive flux is continuous at the interfaces, and (4) The perfusate flow in the camber was modeled as a Poiseuille flow. The pressure gradient in the transverse direction is essentially zero in the probe chamber because of its large aspect ratio. The pressure gradient in the transverse direction is essentially zero in the probe chamber because of its large aspect ratio. In the direction of flow, the pressure gradient can be reasonably assumed to be zero due to a very short dimension of a microdialysis probe which is in practice in the range of sub-millimeters. For the initial condition, zero concentration was set to all the grids except at the source in Figure 2. Where the concentration is constant and equal to one. In all simulations the vertical dimension of the membrane and extracellular space was fixed to be 6 µm and 10 µm, respectively.
The time-to-reach-the-steady-state distribution of concentration, designated by the parameter ss here in, was defined as follow. Numerically the concentration profile of analyte at a few places in the chamber was probed: once all the monitored concentrations vary less than a preset value (10-6 for all our simulations) for straight 10 time steps in the finite difference simulations, it reached the steady state and the simulation was accordingly terminated. The relative recovery was defined as the maximum of the concentrations line-averaged along each vertical grid-line in the chamber of the lattice model.
In total 75 combinational trials of different values for the six parameters were conducted. For each trial we calculated the relative recovery rr and the time-to-reach-the-steady-state ss for three different sizes of discretization of the problem domain, which allow for discretization error estimation per the Grid Convergence Index (GCI) method [18]. The GCI method, which was derived from the Richardson extrapolation method [19], is a currently a well-accepted method available for predicting numerical uncertainty. Below, for the calculated rr and ss values by each of the three discretization schemes, we brief the error estimation procedure of the GCI method [18]:
Step 1. Calculate the averaged lattice size by:
Here we implemented three discretization schemes associated with an averaged lattice size h1 (small), h2 (medium), and h3 (large), individually. Let rr1, rr2 and rr3 be the associated relative recovery and ss1, ss2 and ss3 the time-to-reach-the-steady-state with each of the three discretization schemes, individually, for the following calculations.
Step 2. Calculate the refinement factors:
Step 3. Determine the apparent order p of the GCI method:
where and for error estimation of the relative recovery and and for the time-to-reach-the-steady-state, individually.
Step 4. Calculate the extrapolated values:
Similarly, calculate , and
Step 5. Calculate the following error estimates:
a. The relative error:
Similarly, calculate
b. The extrapolated relative error:
Similarly, calculate
c. The fine grid convergence index:
Similarly, calculate GCI21 for the time-to-reach-the-steady-state.
Step 6. Report the following information for both the relative recovery and time-to-reach-the-steady-state: , , , , and GCI21.
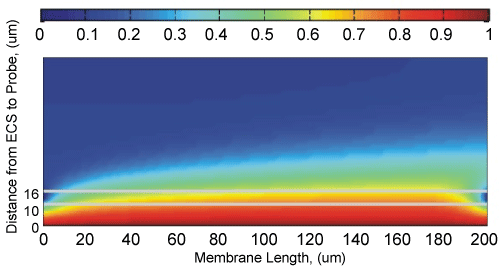
One typical steady-state distribution of the analyte concentration is shown in Figure 3. In this illustration the following parameters were used: L = 200 µm, H = 60 µm; , µ = 0.09 cp (which corresponds to an aqueous solution at 20 ℃); The perfusate solution flows rightwards through the chamber with a parabolic velocity profile with the maximum velocity V0 = 240 µm/s along the middle streamline. The model molecule used in this illustration was glutamate, which has a coefficient of diffusion 760 µm2/s, in aqueous solution [20,21]. Therefore, in the probe chamber we set DCHM = µm2/s. Determination of the equivalent coefficient of diffusion in porous media (e.g., DECS and DMEM) was individually described in another manuscript Interstitial [22], which was dedicated to the development of a simple numerical technique for calculating the equivalent coefficient of diffusion in porous media. When diffusing through porous media, particles take a longer and more tortuous path than in a barrier-free medium. Therefore, its equivalent coefficient of diffusion in a porous medium is always smaller than that in a bulky, barrier-free medium. The equivalent coefficient of diffusion is a function of the porosity and topology of a porous medium. This numerical procedure allows us to determine (1) The equivalent coefficient of diffusion of glutamate DECS = 367 µm2/s through a normal Extracellular Space (ECS) in benign brains which have an averaged volume fraction about 20%, and (2) The equivalent coefficient of diffusion of glutamate DMEM = 108 µm2/s through a sift-like porous membrane. For the example shown in Figure 3, the time-to-reach-steady-state is seconds and the relative recovery is .
Constitutive Law for Quantitative Microdialysis
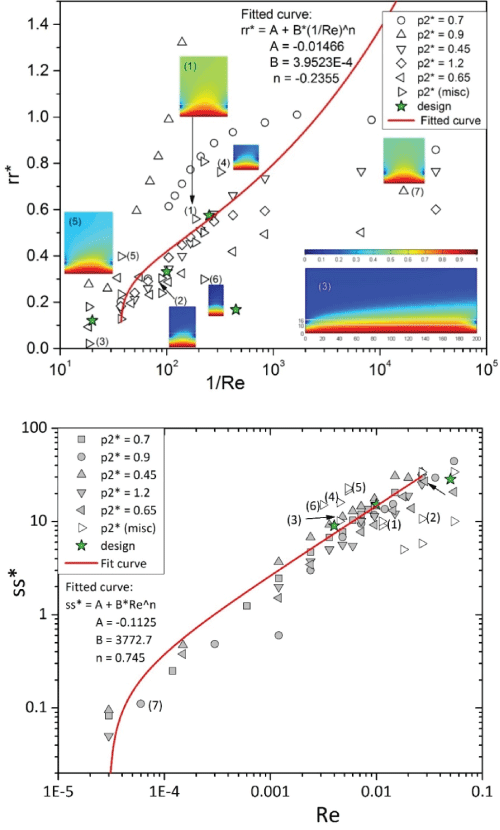
For all the 75 trials conducted the range of parameters are: the averaged lattice size is: h1 in [0.63, 0.82] µm, h2 in [0.82, 1.00] µm, and h3 in [1.00, 1.22] µm; the dimension L is in [50, 200] µm, H in [10, 60] µm; the perfusion speed is V0 (see Figure 2) is in [2, 2225] µm/s; the coefficients of diffusion DCHM is in [760, 3000] µm2/s; the remaining parameters were: DECS = 367 µm2/s, and DMEM = 108 µm2/s; and µ = 0.09 cp. After implementing the GCI method we adopted the and as the estimated values for the relative recovery and time-to-reach-the-steady-state, which were then scaled per the following equations to obtain rr* and ss* for curve-fitting (as plotted in Figure 4):
where V0 is the maximum velocity of the flow through the chamber (cf. Figure 2), and is a dimensionless parameter defined empirically as follow to resemble the membrane-to-channel area ratio:
in which w is the value of the out-of-plane dimension of the channel. To use Eq. (16-18), readers should convert the unit of A into µm2, H and W into µm, and V0 into µm/s.
All the 75 cases simulated populated in Figure 4 were in the low Reynolds number regime and had an estimated time-to-reach-the-steady-state shorter than 3 seconds. The data points for both of the rr* and ss* plots were curve-fitted by a power-law function:
In Figure 4 we also illustrate the distribution of concentration by the 7 insets in the rr* plot. For each case study of the seven insets, Table 2 lists the parameters used in simulation and the results of error analysis by the GCI method. The information in Figure 4 can be further elaborated by four categories:
1. On the fitted rr* curve-represented by the data points labeled (1), (2), and (3) in Figure 4. The relative recovery can be predicted by Eq. (6). The fitted rr* curve depicts a desired design scenario for microdialysis, in which the temporal resolution is just fast enough to acquire an appropriate level of relative recovery.
2. Above the fitted rr* curve-represented by the data points (4) and (5). This region features a relatively large relative recovery. It corresponds to relatively strong diffusion as compared to perfusion, so analytes spend longer than necessary in the chamber, concentrating there and thus resulting in a higher recovery in microdialysis.
3. Below the fitted rr* curve-represented by the data point (6). This region features a relatively low relative recovery. It corresponds to relatively strong perfusion as compared to diffusion, so analytes gain no time to concentrate the chamber before flowing out there. It causes a relatively low recovery in microdialysis. This undesirable scenario can be fixed by using a slower flow rate of perfusion, a tube with a larger membrane, or both.
4. On the extremely low Re region (e.g., the rightmost region in the rr* plot)-represented by the data point (7). There are a few sparsely distributed data points which can hardly form any pattern for curve fitting. This region features a nearly stop flow, which is impractical to the application of continuous-flow based microdialysis.
Although the Péclet numbers are not explicitly associated with the data points in Figure 4, smaller Péclet numbers correspond to larger relative recovery (per Eq. (2)). For microdialysis operated under large Péclet numbers (e.g., data point (3) in Figure 4) the analyte exhibit weaker diffusivity (attributed to a smaller coefficient of diffusion) than convectivity (attributed to a faster perfusion rate), thus analytes lack a sufficient amount of time to concentrate the chamber before flowing out. On the opposite, data point (7) is associated with a low Péclet number, at which the analyte quickly permeate through the entire chamber before perfusate flow flushes them out, which results in a relatively high concentration of analytes in the chamber.
Some data points that locate in a regime of a relatively large Re value (e.g., data point (3)) are associated with a relatively fast perfusate flow rate. Under a fast flow rate, the back pressure in the probe and the interconnect tubing can be an issue, and is a bottleneck for miniaturizing the microdialysis technique [17]. Here let's contemplate an open question: Can continuous perfusion still be effective and efficient in microchannels without the back pressure? One possible answer would be to seek for a design which operates microdialysis at very low Reynolds numbers such as the scenario depicted by data point (7) by cutting the continuous perfusion flow into a series of segments (or droplets). In this regard, droplet microdialysis would be an ideal platform for prototyping this design [17].
In the rr* plot, seven insets are placed next to individual labels (1)-(7) to illustrate various sampling scenarios. The dimensions of the problem domain for each inset are shown in Table 2. The legend "design" labels a group of data points corresponding to the governing parameters (Table 1) arbitrarily chosen.
Conclusions
The transportation of analyte in microdialysis sampling has been formulated and simulated in this paper. The grid convergence index method was applied for the error estimation of the discretization schemes. The relative recovery is determined by the diffusivity of analyte and convectivity of perfusate flow. The fit curves in Figure 4 can be used as an optimal design criterion, by which users can expect a relative recovery and its corresponding time for achieving the steady state. At very low Re numbers the relative recovery becomes less predictable in our results, suggesting the limit of continuous microdialysis as formulated in Eq. (2). This limitation triggers a question: "Does a stop flow applicable in miniaturized microdialysis?" We propose the droplet microdialysis as a solution for operating microdialysis without the back pressure issue.
References
- Chefer VI, Thompson AC, Zapata A, et al. (2009) Overview of brain microdialysis. Curr Protoc Neurosci.
- Wang PC, DeVoe DL, Lee CS (2001) Integration of polymeric membranes with microfluidic networks for bioanalytical applications. Electrophoresis 22: 3857-3867.
- Ramsis K Benjamin, Fred H Hochberg, Elizabeth Fox, et al. (2004) Review of microdialysis in brain tumors, from concept to application: first annual carolyn Frye-Halloran symposium. Neuro Oncol 6: 65-74.
- Bourne JA (2003) Intracerebral Microdialysis: 30 Years as a Tool for the Neuroscientist. Clin Exp Pharmacol Physiol 30: 16-24.
- Bito L, Davson H, Levin E, et al. (1966) The concentrations of free amino acids and other electrolytes in cerebrospinal fluid, in vivo dialysate of brain and blood plasma of the dog. J Neurosci 13: 1057-1067.
- Drew KL, Ungerstedt U (1991) Pergolide presynaptically inhibits calcium-stimulated release of gamma-aminobutyric acid. J Neurochem 57: 1927-1930.
- Wages SA, Church WH, Justice JB Jr (1986) Sampling considerations for on-line microbore liquid chromatography of brain dialysate. Anal Chem 58: 1649-1656.
- Amberg G, Lindefors N (1989) Intracerebral microdialysis: II Mathematical studies of diffusion kinetics. J Pharmacol Methods 22: 157-183.
- Benveniste H, Huttemeier PC (1990) Microdialysis-theory and application. Prog Neurobiol 35: 195-215.
- Bungay PM, Morrison PF, Dedrick RL (1990) Steady state theory for quantitative microdialysis of solutes and water in vivo and in vitro. Life Sci 46: 105-119.
- Morrison PF, Bungay PM, Hsiao JK, et al. (1991) Quantitative microdialysis: analysis of transients and application to pharmacokinetics in brain. J Neurochem 57: 103-119.
- Benveniste H, Hansen AJ, Ottosen NS (1989) Determination of brain interstitial concentrations by microdialysis. J Neurochem 52: 1741-1750.
- Jacobson I, Sandberg M, Hamberger A (1985) Mass transfer in brain dialysis devices - a new method for estimation of extracellular amino acids concentration. J Neurosci Methods 15: 263-268.
- Lonnroth P, Jansson PA, Smith U (1987) A microdialysis method allowing characterization of intercellular water space in humans. Am J Physiol 253: E228-E231.
- Dahlin AP, Wetterhall M, Caldwell KD, et al. (2010) Methodological aspects on microdialysis protein sampling and quantification in biological fluids: an in vitro study on human ventricular CSF. Anal Chem 82: 4376-4385.
- Crank J (1975) The Mathematics of Diffusion. Oxford, Oxford Univ Press.
- Chen CF, Drew KL (2008) Droplet-based microdialysis-concept, theory, and design consideration. J Chromatogr A 1209: 29-36.
- Celik IB, Ghia U, Roache PJ, et al. (2008) Procedure for estimation and reporting of uncertainty due to discretization in applications. J Fluids Eng 130.
- Roache PJ (1994) Perspective: A Method for Uniform Reporting of Grid Refinement Studies. J Fluids Eng 116: 405-413.
- Trommershäuser J, Marienhagen J, Zippelius A (1999) Stochastic model of central synapses: slow diffusion of transmitter interacting with spatially distributed receptors and transporters. J Theor Biol 198: 101-120.
- Ventriglia F, Di Maio V (2000) A Brownian model of glutamate diffusion in excitatory synapses of hippocampus. Biosystems 58: 67-74.
- Chen CF (2017) Interstitial Diffusion and Combined Drifting Motion of Brownian Particles – Modeling Toward Miniaturization of Microdialysis Probes. Manuscript in preparation.
Corresponding Author
CF Chen, Department of Computer Science, Brigham Young University, Provo, UT, USA.
Copyright
© 2017 Chen CF. This is an open-access article distributed under the terms of the Creative Commons Attribution License, which permits unrestricted use, distribution, and reproduction in any medium, provided the original author and source are credited.

