Design of Hypervelocity Flow Generator (HFG) and Its Diagnostics
Abstract
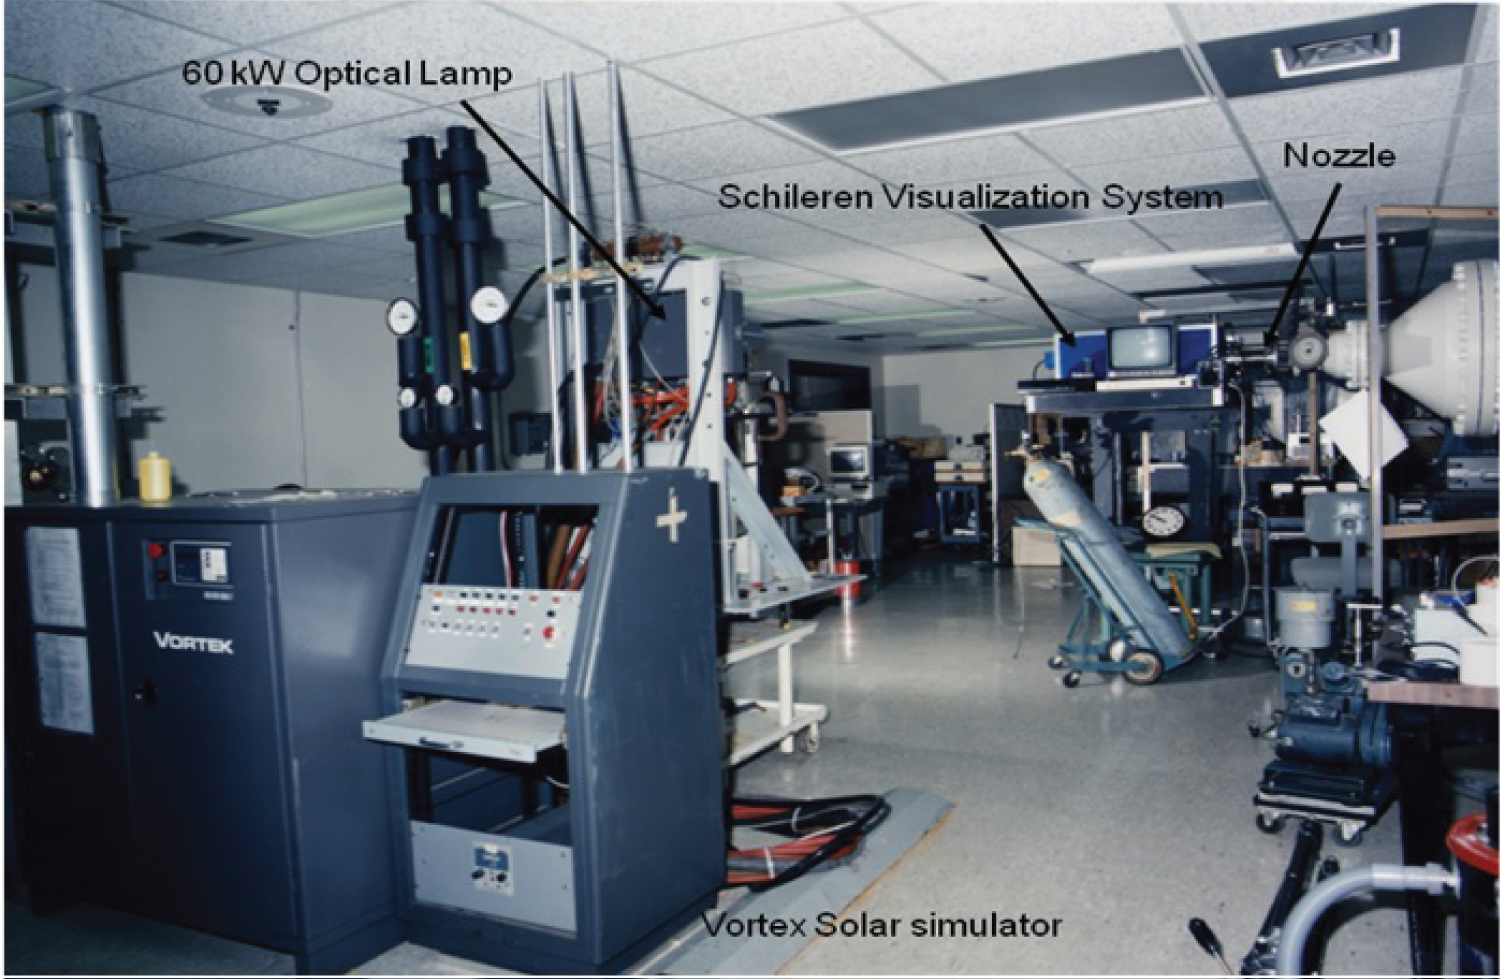
Ground facility for hypersonic research is a key element for successful development of aerodynamically proven hypervelocity vehicles. Design concept and diagnostics of hypervelocity flow generator (HFG) were made as a test platform for hypersonic/hypervelocity spacecraft models at NASA Langley Research Center. The HFG is a hypersonic flow field generator using optically heated gas which was blown into an 80-m3 large vacuum chamber. The vacuum chamber is kept at a stable vacuum pressure with a combination of three large vacuum pumps, while the HFG is in the test mode. The HFG provides relatively a small test section with approximately a 20 cm window. This facility was designed to generate 2.45 km/sec of flow speed, and possibly to generate a continuous flow with the nozzle and vacuum system. The window at test section provides a direct observation of shock wave around a model in order to measure temperature, pressure, and density profile within the shock layer. One of the key test goals under this project was to understand why the emission spectra from the standing shockwave plasma predicted by Lora-Loran codes are significantly different from the measured emission spectra from the Flight Investigation Reentry Environment (FIRE II) Flight. The correct estimate of thermal loading on the leading edge of hypersonic vehicles greatly improves the aerodynamic design, the material selection for vehicle, and the cooling requirement and can be obtained by the precise modeling of emission spectra from shockwave plasma. However, the estimation of thermal loading is not an easy task due to complex non-equilibrium radiative process within high temperature shock layers that still falls into a category of cold plasma. Direct flight experiments are the most desirable, but not a cost-effective approach. Analysis by computational fluid dynamics (CFD) offers many test flexibilities. However, the CFD codes must be fully tested and validated with experimental data before the codes are effectively used for practical design. The large discrepancies between experiments and codes are appeared in hypersonic/hypervelocity flow regime at high altitude of 60-90 km. This HFG facility offers some important parameters for CFD code validation, such as collision cross-sections, relaxation times, reaction rate coefficients and transportation coefficients. The HFG test facility is based on the ejection flow of high temperature gas heated over to 3500 °K through a nozzle. The tungsten gas chamber of HFG is heated up to a desired temperature by a 60-kW optical power beam source. This system consists of an optical power source, a thermal chamber, an expansion nozzle, a test section, and an 80 m3 vacuum tanks. Total 60 kW optical input power is obtained from the 150 kW Vortek arc lamp system. This optical beam is focused to heat the gas chamber within which a flow media is heated. The maximum achievable temperature of the flow medium reached approximately 3500K or even higher but is limited by the melting point of the chamber material used. The exhaust velocity through nozzle was determined by the stagnation temperature and the molecular weight of working medium at the test section. In order to provide design parameters, a NASA Chemical Equilibrium with Application (CEA) computer program is used for the simulation of aero thermal data. This CEA program is able to calculate chemical equilibrium and properties of complex mixtures using shock tube parameters. For nitrogen gas at 2666K stagnation temperature, the maximum achievable velocity at the test section is approximately 2.45 km/sec which is within the range of thermal velocity of 8000K shock layer. Based on the calculation through the CEA program, the design parameters of a HFG were determined and implemented for the test section that includes an expansion nozzle. The installed test section of the experimental facility is able to sustain a condition to perform a re-entry vehicle from the space at the altitude of 60-90 km. After installation the HFG, the system was fully tested its operation and parameters were measured. An 80 m3 vacuum chamber to keep a stable downstream condition of HFG was set at 1 torr level. The pumping time to reach the minimum vacuum pressure (~ 1 torr) at the test chamber from atmospheric pressure was approximately an hour with the Kinney (MBV-14,000/MB -1600/KT-300) and Stokes (Model 1772 and 412) pumps. Such a setup condition allowed a continued operation of stable HFG experiment with the flow rate through 1, 3, or 5 mm diameters of nozzle throat. The flow characteristics of the HFG for various operating conditions were performed using a focused Schlieren method. At the 0.8 torr in the chamber pressure, a barrel shock was observed at the test section. With a sphere obstacle of 12 mm diameter in the flow, a bow shock (~ 2 mm thickness) was observed by a focused Schlieren visualization method.
Introduction
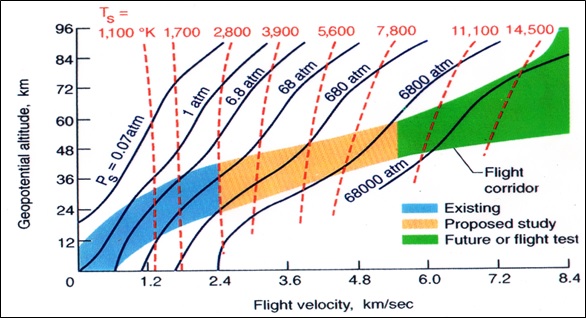
The standing-off shock pressure and temperature at the stagnant point of hypervelocity vehicles are plotted along with the flight velocity and altitude as shown in Figure 1 [1]. Even Figure 1 shows that the stagnation pressure and temperature are generally increased with flight velocity. But the shock temperature does not drastically change along with the altitude beyond the flight velocity of 4 km/sec. As indicated by the stagnation temperature in Figure 1, the forebody of hypersonic spacecraft in a flight corridor receives a tremendous thermal loading from its shock layer. The correct estimate of thermal loading is important for optimum design of the thermal protection system. There have been many efforts to study the thermos-physics of shock heated air in the vicinity of the nose of a vehicle flying at 3-6 km/sec [2-9]. This type of work relied on the non-equilibrium air radiation program developed by Park [2] and modified by Laux, et al. [3] to assess the radiative emission.
The predictions by the code of pre-flight model with experiment data show that a single-temperature (T) model is not physically correct due to insufficient number of collisions among the gas species to reach vibrational-translational equilibrium [9]. Therefore, some researchers [10,11] developed a multi-T model in order to include rarefaction effects. However, the radiance level from the vibrational-translational equilibrium can be predicted better by the single-T model than multi-T model. One of the important areas for the characterization of hypersonic/hypervelocity flows is to describe the physical correlation with chemical non-equilibrium and combustion effects including characteristics of separated flows developed in regions of shock wave/boundary-layer interaction. In this flow regime, there has been almost no experimental research done to provide input data for the single- or multi-T model developed. In the experimental study of this flow regime, the dwell-time of desired flow field in the test section becomes an important parameter. A comparison studies of hypersonic facilities based on the run-time has been made elsewhere [12,13]. Mostly well-known large shock tunnels are currently used with test times of few milliseconds. The purpose of HFG research is to establish a long run facility that offers a capability to measure the collision cross-sections and relaxation times which are regarded as important parameters for determining radiative heating within high temperature shock layers.
A HFG facility has been designed to simulate re-entry vehicle from space at the altitude of 60-80 km. Since the higher the altitude is, the less the air density is, the mean free path of the air particles is long. Fewer air molecules are in collision and exchange momentum and resulted in less viscosity. Therefore, the flow becomes slip and nearly is in free molecular regimes. In the region of transition flow, a viscous correction which depends on the Reynolds number, the probe geometry and the thermal conditions is needed to set reasonably right information of the hypersonic flow. In this study, the HFG facility was designed and set up for a continuous hypervelocity flow to provide long dwell time of access in the area of shock layer, and also the flow field in the transitional flow environment was characterized.
Aerothermodynamic Parameters
The velocity of 5-6 km/sec between 60 and 90 km altitude is the region of interest to simulate the flight corridor condition through the HFG operation. The translation kinetic energy of a molecule is also of interest in terms of velocity and temperature. There are three different terms in velocity often used as average (1), root mean square (2) and most probable velocity (3) based on their definitions [14].
Where, k is the Boltzmann Constant, T the absolute temperature, and m the mass of a molecule.
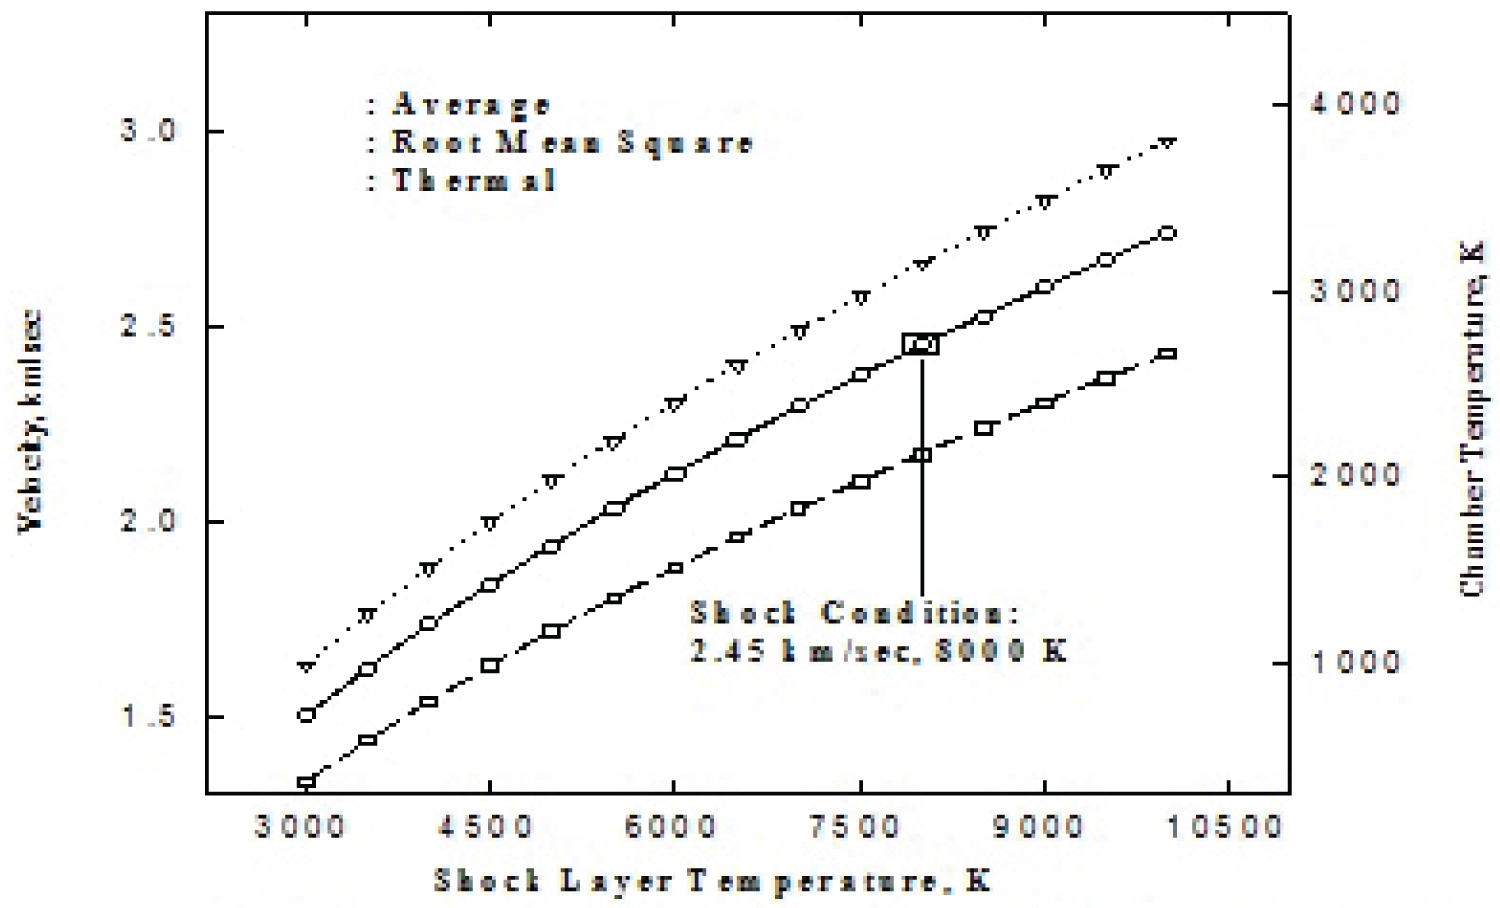
A typical temperature behind the shock layer of the reentry vehicle in the region of 60-90 km altitude is approximately 8,000 K. At this temperature, an average velocity of 2.45 km/sec is calculated from the equation (1). Figure 2 shows the velocity profiles calculated with Equations (1, 2, and 3) using the temperatures of behind the shock layer. There are approximately 20% of variation in velocity depending on which equation is employed.
In case of the equilibrium, an average temperature at behind shock is calculated with various velocities of vehicle from 1 km/sec through 7 km/sec using the CEA program [3-6], as the plots shown in Figure 3. At the vehicle's speed of 6 km/sec, the temperature behind the shock is approximately 6,160 K which is close to the data from the shock tube experiment [13] marked as circles in Figure 3. Among the molecules of air, Argon gas has not been used as input data for the CFD codes even though 1.1% of argon exists at the altitude of 80 km. However, nitrogen and argon have similar ionization potential, so that the molecular ions , and , may be simultaneously produced by electron impact and/or by a fast resonant charge-exchange reaction. The inclusion of argon into the CEA code shows that the temperature behind the shock increases due to its high atomic weight and large collision cross-section. The temperatures at the behind shock along with various vehicle velocities from the shock tube data and the CEA code have an agreement within 15%. Even though the temperature behind the shock does not vary with the inclusion of Argon as compared with the absence of Argon, the argon effects on radiation properties of molecular ions , especially, produced by electron impact ionization process could be investigated in the HFG experiment.
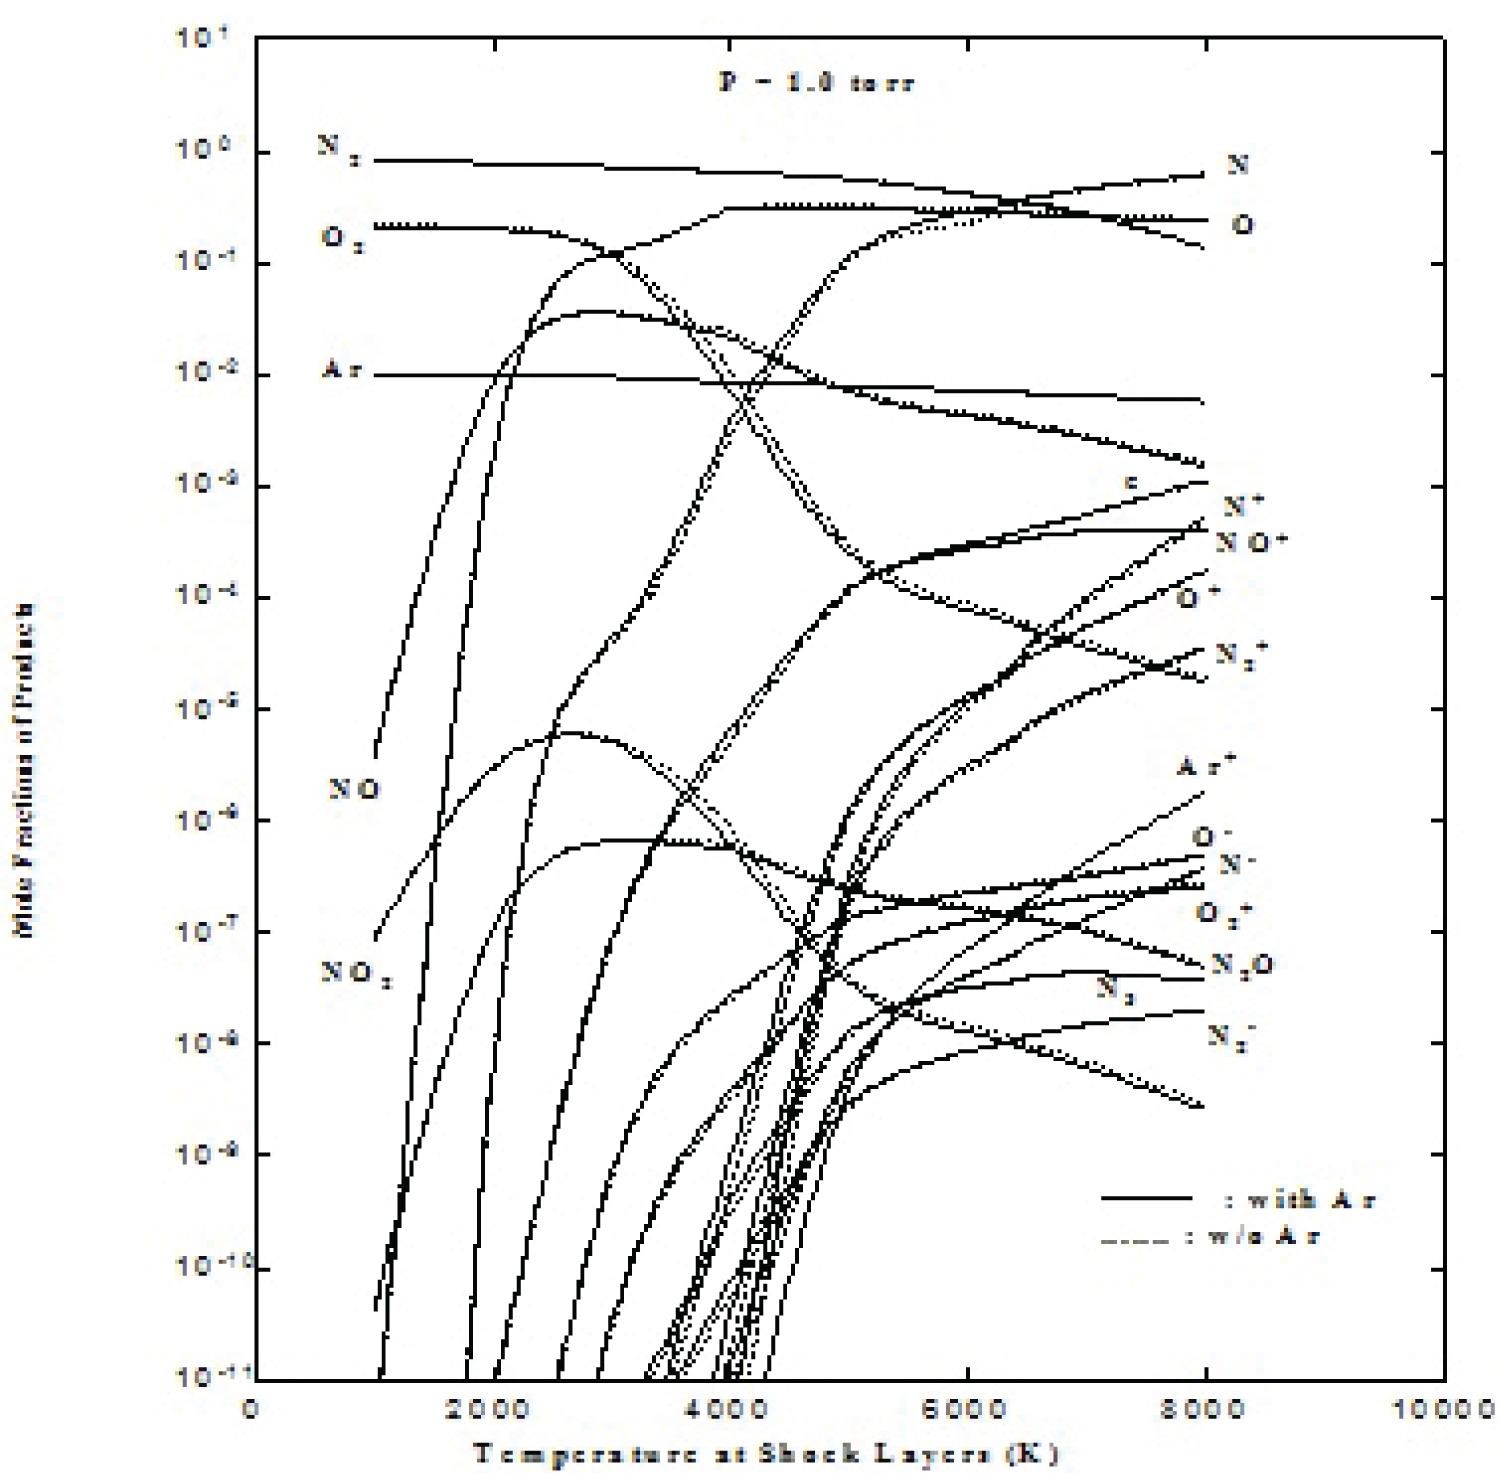
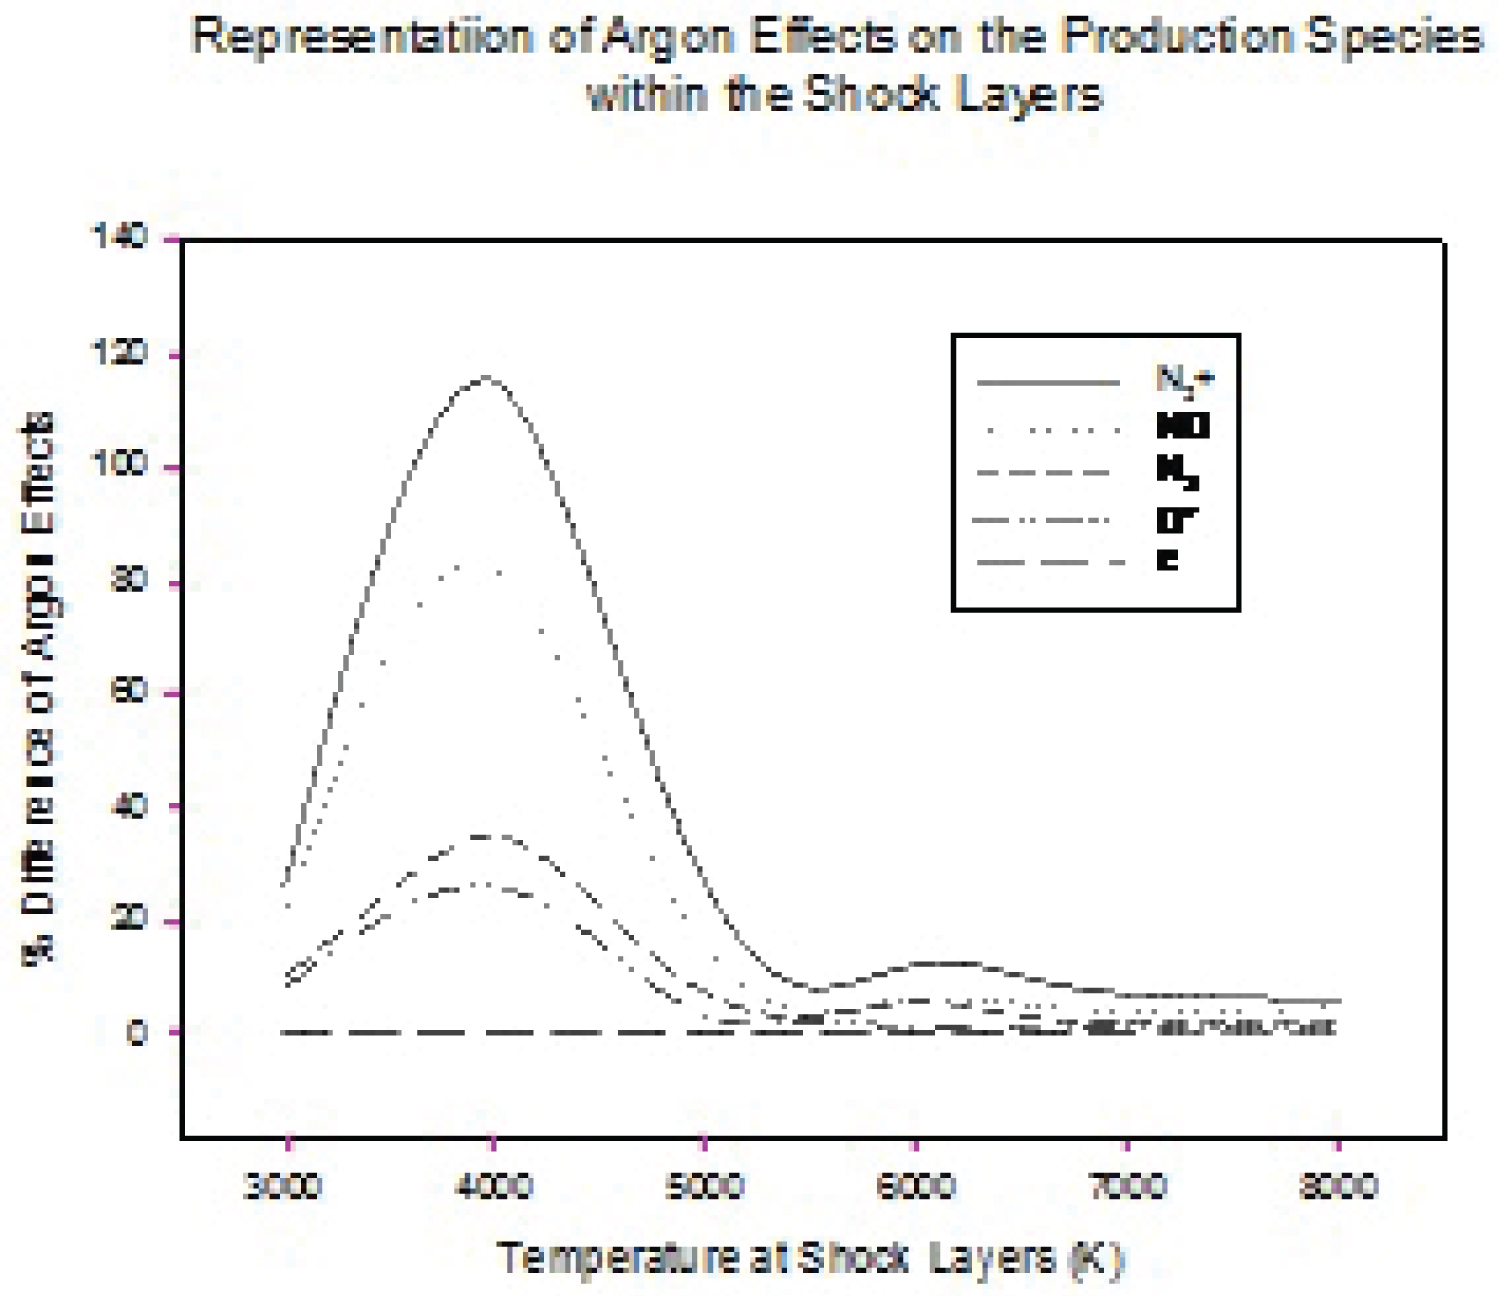
Figure 4 shows the mole fractions of constituent gases in air with and without the argon effect, respectively, at shock layers as a function of temperature calculated by the CEA code. The mole fraction is the percentage of moles of the particular species at the given conditions expressed as the total number of moles at the same conditions. The results shown are for roughly 0.1% (≈ 1 torr) of standard atmospheric density. The mole fraction of NO is increased to a maximum level at relatively low temperatures, but subsequently decreased as the temperature rises. Among the species, NO is the first molecule to become ionized and thus produce electrons as temperature increases. The air at temperature up to 8,000 K may be composed of major six chemical species: (24.34 eV [14]), N (14.534 eV), O (13.6181 eV), O2 (12.2 eV), NO (9.26 eV [15]) and Ar (15.7596 eV). Of the six species listed, NO has the lowest ionization energy and is the first to produce electron as the temperature is increased. The number of, , ions is increased as the electron does. The number of neutral, such as N2, O2, and Ar, decreases due to the low dissociation energy of the molecules. Inclusion of argon produces more and from the equilibrium calculation as shown in Figure 4. The more detail analysis of argon effects on the production of selected species within the shock layers is also plotted in Figure 5. At 4,000 K, the percentage difference of argon effects is up 110 % for due to the dissociation of molecules by collision of relatively heavy argon with large cross section (i.e. 1.1 × 10⁻¹⁸ m2 for Ar-Ar at 1 eV [16]. These phenomena can also be found at 6,000 K. The results show that the presence of more argon produces more ions such as rather than quenching. However, this calculation is based on equilibrium assumption which is used as a reference for the further experiment on non-equilibrium state.
The thermodynamic state of the atmosphere at any altitude and the desired flow velocity could lead to the estimation of the equilibrium properties of air that can be used to define the reservoir conditions of the HFG. In such a reservoir condition, a flow field at the test section through expansion can be created by emulating the chosen flight conditions. The equilibrium reservoir conditions corresponding to the flight regime of interest are shown in Figure 1. In Figure 1, the temperatures and pressures are shown for a stagnated, equilibrium reservoir condition for each altitude and velocity. The reservoir pressures greater than 6800 atm are not shown because such conditions are well beyond the capability of existing facilities, and the thermodynamic properties of air are subject to considerable departure from the ideal-gas equation of state. In order to attain higher flow velocities above 4-6 km/sec, some of MHD/MPD augmented facility would be required. Advanced techniques, such as Solar Thermal (ST), Solar Thermal and Electric (STE) and Thermal and Electric (TE) facilities for the flow generation, have been reviewed and reported in elsewhere [17]. In this HFG system study, the flow velocity of 2.45 km/sec at the altitude of 60-90 km was specifically considered. Therefore, the required stagnation temperature needs to be calculated for designing a nozzle that generates flow velocity of 2.45 km/sec. The design of HFG nozzle for hypersonic flow requires advanced thermal refractory material. For most of all, a kind of thermal energy loading mechanism is necessary to raise the temperature of working gas medium. For the aero thermodynamic condition of HFG system, the reservoir of flow medium is heated to 3000 K level by an optical power source.
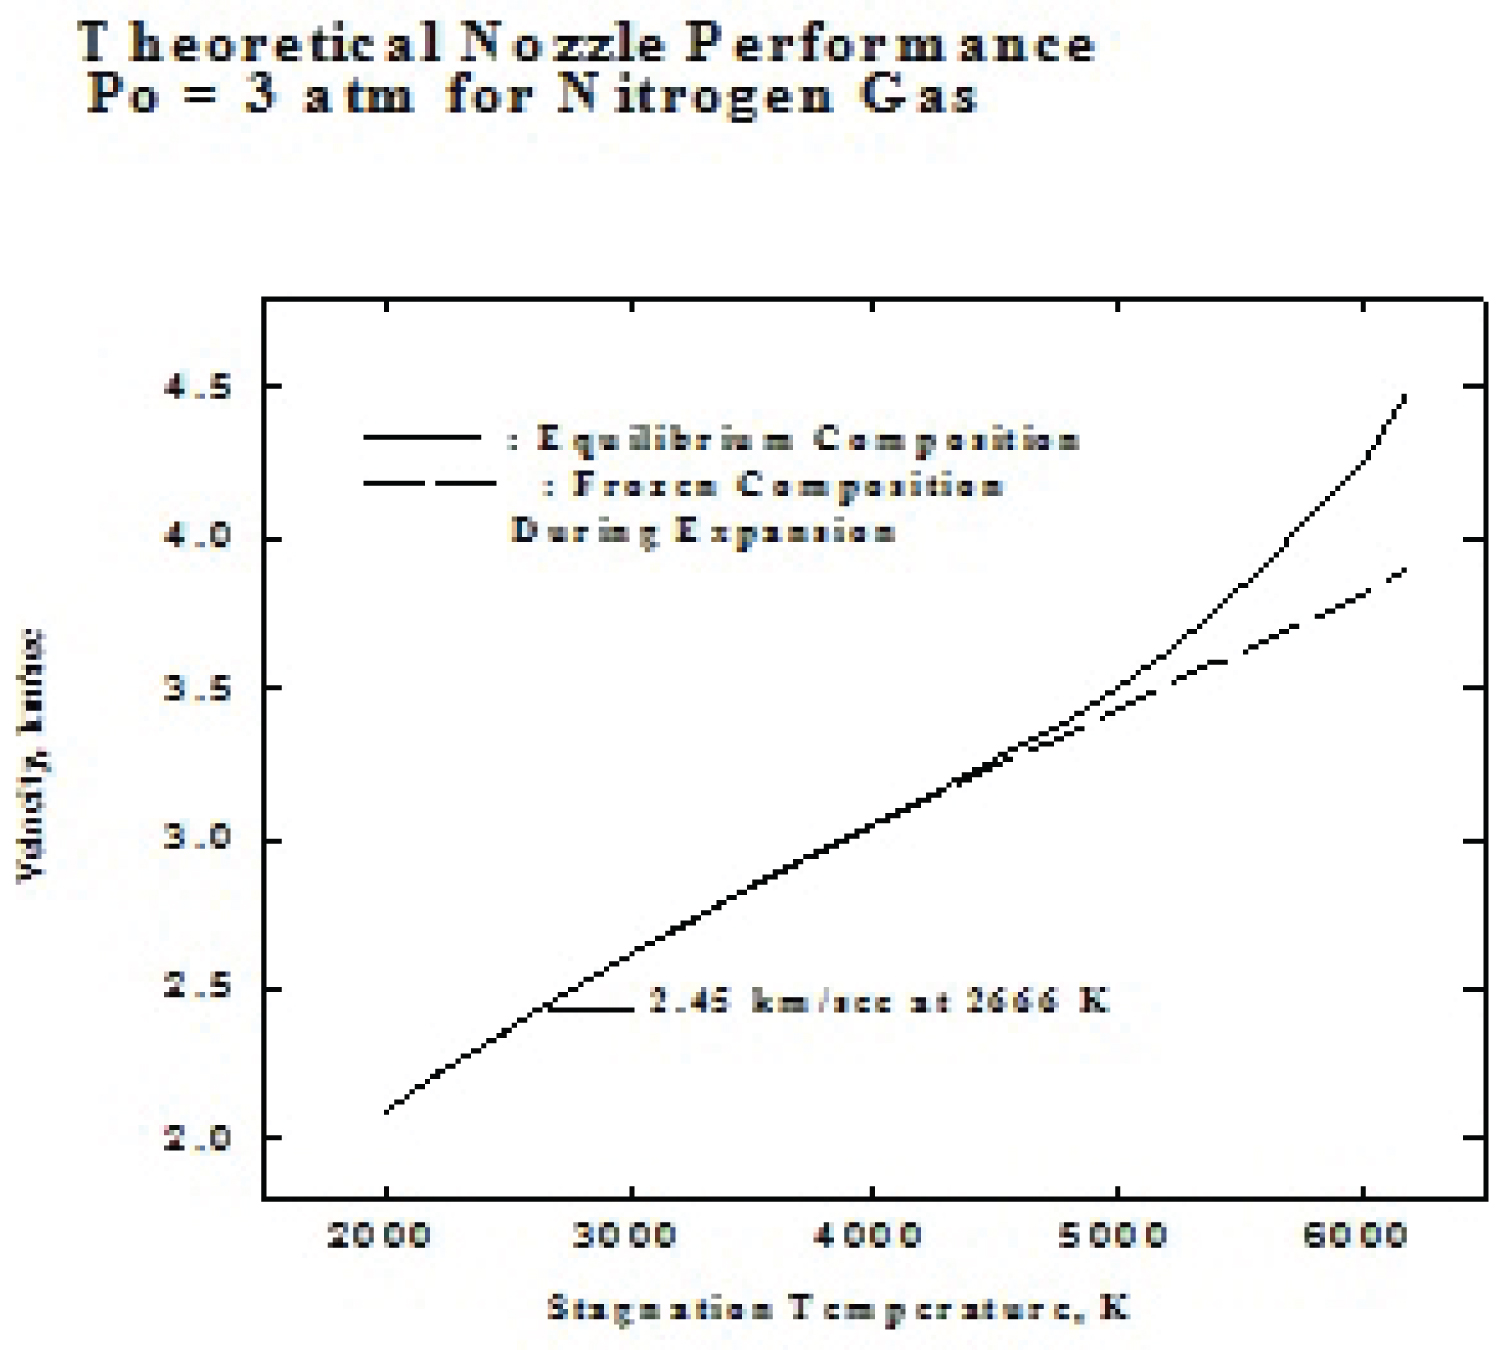
A chemical equilibrium with applications (CEA) code originated by NASA Glen Center [3] is used to calculate the thermodynamic properties of nitrogen gas for the HFG nozzle design. Using the code, the theoretical nozzle performance was estimated at a set pressure 3 atm for nitrogen gas in terms of stagnation temperature of chamber and flow velocity for both equilibrium and frozen composition through expansion process as shown in Figure 6. The required stagnation temperature of chamber to generate the flow velocity (2.45 km/sec) was 2666 K. Since at this temperature, the temperature for both equilibrium and frozen are the same, this result might indicate that the effects of vibrational transition may be negligible. When the reservoir stagnant temperature reaches approximately 3500 K, the temperatures for equilibrium and frozen state begin to show the difference due to the contribution of vibration temperature. The characteristic temperature of nitrogen for vibration is reported to be approximately 3390 K [18]. For the frozen state, this would be a situation if chemical reactions could in some way be inhibited, so that there is no accompanying change in molecular structure, even though molecular collisions still take place. With this assumption, the vibrational energy of the diatomic species can be taken to be either (a) fixed at initial value or (b) in equilibrium at its fully excited state. Therefore, mixture of gases will behave as a thermally and calorically perfect gas in a fixed composition. Therefore, if gas temperature is increased, the velocity of gas for equilibrium state is more rapidly increased due to molecular vibration than that at the frozen state.
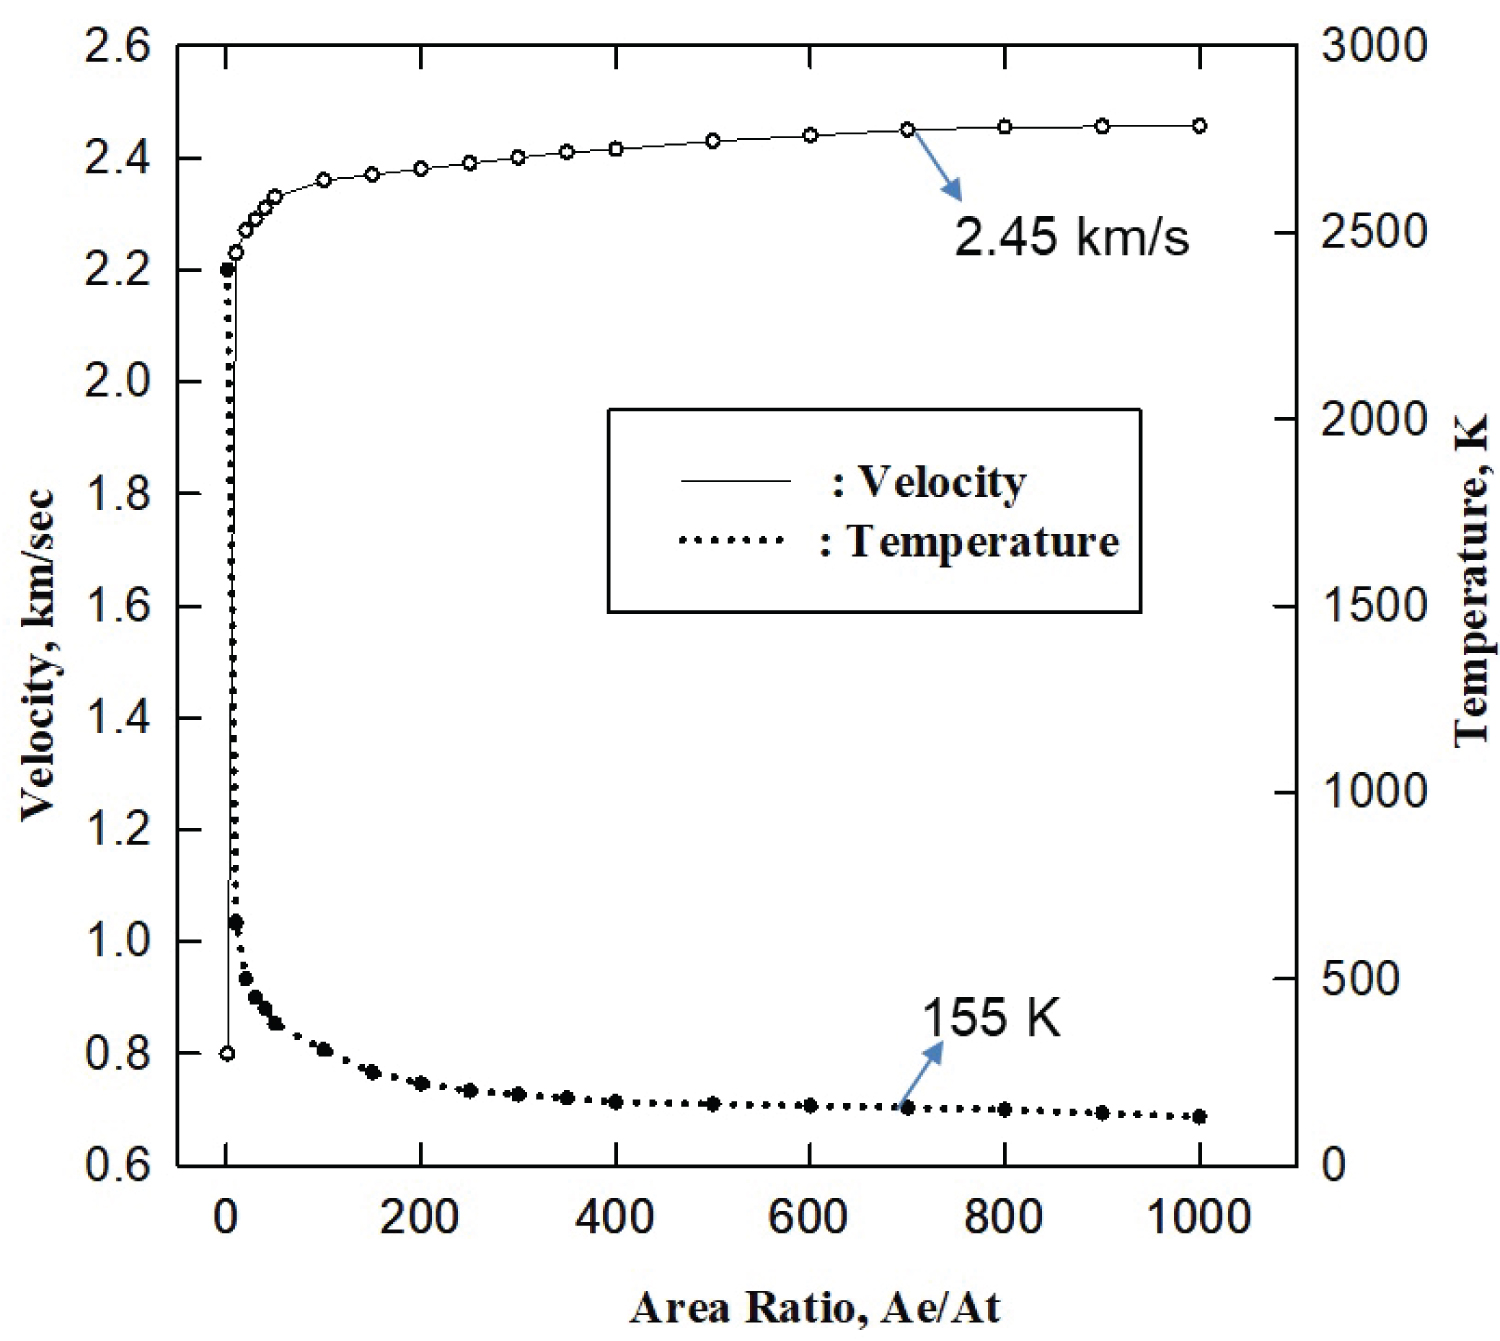
The quantitative relation of stagnation temperatures and the velocities at the nozzle (area ratio of 700) is found in Table 1. The theoretical flow velocity and temperature are calculated in terms of area ratio of the nozzle as shown in Figure 7. At the area ratio of 700, the flow velocity reaches to 2.45 km/sec, and the flow temperature and the pressure is approximately 155 K and 0.05 torr, respectively. The calculation of various performance parameters by the CEA code is based on the one-dimensional form of the continuity, momentum, and energy equations for the adiabatic condition.
One-dimensional analyses for a nozzle flow do not account of the effects on flow boundaries, boundary layers and turbulence. To added two-dimensional effects on the nozzle design, NOZZLE 2.BAS code developed by Korte, et al. [19-21] was used. The two-dimensional code provides flow parameters as function of position in the nozzle including the boundaries, turbulence and adiabatic effects. These effects can slow down gas velocity at the exit of a nozzle. However, this code does not include molecular internal motion, such as vibrational excitation and relaxation effects. The model in NOZZLE 2.BAS code assumed that the gas medium is calorically perfect which has a constant specific heat-capacity.
Nozzle design
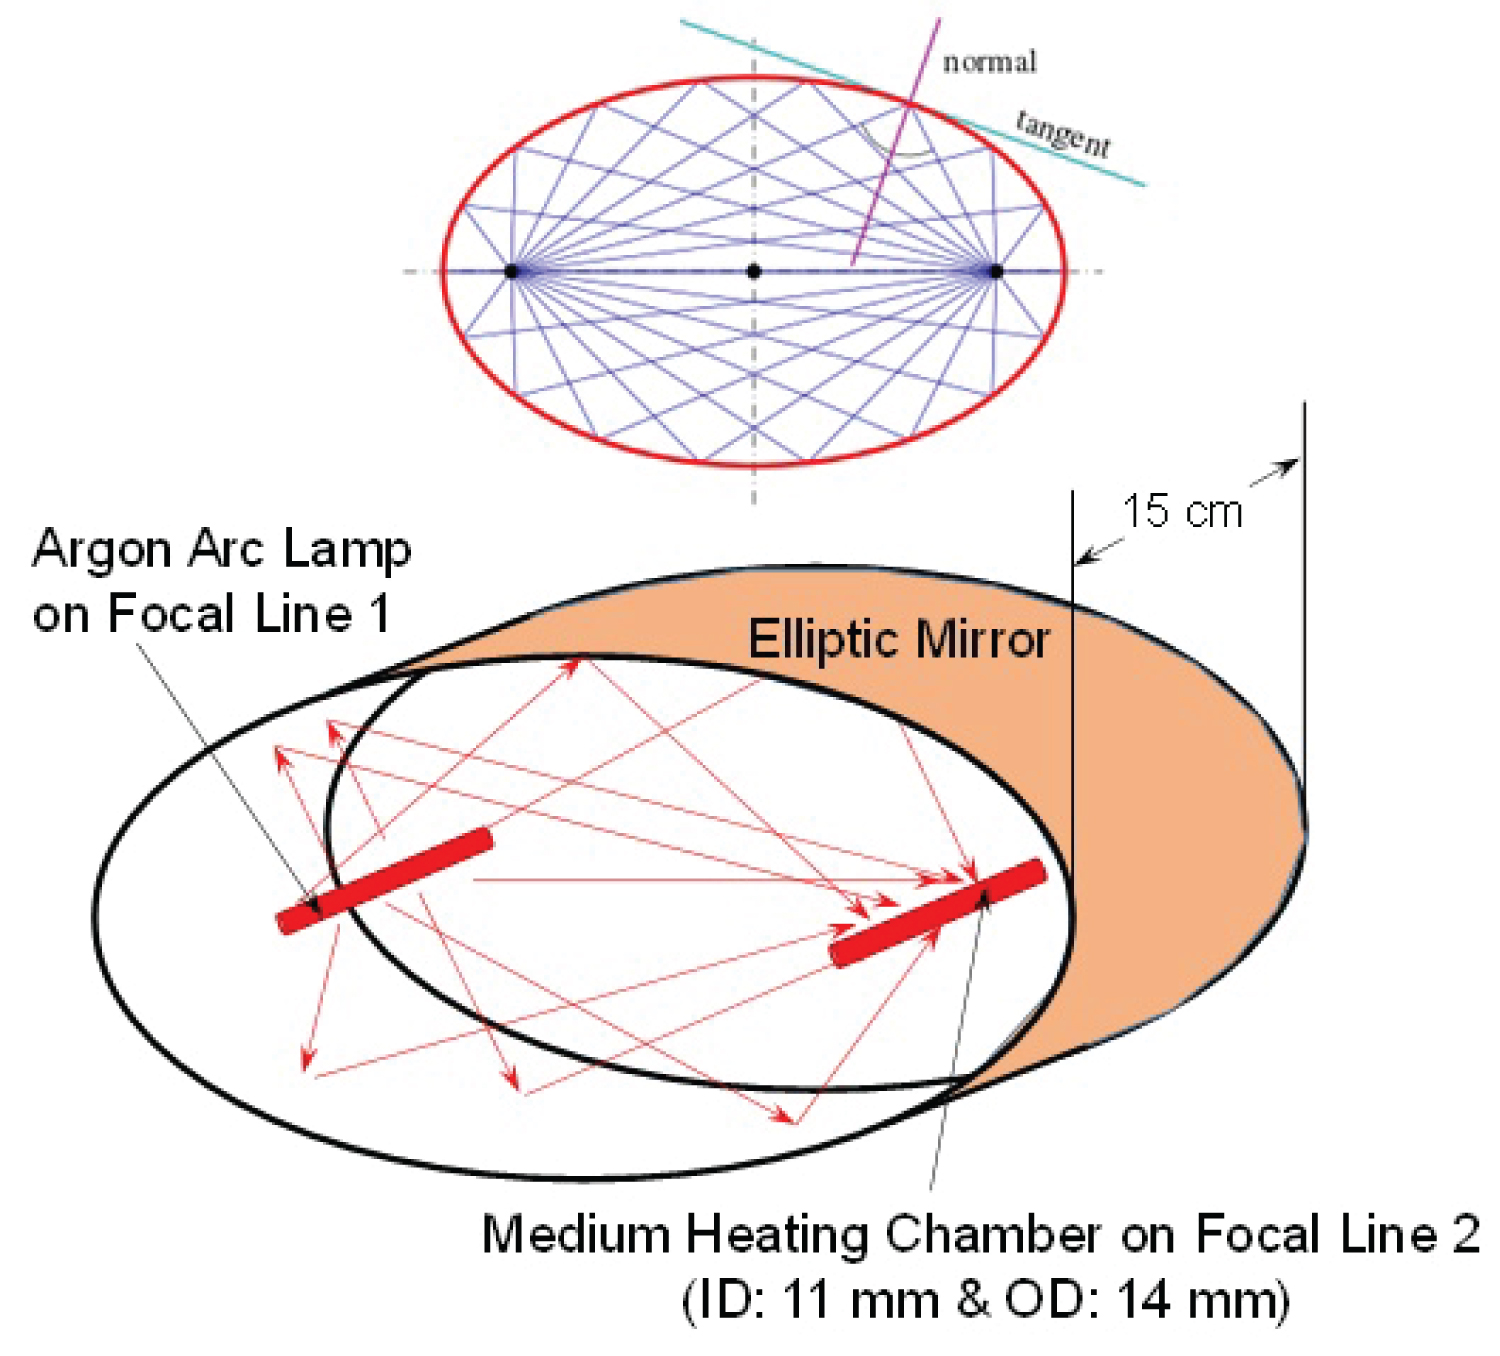
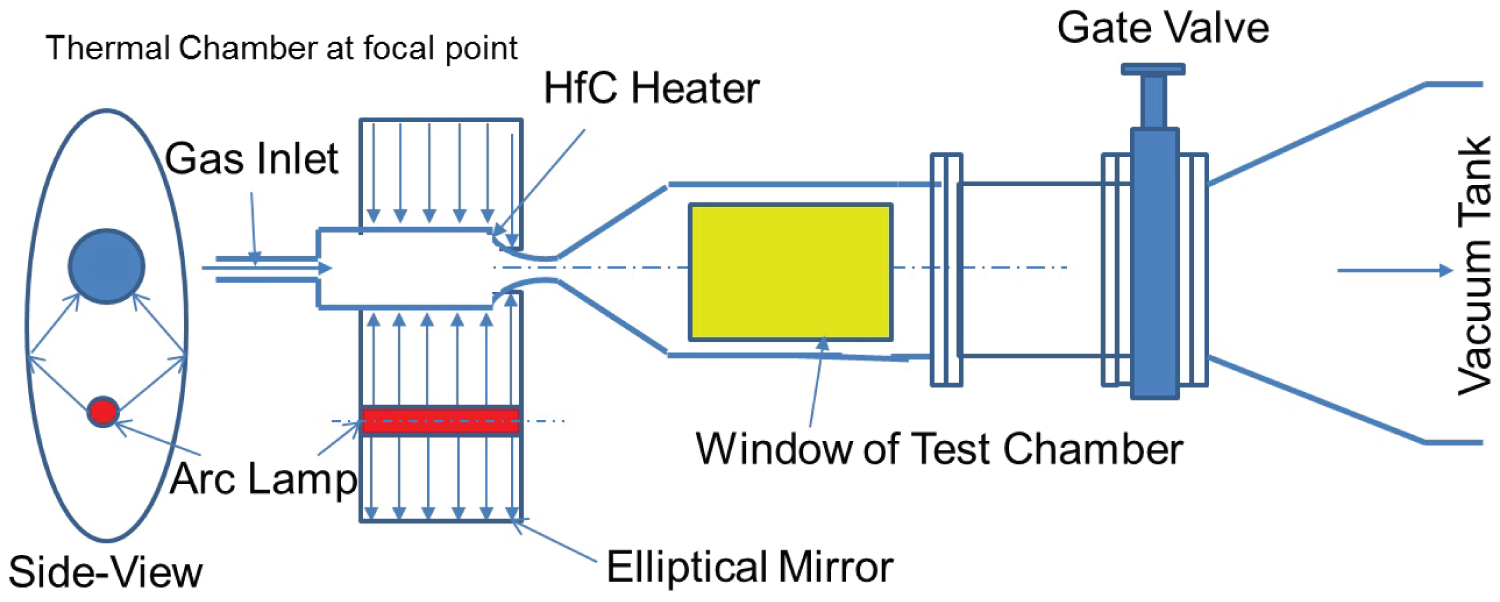
Ground testing facilities for hypersonic flow generator have been studied by several authors [22-24]. Most of the facilities for high stagnation temperature flows have commonly used the electric resistance heating methods but with the temperature limited to around 2000 K due to the melting point of heating element as primary heat source. An arc heating is able to contribute higher temperatures than 2000 K, however, it introduces not only the impurity originated from eroded heating elements but also radical species to the flow. Therefore, the flow generated by arc heating is not regarded as clean as the other methods. On the other hand, the HFG facility uses uniquely an optical power to heat the working medium beyond the limits of other heating methods and to minimize the introduction of impurity. The optical heating method of HFG was designed to provide air stagnation temperatures up to 3500 K. The maximum optical power for the arc lamps is 90 kW, however it operates in the range of 60 kW. An elliptical reflector conduit is placed to collect the optical power from the argon arc lamp that emanates the maximum 90 kW optical power is located on one of the foci and concentrate the collected optical power on the thermal chamber located at the other focal line. The length of arc lamp is approximately 15 cm. The optical flux couples with an elliptical mirror as shown in Figure 8. The estimated optical coupling coefficient of the elliptical mirror is 0.4 which indicates the overall thermal loading by optical power onto the thermal chamber. The outside diameter (OD) of the thermal chamber was determined approximately 14 mm which is close to the diameter of the arc volume (11 mm dia.) based on the geometrical ray tracing analysis. Therefore, thermal flux on the surface of thermal chamber is going to be as 358 kW/cm2.
The diameter of thermal chamber is restricted to be no more or no less than 14 mm by the geometrical image formed from a light source and an elliptical mirror. If the diameter of thermal chamber is too small as compared to the diameter of arc volume, some of reflected lights may miss arriving on the surface of the chamber, total irradiance will be reduced as a result. In the case of larger diameter of thermal chamber than that of the arc volume, the total irradiance on the surface will again be small due to the reduced flux density on the larger area. Since the thermal loading method is instantaneous by argon plasma arc, the thermal chamber should be prepared with the following properties: high melting point of chamber material, high thermal conductivity, endurance over thermal shock cycle, high strength, and lower thermal expansion rate. Some candidate materials are listed in Table 2. Among them, tungsten material is selected as a first choice because of the highest melting point.
The equilibrium temperature on the tungsten surface can be stated as:
(Optical energy absorbed = Radiation emitted + Convection loss to gas + Conduction through nozzle).
Where, α = absorptivity of heating chamber surface
σ = Stefan-Boltzmann constant
Ts = heating chamber surface temperature
ε = emissivity of heating chamber surface
h = heat transfer coefficient
k = thermal conductivity
If there are no losses due to convection and conduction, the equation becomes a simple as
Substituting the numerical values, q = 5.37 × 10⁶ W/cm2 and ε ~ 0.3, the maximum surface temperature could be approximately 4,371 K with 60% of optical coupling from the elliptical mirror. Considering the losses due to conduction and convection, we need to solve the equation (4) with appropriate values. To determine heat transfer coefficient h, let us assume nozzle has a constant heating rate. The Reynolds number is
where, ρ and μ are determined from the CEA program and is determined from a continuity equation with the velocity of 945.3 m/sec at the throat of the nozzle calculated by the CEA program. Therefore, the velocity at the chamber will be calculated as
With v1 = 9.45 cm/sec, the result indicates the flow inside tube is laminar.
where K = thermal conductivity of working gas
D = the diameter of nozzle.
Therefore, thermal transfer coefficient, h, will be 67.55 W/m2 K. For the calculation of K and ε at high temperatures of the tungsten tube, the values are extrapolated with the existing information [25,26]. The absorptivity α is obtained from the reference [27] to be 0.51. By a try and error method, the surface temperature using equation (5) is calculated as 3,690 K. From this result, the reduction in the surface temperature is 681 K due to the loss mechanisms as described above.
The thickness of thermal chamber is determined by considering not only structure safety related to the pressurization of working medium in the chamber, but also thermal loading effectiveness which is related to the thermal characteristic length of the chamber material. Therefore, a selection of material's thickness for the nozzle is also important factor. Using the differential equation for unidirectional heat flow in cylindrical co-ordinates for steady state, the heat flux can be written as
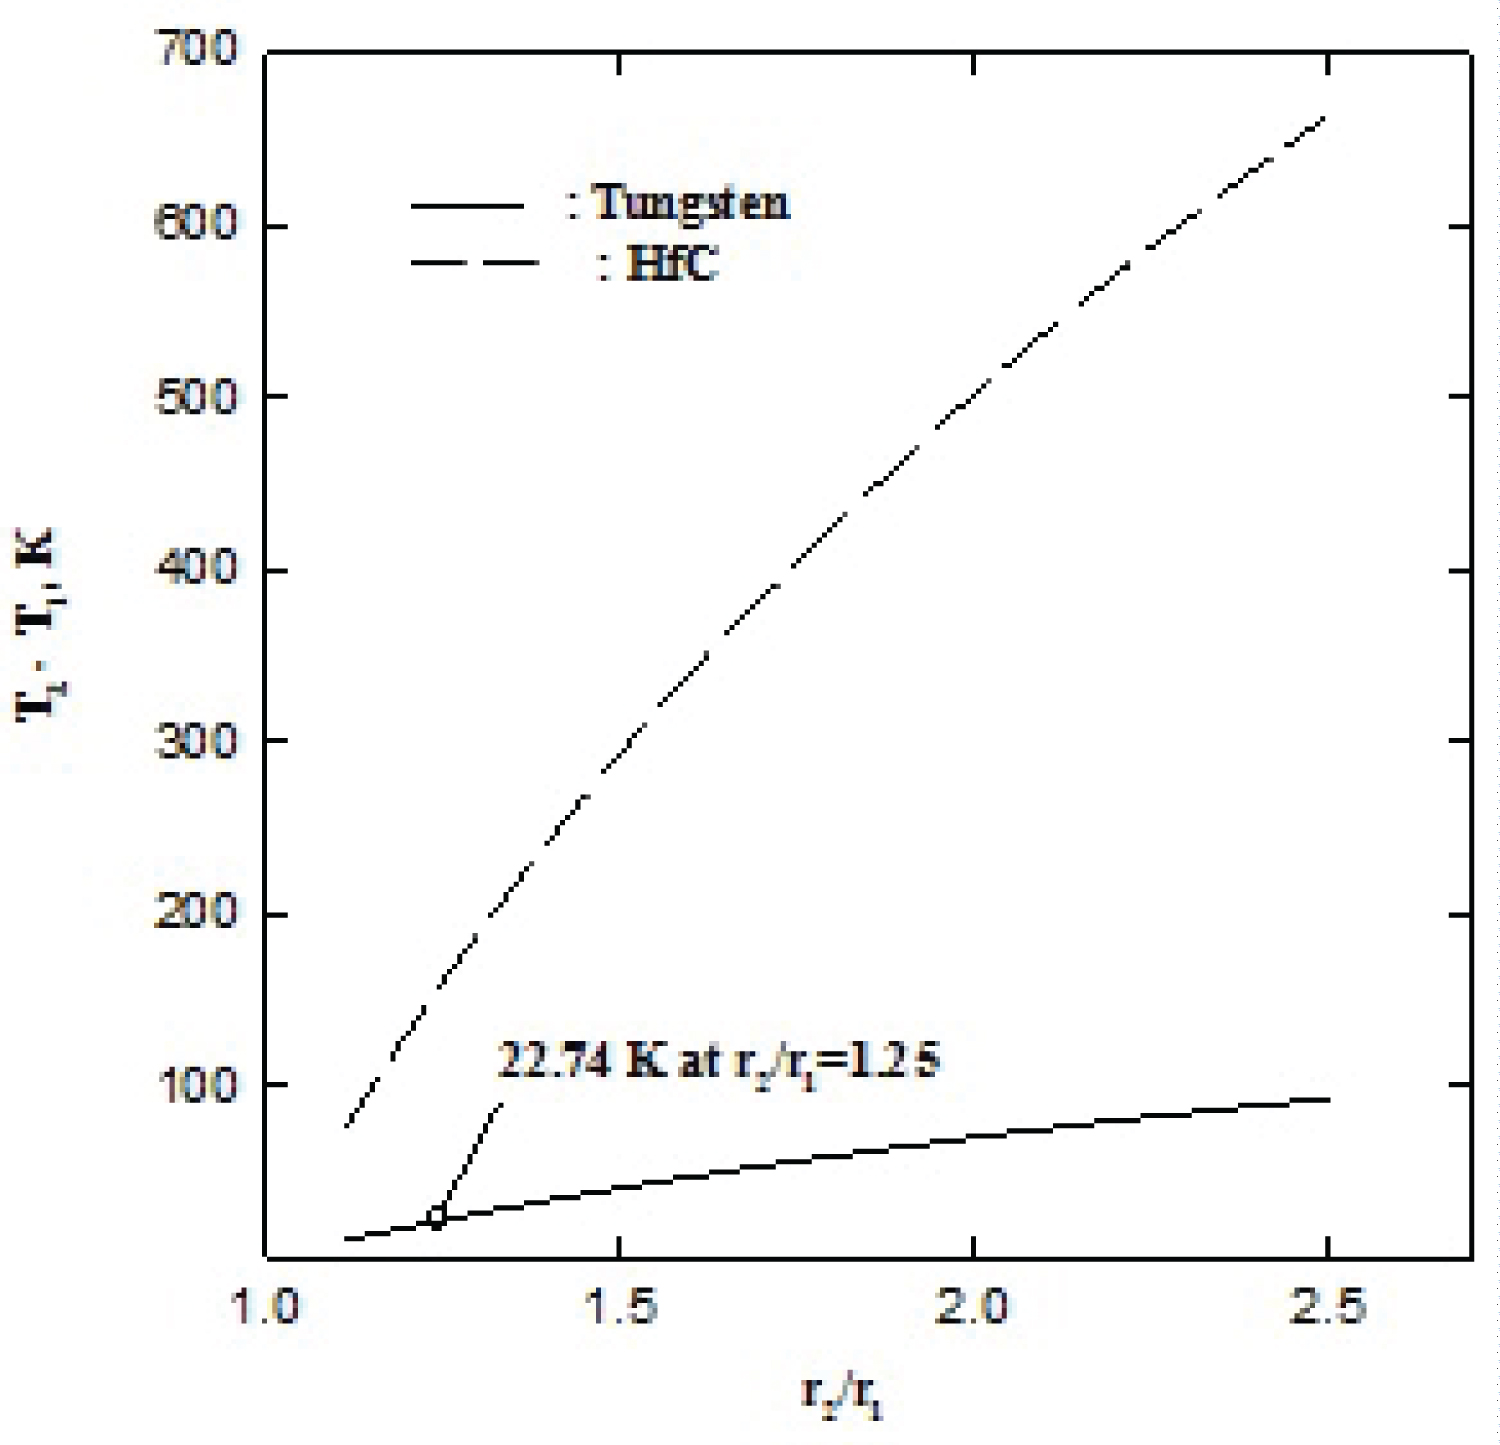
Using the equation (10), the temperature differences are plotted at various radii for tungsten and HfC in Figure 9. The time required to reach an equilibrium temperature of thermal loading chamber at stagnant condition is determined by thermal loading rate. The instant heat loss from the thermal chamber by forced convection should be same as the instantaneous change of heat energy of the chamber material as,
Where, V = the volume of the thermal chamber
A = surface area of the chamber
T = the instantaneous surface temperature of the chamber
The above equation (11) can also be written as
Integrating the equation in the limit of T1 to T2
Using the equation with T1 = 3,300 K, T2 (mean temperature) = 1,788 K, the time constant, t is obtained as 0.118 sec. The velocity of the gas through the nozzle throat with 1 mm diameter is approximately 9 m/sec. Within 0.118 second to raise the chamber temperature to 3,300 K level, the length of thermal loading chamber should be greater than 1 meter in order to transfer sufficient thermal energy to the center of gas flow. However, this calculation is only valid for the initial state when both the chamber and gas need to be heated to the operational level temperature, 3,300 K. Otherwise, for a steady state operation, a compensatory thermal loading to make up the temperature drop by 681 K due to both the radiative loss from the surface of gas chamber and the energy carried by working gas.
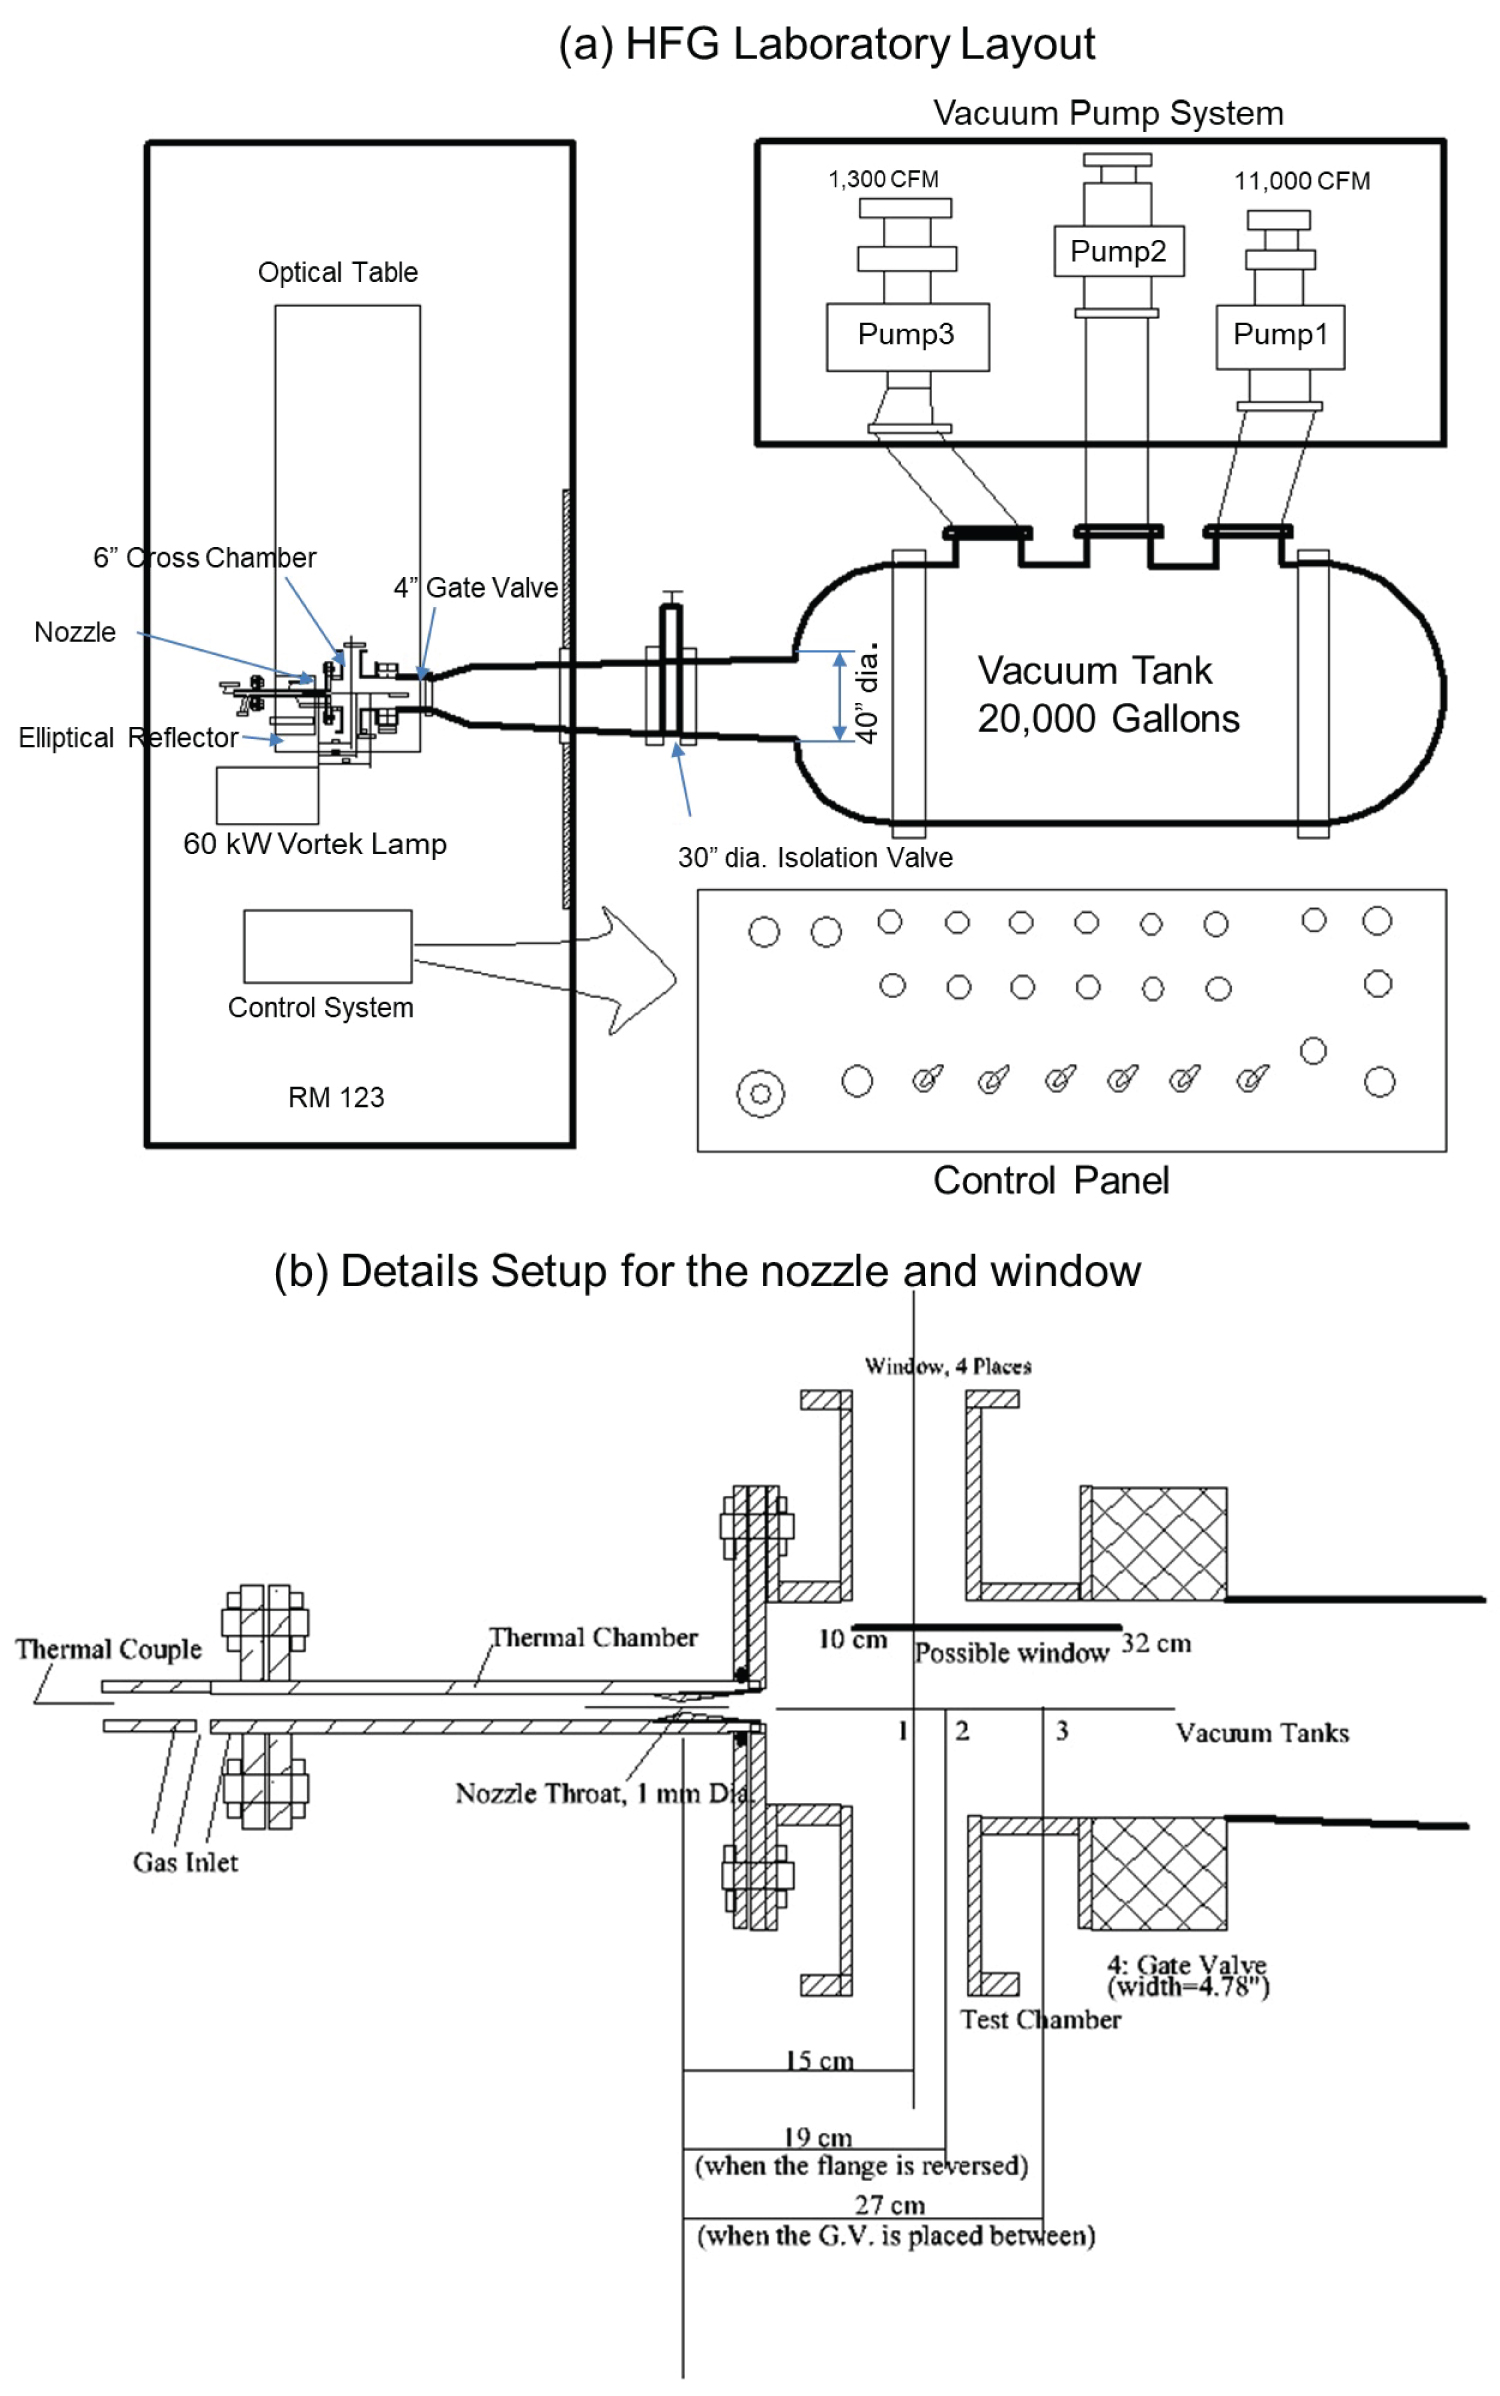
System configuration
A unique, clean-gas hypersonic flow generator (HFG) was designed to provide maximum stagnation temperature up to 3,500 K and at least 28 sec run time. Under these conditions, the HFG generates 2.45 km/sec flow velocity at nozzle exit by the optical heating as shown in Figure 10. The system consists of six major parts, such as one Vortek arc lamp as an energy source, a thermal chamber, an expansion nozzle, a test section, a vacuum chamber with a vacuum pumping system, control and diagnostics system as shown in Figure 10.
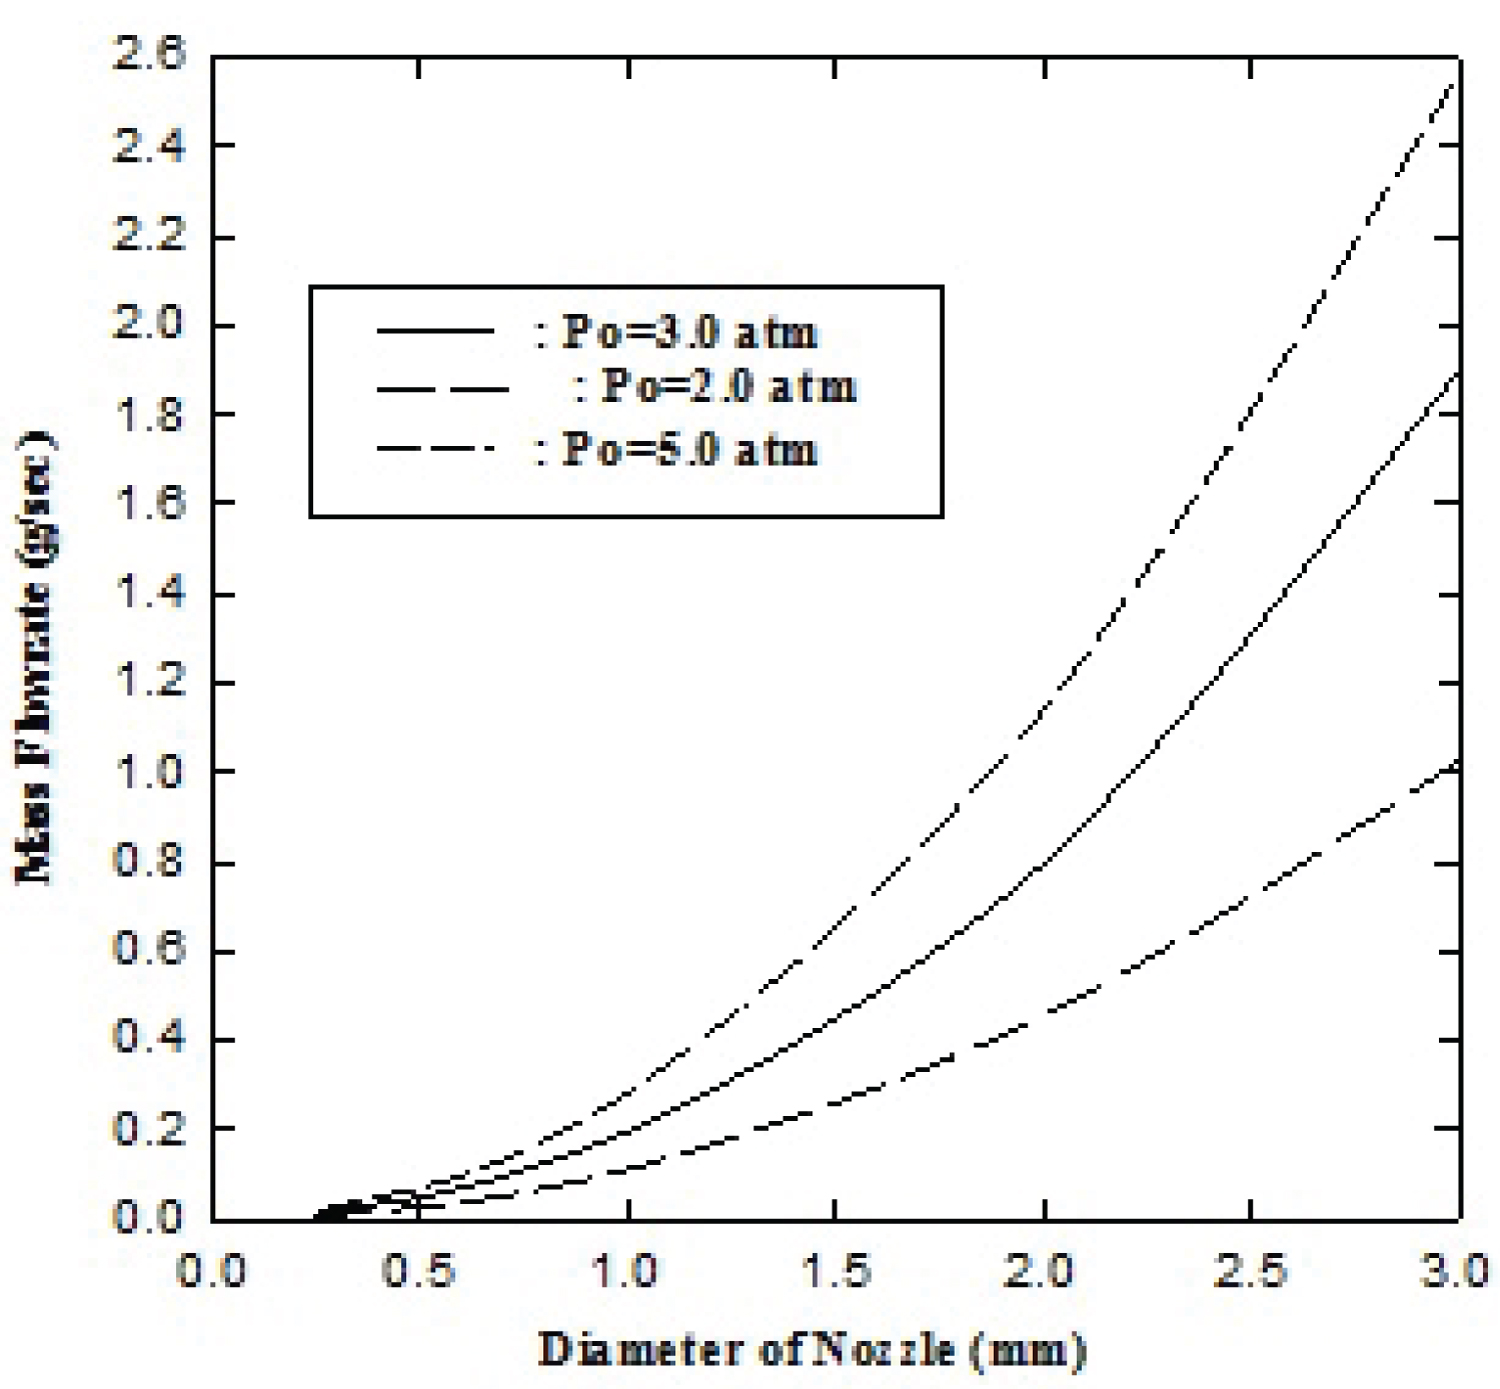
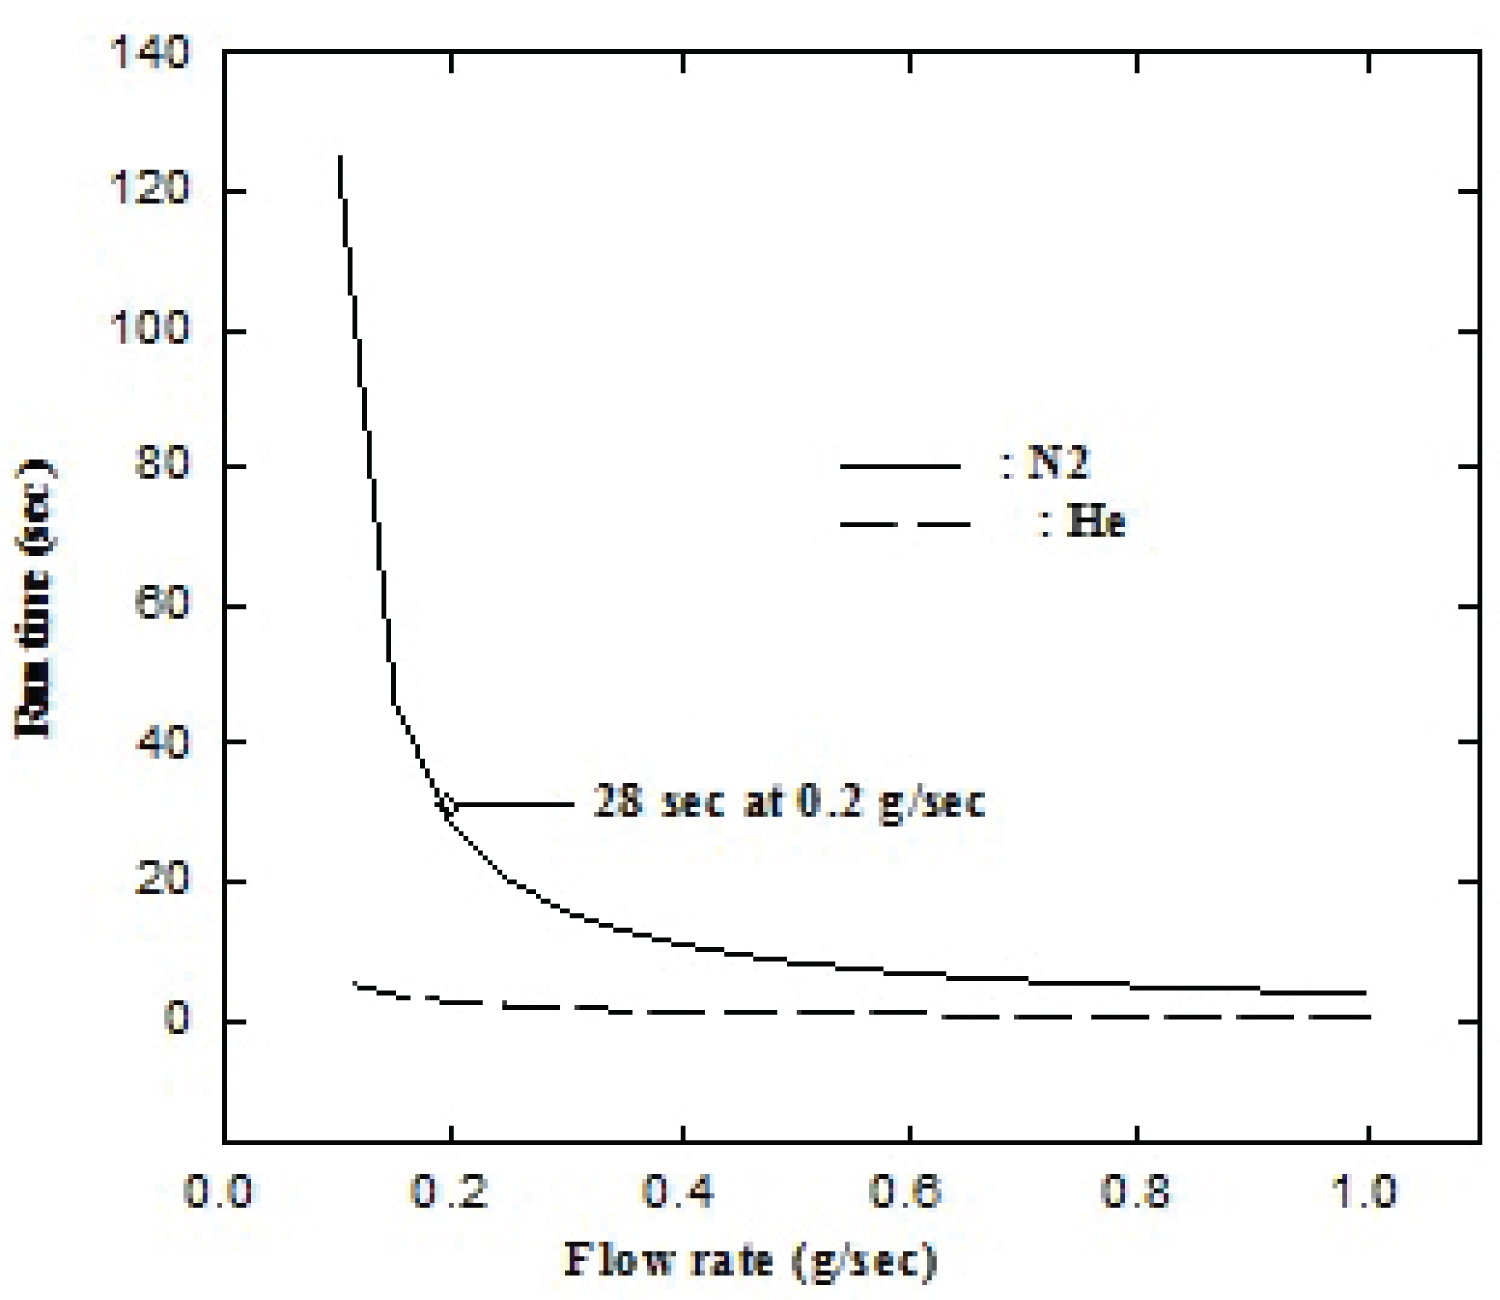
The mass flow rate of nitrogen at various initial pressures is calculated and plotted in terms of the diameters of nozzle in Figure 11. At 1 mm diameter of nozzle throat, the mass flow rate is approximately 0.2 g/sec at the initial pressure of 3.0 atm. With the mass flow rate of 0.2 g/sec for nitrogen, the run time is calculated and plotted from 10 mtorr to 40 mtorr with 10,000 CFM pump in Figure 12 As indicated in Figure 12 the run time of the system is approximately 28 sec at 0.2 g/sec mass flow rate.
Operational procedures
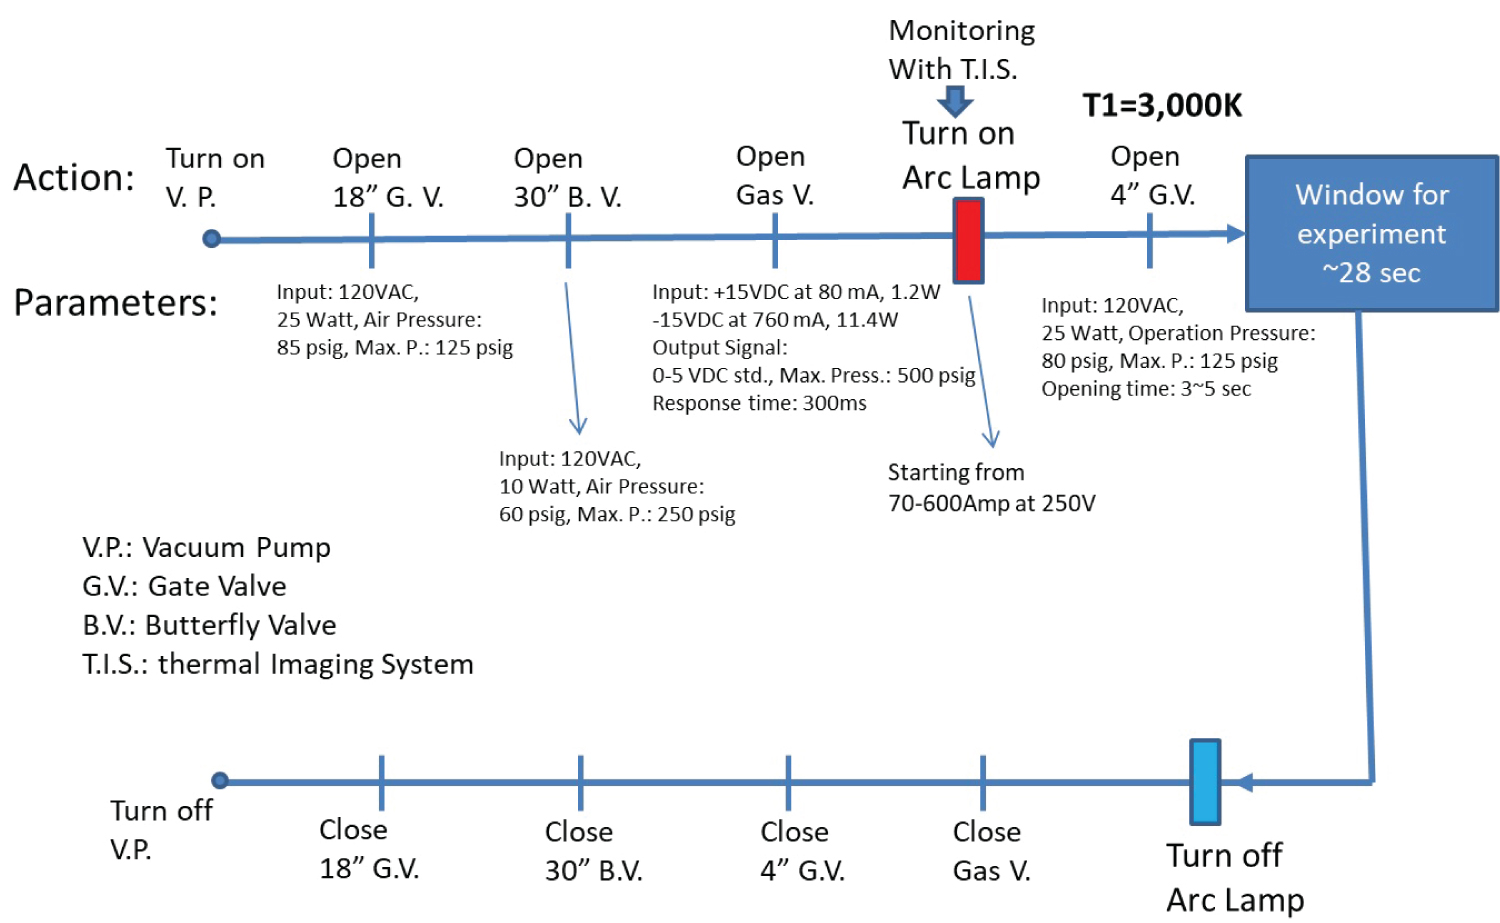
The operation parameters of the HFG system are listed in Table 3. The HFG system, in general, requires a serial mode control of components and equipment in operation. Figure 13 illustrates the operational sequence and time events for the HFG operation. In operation, the pumping-down time to reach a desired vacuum pressure (10 mTorr) at the downstream to an 80 m3 vacuum tank takes a long time as compared to other sequences. Accordingly, the pumping-down time will determine the test occurrence rate. In the system operation, a computer-controlled operation of the HFG facility was implemented using Viewdac software and A/D conversion process in an automated mode. However, certain components of the HFG system are in a stand-alone mode controlled manually. The main vacuum pump station runs autonomously to keep the vacuum tank pressure down to 10 mTorr. For the test readiness, the 4-inch gate valve between the vacuum tank and the test section and the flow regulator that feeds a working medium into the heating chamber are kept closed until the temperature of working medium reaches a desired level. View dac software is then used to empty the nozzle by opening the 4-inch gate valve for 10 seconds. The 4-inch gate valve is closed again, and the vacuum tank is pumped back down to 10 mTorr. View dac enables the Vortek Arc lamp [28] interlock, and the Vortek is turned on using different computer software. At this point, View dac begins to plot the temperature and pressure in the vacuum tank. When the gas temperature reaches 3000 K, the 4-inch gate valve is opened. About 1 mili-second later, the tank pressure reaches a predetermined value, at which the flow regulator valve is opened. This flow is kept continued until the tank pressure reaches 40 mTorr, at which Viewdac disables the Vortek interlock. Flow continues for another minute (to cool the heating chamber and nozzle) before the flow regulator is closed. After another 5 minutes, the 4-inch gate valve is closed.
Characterizations of Hypersonic and Low-Density Flow
Since the HFG was designed to simulate re-entry vehicle from space at the altitude of 60-90 Km, the system parameters are selected to satisfy the conditions of reentry flight corridor (see Table 3). At the reentry flight corridor where the atmospheric pressure is very low, the mean free path of the air particles is long. Therefore, the flow becomes slip and nearly in a free molecular regimes of the flow field at the test section are characterized by the probes and methods of flow visualization for low density flows (~100 mTorr) of high temperature and high Mach number. Also, several methods developed by others [29-31] for these specific subjects are selected for study and analyzed to correlate them for parametric dimensions, configurations of probes for the HFG experiment in NASA Langley as well as a method of the flow visualization.
Flow Visualization
For accurate rendition of flow-field at test section, the method of visualization with little effect on the flow-field or flow stream was introduced. In hypersonic flow, the gas density becomes rarefied with increasing flow velocity. Therefore, with the reduced number of molecules in the rarefied flow-field, the sensitivity of the optical coupling is diminished to a very low level. Since for low-density flows, the conventional Schlieren or shadowgraph method is not suitable. A comparison between the theoretical and experimental investigations on the limits of visualization with an optical path of 1 cm was made by R. A. Evans [32].
The superimposing two phase-contrast imaging method is useful to visualize weak density differences. Veret made a calculation in order to demonstrate that the phase contrast method (PCM) would allow operation at altitude of 84 km, when two PCMs are superimposed [33]. For the experiment, Veret demonstrated to visualize the air flow density of 7 × 10⁻⁷ g/cm3 and Mach number of 8.2. Without a specimen in flow, the density gradient along the axis and the radial direction should be lowered. Therefore, these methods need to examine carefully whether they are suitable to visualize in low-density gradient flow. For an indirect visualized method, the information of light, which has transversed through a transparent flow, gives a flow pattern along the radial distribution as well as axis distribution. This method can be applied to Mach-Zehner Interferograms equation which shows the density gradient along the radial direction with the measured distribution function by this method. For flow visualization of HFG, a Schileren method is applied at various conditions as shown in Figure 14.
Flow Characteristics of HFG, NASA Langley
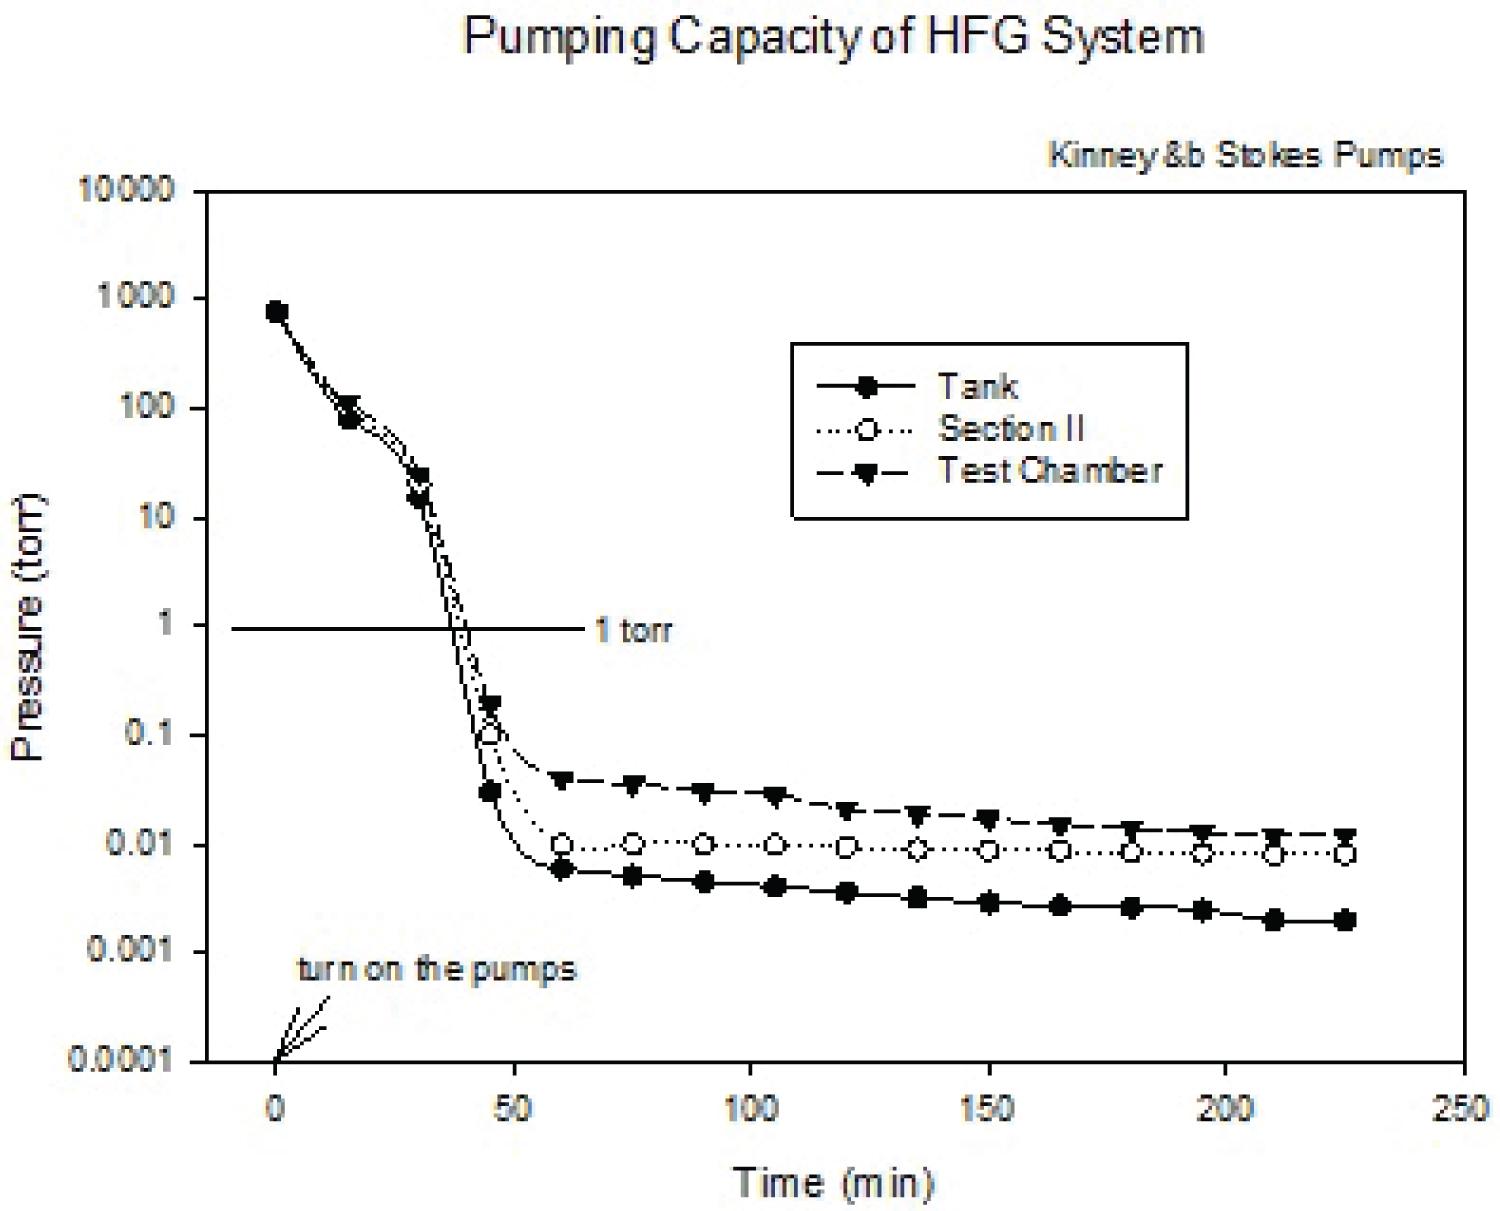
The overall layout of the vacuum tank is shown in Figure 15. The total volume of the tank is 80 m3. The tank was originally designed to have three 10,000 CFM capacity vacuum pumping systems. However, one new Kinney vacuum pump (#1) provides 11,000 CFM, and a Stokes pump (#2) gives system with an additional 10, 000 CFM pumping speed at 1 mtorr pressure. The vacuum pressure of vacuum tank is kept at 10 mtorr as designed for the HFG flow field. Then test is terminated when the tank pressure rises to 40 mtorr. The sectional view of the detail test chamber with the probe window is shown in Figure 15b. As shown in Figure 15b, the maximum flow velocity is around or at 7" (~18 cm) from the nozzle throat where the flow field is observable through the window. while the vacuum system is running, the vacuum pressures are measured at the tanks, section II (from 4 "gate valve to 30" isolation valve) and the test chamber as shown in Figure 16. The vacuum pressure drops 1 torr within 30 minutes with two running vacuum pumps and reaches to 8 micro torr at the chamber pressure within an hour, while the tank pressure keeps at 0.07 micro torr. The leak rate of the system measured as 0.02 micro torr/min. To check the flow performance of the system, a nozzle is designed and installed as shown in Figure 15b. The size of the nozzle throat is designed and installed as 1, 3, and 5 mm in diameters in order to measure the pumping capacity.
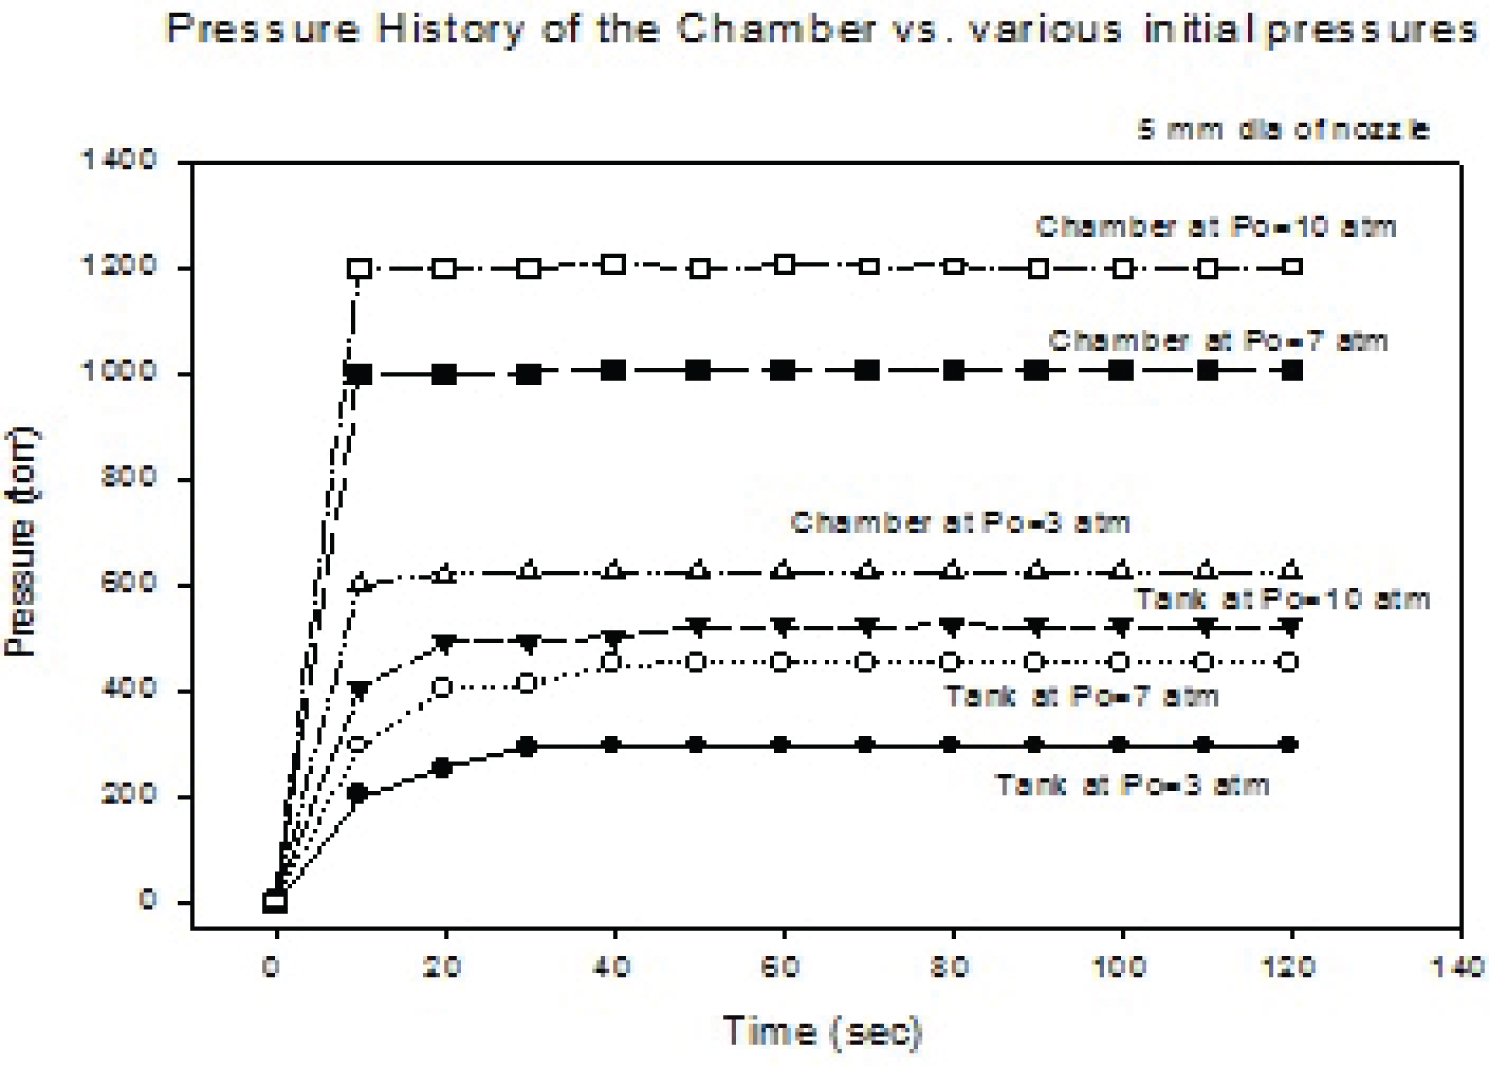
In Figure 16 and Figure 17, the pressures at three sections as test chamber, the medium chamber (section II) and vacuum tank are shown as function of the stagnation pressure. As the stagnation pressure is increased, the maximum (reach to the constant) pressure is increased. With the 5 mm diameter of the nozzle throat, the pressures at the chamber as well as at the tank are measured as shown in Figure 17. With a stagnation pressure of 10 atm, the pressure at the chamber reaches 1.2 torr and keeps the pressure approximately within 7 seconds. The chamber pressure decreased 0.6 torr at the stagnation pressure of 3 atm and it is remained as shown in Figure 17.
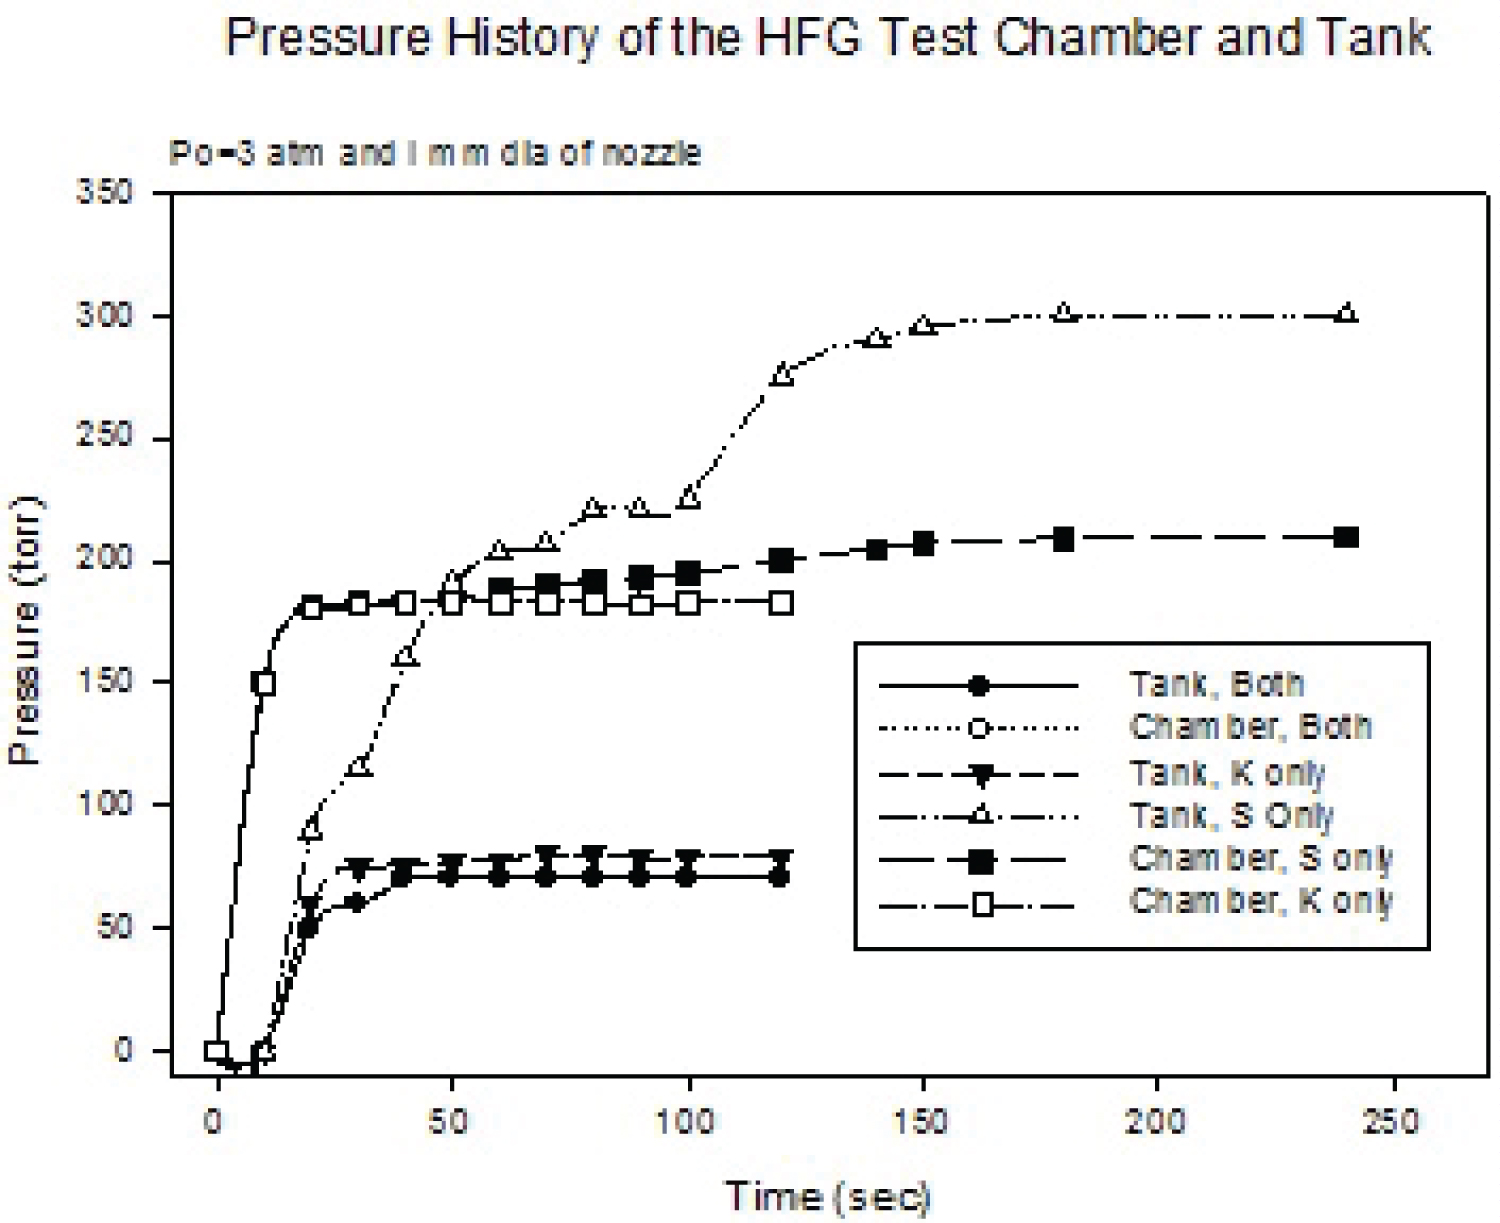
At the stagnation pressure of 3 atm, the maximum flow intensity is approximately 3.2 cm from the throat. To get a maximum intensity of flow at 10 cm distance from the nozzle throat, the required stagnation pressure is about 28 atm. With the 1 mm diameter of the nozzle throat, the pressure history at chamber and tank is measured in terms of the changing vacuum pumps, such as Kinney pump only, Stokes only and both pumps used as shown in Figure 18. The figure shows the difference of the pumping capacity for the two pumps. The pressure at the chamber reaches 180 torr within 10 seconds and keeps the constant pressure with both pumps. Even though the pumping capacitances of Stokes and Kinney are similar, however, the Kinney pump shows the better performance. With an additional pump (#3), it could improve to control the pressure of the chamber.
Based on this measurement, a continued operation of HFG is possible with 1 mm diameter of nozzle throat that could be used for study of shock waves. Therefore, this continues flow could be used for shock property such as density, temperature, cross section of gases, and relaxation time of certain gas molecules.
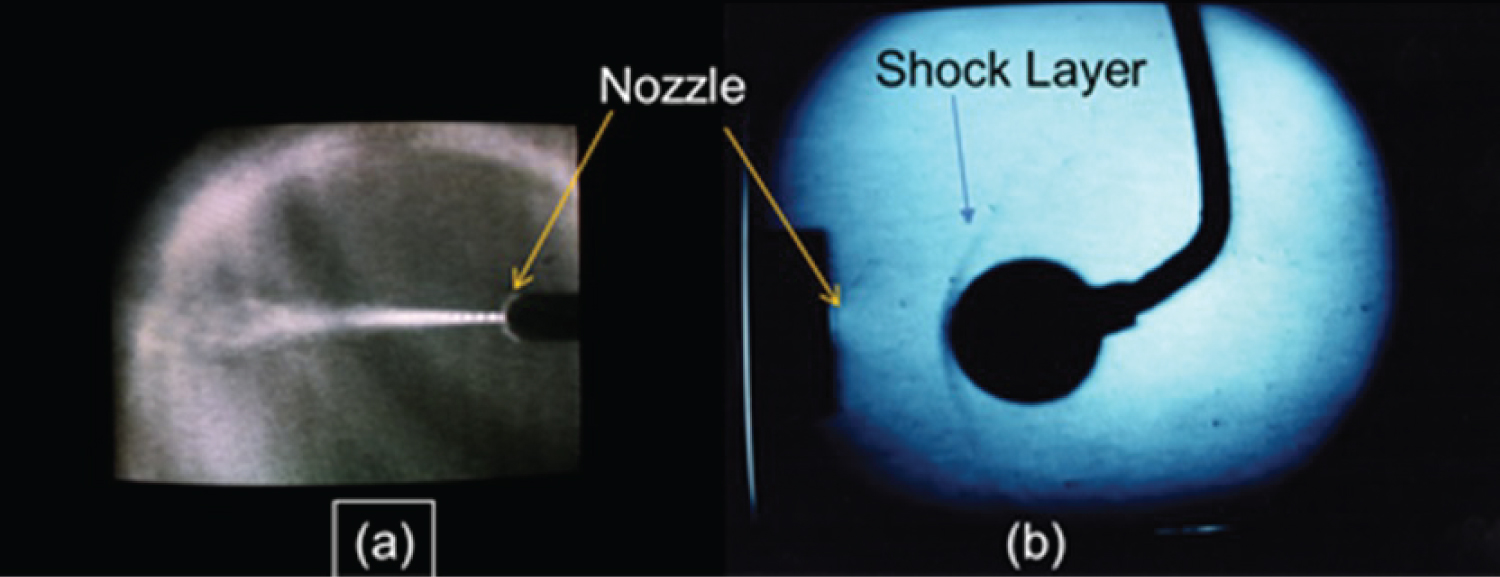
For flow visualization of the HFG, a focused Schlieren method is applied. At the 0.8 torr in the chamber pressure with 1 mm and 3 mm diameter of the nozzle throat, a barrel shock is observed at the 5 to 10 atm of stagnation pressure as shown in Figure 19a. With a 1.2-cm sphere obstacle I the flow, a bow shock was formed on the sphere with the schlieren method as shown in Figure 19b. Applying a heating method to HFG system and design of a proper nozzle will be next step to complete the system. In the installation of the new solar simulator to the present HFG system, the following parameters of the flow may help to upgrade the flow velocity. The thermal chamber can be designed for temperature of 2666 K at the exit of the chamber in order to produce as a designed flow velocity.
Conclusions
A HFG facility for a hypersonic wind tunnel application was designed with the optically heated chamber to raise the medium temperature beyond 3000 K. The installed HFG system at NASA Langley research center is able to generate hypersonic/hypervelocity flow with reasonably long dwell time for test. An investigation of fundamental aerothermodynamic properties for hypersonic/hypervelocity flow through the nozzle of the HFG was successfully performed with a simulated condition at the altitude of 60-90 km. The pumping system of HFG is capable to maintain 1 torr of pressure at the test chamber within 45min and maintained approximately 0.01 torr to generate a continuous flow with a 1 mm dia nozzle. This could provide a continuous flow of approximately 2.45 km/sec for nitrogen gas at the test chamber. With a focused Schlieren flow visualization, a shock structure was visible for the verification. The experimental set up for HFG could be offered a capability to provide basic important physical parameters such as collision cross section of molecules, relaxation times, and transport coefficients for simulating the environment of 2.45 km/sec flow velocity.
Acknowledgement
The development of hypervelocity flow generator (HFG) was supported and carried out under the HFG Program at High Energy Science Branch of NASA Langley Research Center.
References
- Hicks JW (1993) Flight testing of air breathing hypersonic vehicles. NASA Technical Memorandum 4524.
- Chul P (1985) Non equilibrium air radiation (NEQAIR) program. NASA Ames Research Center, Moffet Field, CA, TM 86707.
- Laux C, Moreau S, Kruger C (1992) Experimental study and improved modeling of high temperature air radiation. AIAA 92-2969, 23rd plasma dynamics and lasers conference, Nashville, TN.
- Hiller R, Boyce RR, Creighton SA, et al. (2003) Development of some hypersonic benchmark flow using CFD and experiment. Shock Waves 13: 375-384.
- Salas MD (2007) A review of hypersonic aerodynamics, aerothermodynamics and plasma dynamics activities within NASA’s fundamental aeronautics program. AIAA 4264.
- Bertin JJ, Cummings RM (2006) Critical hypersonic aerothermodynamics phenomena. Annu Rev Fluid Mech 30: 129-157.
- Ivanovo MS, Gimelshein SF (1998) Computational hypersonic rarefied flows. Annu Rev Fluid Mech 30: 469-505.
- Trimmer LL, Cary A Jr, Voisinet R (1986) The optimum hypersonic wind tunnel. AIAA 86-0739.
- Donahue K, Reinecke W, Rossi D, et al. (1991) Aerothermodynamic radiation studies NASA-CR-185666.
- Dogra VD, Taylor JC, Robert E, et al. (2000) Simulations of gas cloud expansion using a multi-temperature gas dynamics model, Rarefied Gas Dynamics (RGD) 22nd International Symposium, Sydney, Australia 585: 9-14.
- Xu K, Liu H, Jiang J (2007) Multiple temperature kinetic model for continuum and near continuum flows. 45th AIAA Aerospace Sciences Meeting and Exhibit 8-117.
- Timmer LL, Aubery Cary Jr, Robert L Voisinet (1986) The optimum hypersonic wind tunnel. AIAA 14th Aerodynamic Testing Conference, West Palm Beach, Florida.
- Lu FK, Marren DE (2002) Advanced hypersonic test facilities progress in astronautics and aeronautics 198.
- Locht R, Schopman J, Wankenne H, et al. (1975) The dissociative ionization of nitrogen. Chemical Physics 7: 393-404.
- Reiser G, Habenicht W, Muller-Dethlefs K, et al. (1988) The ionization energy of nitric oxide. Chem Phys Lett 152: 119-123.
- Phelps AV, Greene Chris H, Burke JP Jr , et al. (2000) Collision cross sections for argon atoms with argon atoms for energy from 0.01 eV to 10 keV. J Phys B: At Mol Opt Phys 33: 2965-2981.
- Levinsky ES, Yoshihara H (2012) Rarefied hypersonic flow over a sphere ARS progress in astronautics and rocketry: Hypersonic Flow Research, Edition by F R Riddell, Academic Press Inc, New York 7.
- Kenneth J, Morgan (1990) A comparison of molecular vibration modeling for thermal non equilibrium airflow. Air Force Institute of Technology.
- Korte John J (1992) A CFD-based aerodynamic design procedure for hypersonic wind-tunnel nozzles, 70th AGARD Fluid Dynamics Panel Symposium 4-8.
- Korte J, Kumar A, Singh DJ, et al. (1992) Least-square/parabolized Navier-stokes procedure for optimizing hypersonic wind-tunnel nozzles J Propulsion and Power 8: 5.
- Korte J, Kumar A, Singh DJ, et al. (1992) CAN-DO, AFD-based aerothermodynamic nozzle design and optimization program for supersonic/hypersonic wind tunnels. AIAA 17th Aerospace Ground Testing Conference, AIAA-92-4009.
- Marren D, Lu F (2002) Advanced hypersonic test facilities. AIAA ISBN: 978-1-56347-542.
- Leslie JD, Marren DE (2009) Hypersonic test capabilities overview. AIAA 1702.
- Rogers RC, Capriotti DP, Guy RW (1998) Experimental supersonic combustion research at NASA Langley. AIAA 2506.
- Allen RD, Glasier LF, Jordan PL (2004) Spectral Emissivity, total emissivity, and thermal conductivity of molybdenum, tantalum, and tungsten above 2300° J Appl Physics 31: 8.
- Powell RW, Ho CY, Liley PE (1966) Thermal conductivity of selected materials. United States Department of Commerce.
- Vincenti W, Kruger C (1967) Introduction to physical gas dynamics 19: 95.
- Grover H, Dawson F, Camm D, et al. (2015) Modeling of a vortex water-wall argon arc lamp for rapid thermal annealing applications. IEEE Transactions on Industry Applications 51: 4817-4823.
- McDaniel JC, Baganoff DR, Byer (1982) Density measurement in compressible flows using off-resonant laser-induced fluorescence Phys Fluids 25: 1105.
- Rosa MD, Philippe LC, Arroyo MP, et al. (1992) CW laser strategies for simultaneous, multi-parameter measurements in high-speed gas flows, AIAA 92-3955, 17th Aerospace ground testing conference, Nashville, TN.
- Hartfield RJ, Hollo SD, McDaniel JC (1990) Planar temperature measurement in compressible flows using laser-induced iodine fluorescence. Optics Lett 16: 106-108.
- Evans RA (1954) A new method of flow visualization for low density wind. J Appl Phys
- Veret C (1970) Visualization a faible masse volumique, new experimental techniques in propulsion and energetics research, By Andrews and Surugue 257.
- Shaffer PTB (1964) Plenum press handbooks of high-temperature materials. (1st edn).
- Carlen JC (1993) Company Catalog, Sandvik Rhenium Alloys, Inc. Elyria, Ohio.
- Kangilaski M (1993) Company Catalog, Martia Marietta Space Power, San Jose, CA.
- Tuffias R (1993) Company Catalog, Ultramet Co, Pacoima, CA.
- Brown WF, Harold M, Ho CY (1992) DOD Aerospace structural metal handbook. CINDAS/Purdue University, 5.
- Kohl WH (1967) Handbook of materials and techniques for vacuum devices. Reinhold Publishing Co.
Corresponding Author
Kyo D Song, Professor, Norfolk State University, Norfolk, VA, USA
Copyright
© 2022 Song KD, et al. This is an open-access article distributed under the terms of the Creative Commons Attribution License, which permits unrestricted use, distribution, and reproduction in any medium, provided the original author and source are credited.