Aerodynamic Characteristics of the Blended-Wing-Body VTOL UAV
Abstract
The aerodynamic characteristics of blended-wing-body (BWB) unmanned aerial vehicle (UAV) with vertical takeoff and landing capabilities (VTOL) were investigated in the present study. A novel layout of the UAV enables hovering and VTOL capabilities like multi-copters and cruise flight efficiency similar to fixed-wing aircraft. The advantages of the BWB concept are the generation of the lift by the entire airframe and reduction of the form drag in the wing-body attachment. In addition, a system of four propellers is entirely submerged within the fuselage generating a major portion of the thrust force during VTOL phase of the flight. Two tilting propellers installed at the wingtips produce thrust forces during both horizontal flight and VTOL.
Wind tunnel experiments were performed on two BWB models with fore- and aft-body planform shapes. The results indicate a better stability and aerodynamic efficiency for long-range flights of the fore-body. The lift-to-drag ratio significantly decreases with a Reynolds number decrease.
Effects of ground proximity and interactions in the system of propellers were also studied. The thrust force was measured with different number of propellers running and varied heights above the ground. Results showed favorable ground effects and positive interactions of propellers in the system. Results show an increase of thrust due from both positive interactions of closely spaced propellers, and ground effects. This is attributed to a fountain effect, in which the propellers slipstreams’ interaction increases the pressure between the aircraft body and the ground.
Nomenclature
α: Angle of Attack [°]; D: Nominal Propeller Diameter [cm]; DD: Inner Diameter of Duct [cm]; DP: Diameter of Individual Propeller [cm]; CD: Drag Coefficient; CL: Lift Coefficient; CM: Pitching Moment Coefficient about Aerodynamic Center; CL/CD: Lift-to-drag Ratio; CT: Thrust Coefficient; H: Height of Rotor above the Ground; n: Rotor Spinning Rate, RPM/60 [rev/s] ; Re: Reynolds Number Corresponding to Mean Aerodynamic Chord; RPM: Revolutions Per Minute; Δ: Tip-to-blade Clearance [%]
Introduction
Unmanned aerial vehicles are effective platforms to carry sensors and cameras necessary for surveillance and reconnaissance missions. Relatively small size, low visual and noise signatures, and high maneuverability make them advantageous over manned aircraft. An added benefit is their low-cost manufacturing, maintenance, and storage.
The most challenging UAV missions contain requirements for a vertical takeoff and landing, hover, and long-range flight. However, the requirement for VTOL and the need for a long-range cruise are contradictory since VTOL relies on the propulsion only, while a long-range flight requires aerodynamic efficiency of the fixed wing. These conflicting requirements create challenges when designing effective aerial vehicles.
Reports [1-3] provide technical specifications of more than 200 aerial vehicles including those that are capable of vertical takeoff and landing. Since a lightweight craft is desired, only aircraft with a takeoff weight of 7-14 kg are looked at. From these previous projects, several concepts have been identified: Fixed-wing aircraft, helicopters, multi-rotor vehicles, and tilting ducted rotors.
The fixed-wing aircraft are capable of efficient level flight operations. Many of the vehicles are equipped with devices for assisted takeoff including hand or bungee launching.
Helicopters are another option, when it comes to meeting the requirements for unmanned missions. However, there are known drawbacks and limitations to this concept, including the complex designs of the mechanical linkages of the spinning blades. When compared to fixed-wing aircraft, the complete autonomous helicopter has a much higher price tag [4,5].
It appeared that scale effects of the electric propulsion efficiency are minor, so several small propellers may have about the same propulsion efficiency as a large one. The use of multiple rotors for UAVs has become increasingly popular due to their high maneuverability and reliable performance. Various radio-controlled multi-copters are currently available on the market, and their affordable price makes them desirable.
Aircraft with tilting rotors [6,7] present a workable solution for the reduction or elimination of negative effects of the other mentioned concepts. With the rotors and engines set vertically, the craft is capable of vertical takeoff and landing as seen with helicopters. Once the craft is airborne, the rotors are tilted for level horizontal flight. An example of this concept is the Phantom Swift VTOL UAV developed by Boeing [8] based on the Bell Boeing V-22 Osprey. The UAV Swift utilizes two downward facing fans embedded within the body, and large ducted propellers at the wing tips for VTOL.
In the previous study [9], several multi-rotor configurations were computationally modeled in hover and in edgewise flights at low Reynolds numbers. However, if a hover endurance is a primary design factor, then better understanding of propeller interactions and ground effects are needed for designing VTOL UAV.
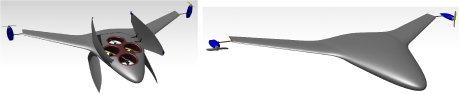
A novel UAV layout was proposed at the University of Arizona MAV laboratory in 2016-2018 [10,11] combining hovering and VTOL capabilities like multi-copters and the cruise flight efficiency similar to fixed-wing aircraft. The configurations of aircraft in hover and horizontal flight are shown in Figure 1. The specifications of the prototype, built in 2018, are given in Table 1. The aircraft has a blended-wing-body design with enhanced aerodynamic efficiency during cruising. A sweptback tailless configuration improves its performance in comparison to conventional fixed-wing aircraft with a tail. Two tilting rotors at the wingtips produce thrust forces in both vertical takeoff and landing and in cruise. There are four vertical lift propellers-motors submerged within the fuselage structure. They generate a thrust during VTOL phase of the flight and are covered by special doors in cruise allowing for a streamline body during forward flight.
A typical flight profile for this configuration would have the aircraft vertically takeoff. Then the aircraft will fly to a location, loiter, and then return and land in the same location. To achieve this, the aircraft needs to utilize the entire propulsion system consisting of four vertical lift-propellers-motors and two tilting wingtip propellers-motors. During takeoff, the duct doors are open, and the wing tip propellers are in a vertical position. Central propellers and wingtip propellers provide thrust for vertical takeoff, and once the aircraft is at distance off the ground, the wing tip propellers turn to a horizontal position for forward flight. During transition flight, the duct doors begin to close, and the central propellers switch off at cruising velocity. For hover or landing, the doors once again open and the central propellers turn on as the wing tip propellers turn to the vertical configuration.
The blended-wing-body is desirable aircraft geometry due to its favorable aerodynamic qualities. Traditional aircraft rely solely on the wings as the only source of lift, while the fuselage has no lift contribution. A notable feature of BWB configuration is the lift-generating fuselage, which is seamlessly blended with the body. Not only is the lift produced by the entire craft increased, the interference drag is reduced, which can lead to better fuel efficiency [12,13]. Even today with the abundance of knowledge regarding BWB aerodynamics, more research is needed, particularly in the area of planform optimization at Reynolds numbers pertinent to UAVs.
The use of the BWB for VTOL UAVs is also advantageous for housing a distributed propulsion system. Housing the propulsion system in the body helps to minimize the drag. Ducted propellers, or shrouded rotors, are commonly used due to their potential of improving the performance and efficiency. In comparison to an open rotor, a shrouded one can improve thrust up to 94% while maintaining the same power consumption [14]. An important parameter of ducted propellers is the propeller tip clearance with the duct. From experiments on ducted propellers, a clearance of 0.1-1.6% of the diameter leads to an increase in the thrust coefficient of about 20-94% when compared to an unshrouded rotor.
Distributed propulsion systems, especially in the case of VTOL aircraft, may pose problems near the ground. In the case of a free propeller close to the ground, there is a decrease in velocity due to the slipstream spreading out. This results in an increase in pressure that causes improvement in thrust. For ducted propellers, however, the ground effects are more complex. This is due to the blade angle being an important factor. Larger blade angles prompt higher disk loading, which in turn leads to a loss in thrust. Lower blade angles generate favorable ground effects, but a loss in hovering efficiency [15].
There are similar issues involving the propellers being embedded within an airframe. With a single propeller, the slipstream from the propeller hits the ground and accelerates outwards. It increases slipstream velocity causing a decrease in static pressure, thus creating suction that keeps the craft down. More than one propulsion source produce slipstream interactions and fountains, increasing the static pressure under the craft [15].
Experimental Models and Methods
Wind tunnel testing of blended-wing-body models
Experiments were conducted in the recirculating wind tunnel located in the Aerospace and Mechanical Engineering Department at the University of Arizona. The test section is 0.9 m by 1.2 m, and the free stream velocity ranges from 0.3 to 83.8 m/s. The flow qualified at the speeds used in the present study has a turbulence level of 0.15% in the axial direction [16,17].
The models were connected to a five-component external balance, which measures the normal and axial forces, and pitch, roll, and yaw moments. For this study, only the normal and axial forces and the pitching moment were looked at. The balance pitch position is controlled with the Model Position System Data Acquisition and Control Software. The software has three modes: Flight plan, which is an automatic positioning of the model and data acquisition; manual mode, where the model is positioned and is acquired when prompted by user; and pendant mode [18]. For the purpose of this study, the flight plan mode was utilized. For this experiment, the pitch angles were set from 0° to 30° at increments of 2°. At each angle of attack, force and moment measurements are continuously taken until they reach a set convergence value of 2%. The maximum run time at each angle is 1.5 minutes, so if the values do not converge, the balance readings at the end of the run time are recorded. This is mainly an issue for low Reynolds number flows since the forces applied to the balance by the model are smaller than those at moderate to high Reynolds numbers.
On average, the length of time required to collect one set of data at a given velocity for angles of attack of 0° to 30° is about 20 minutes since the DAQ software was given a maximum time of 90 seconds to collect a single data point once a 2% convergence is obtained. When processing 10 sets of data for each velocity, it was observed that the values of CL at each angle of attack were decreasing for each run. To compensate for this drift, tare data was obtained before each run instead of using one set of tare data for 10 runs at each velocity.
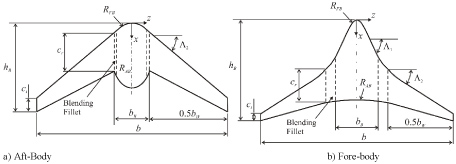
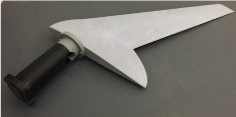
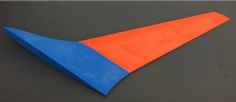
For the series of tests regarding the aerodynamics of the blended-wing-body experiments, two models were created, one with an aft-positioned body in respect to the wings, and the other being a fore-positioned body in respect to the wings. The fore-body wind tunnel model is geometrically similar to the VTOL UAV design presented in Figure 1 and is 1:1.5 scale. The aft-body model has the same wingspan, aspect ratio and planform area as the fore-body model. Figure 2 defines the necessary variables required for each model. The dimensions of each model are provided in Table 2. For both the fore- and aft-body models, the wing geometry defined by Cr, C¬t, and Λ2 are kept the same, as well as the planform areas of both models, S = 1,632.6 cm2. For both models, the wing utilizes an Eppler 330 airfoil while the airfoil body of the BWB models start as a NACA 0012 airfoil and transitions to the Eppler 330 to blend with the wing. Both the aft- and fore-body wind tunnel models are 3D printed with PLA plastic using a Makerbot Z18 printer with a 25% infill (Figure 3 and Figure 4).
Experimental setup for thrust investigation of ducted propellers inside airframe
Due to the close proximity of the the propellers to the ground during takeoff, ground effects need to be taken into consideration. Also, the fact that the central ducts are close together may cause interactions of slipstreams generated by propellers, when they are running simultaneously.
Four electric motors and ducted propellers were built-in the airframe. Two clockwise and two counterclockwise rotating GWS 5 × 4.3 (diameter 12.7 cm) propellers were used. Propeller diameter, DP duct inner diameter, DD, and tip-to-blade clearance, Δ, are given in Table 3. The propellers were driven by Tiger F40 2300Kv FPV Series brushless motors.
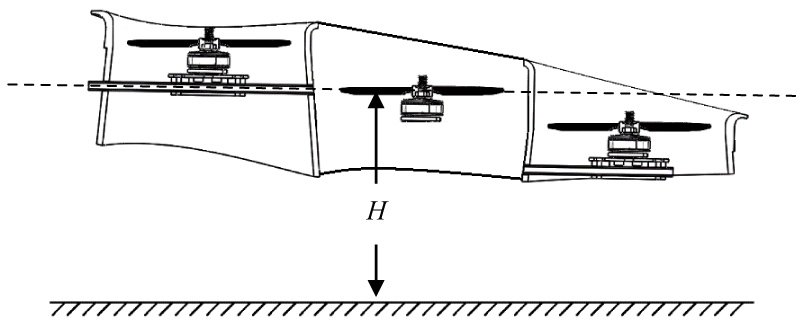
For the tests studying the effects of the ground on ducted propeller performance, the craft is positioned at various heights, H, given in terms of the nominal diameter of a propeller, D. The tests are done at 1D, 2D, and 3D. The height, H, is measured from the front motor mounting spar, which is in line with the propeller disks of the two middle motors (Figure 5). These disks are 18.8 mm lower than the front propeller and 10.0 mm above the rear propeller.
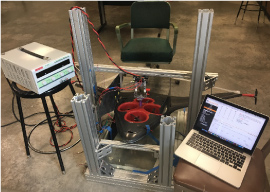
The 1580 series RCbenchmark thrust stand and dynamometer was utilized for force measurements and current readings. The RCbenchmark consists of 3 load cells necessary for measuring torque and thrust, and allows for ESC manual control [19]. The RPM data for each motor was obtained using the SHIMPO DT-2100 tachometer, and the power supply was a VOLTEQ HY3050EX. Figure 6 shows the test setup with the airframe suspended from the dynamometer. The height is adjusted by positioning the horizontal bar the RCbenchmark is attached to.
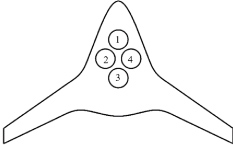
Using the RCbenchmark, the thrust from the motors are found at the three different heights and the thrust data is collected at increaments of 0.5 Amps supplied to the system up to 5-6 Amps. First, measurements are obtained for each individual motor at the three heights, then all four motors are connected in parallel, and the experiement is repeated once more. The motors are defined as motors 1-4, and their locations inside the UAV airframe are givien in Figure 7.
Aerodynamic Characteristics of BWB at Low-to-Moderate Reynolds Numbers
Conducting experiments on the fore- and aft-BWB models led to results of the axial and normal forces, and pitching moment applied to the balance. The axial and normal forces must be corrected in order to obtain the lift and drag forces on the model. The resulting L, D and M values are then non-dimensionalized by finding the aerodynamic coefficients
where the values of the mean aerodynamic chord, c, are 20.4 and 19.6 cm for the fore- and aft-body, respectively. The pitching moment was measured about the aerodynamic center in both fore- and aft-body models. These are located 50.8 and 40.5 cm relative to the model’s nose.
For the series of wind tunnel tests, each model was tested at 10, 20 and 30 m/s which correspond to Re of 1.18 × 10⁵, 2.4 × 10⁵, and 3.6 × 10⁵. The effects of increasing Reynolds number are being analyzed for each body type, as well as a side-by-side comparison done on both models at each Reynolds number.
Lift coefficient
From the axial and normal forces obtained from the wind tunnel tests for angles of attack of 0° to 30°, lift distribution curves can be plotted. From these plots, a comparison of the slope of the lift curve, , the stall angle, , the lift coefficient at zero angle of attack, and the maximum lift coefficient, , can be made to compare the performance of the aft- and fore-body models. The slopes for the lift curves are determined from 0° to 10° by using a linear regression analysis.
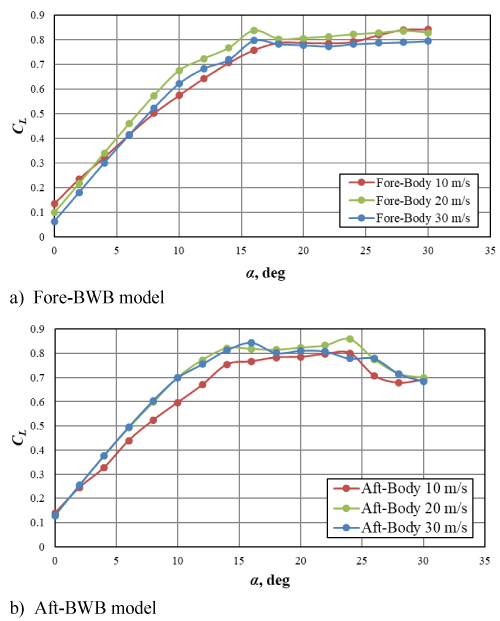
The effects of changing Re on each model is shown in Figure 8. In both models, the lift slope is larger at 20 and 30 m/s than 10 m/s and the CL values are higher compared to the 10 m/s case. However, CL values at an angle of attack of 0° are much higher for both fore- and aft-models at lower velocities than higher. At 20 and 30 m/s, the lift values of the fore-body model are higher at 20 than 30 m/s, but they are roughly the same for the aft-body model.
An intriguing feature of the lift curves of the fore-body model is that there is no typical stall behavior. In both the 20 and 30 m/s case, a local maximum is reached at 16°, but instead of seeing a decline in lift, the values remain fairly constant. At 10 m/s, this occurs at 18° where the lift slope is no longer linear. This is also seen for the aft-body model. At 10 and 20 m/s, the lift slope flattens out at 14°, and at 30 m/s it occurs at 16°. For both the fore- and aft-body models at 20 m/s, the lift curves have two local maxima denoted as and . These values, as well as other relevant coefficient data, are provided in Table 4.
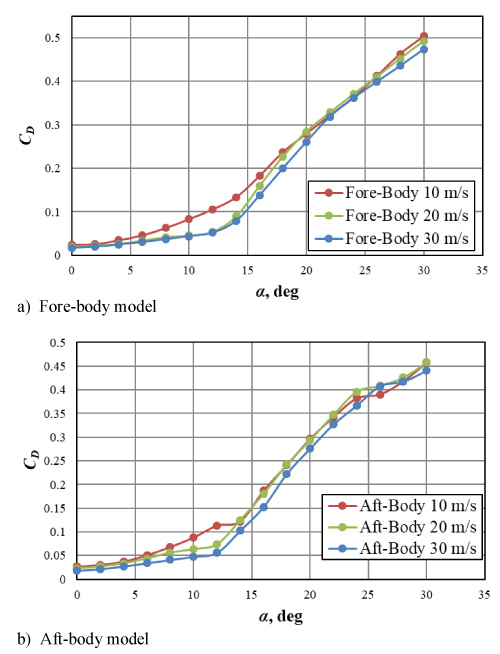
Drag coefficient
Drag is another important parameter, and unlike lift, where maximum values are considered, the points of minimum drag are of interest. A comparison of how each model performed at 10, 20 and 30 m/s are provided in Figure 9. In both the fore- and aft-body cases, the CD values at 10 m/s are higher than at the other speeds. The CD values at 20 and 30 m/s remain minimal from 0° to 14° before sharply increasing.
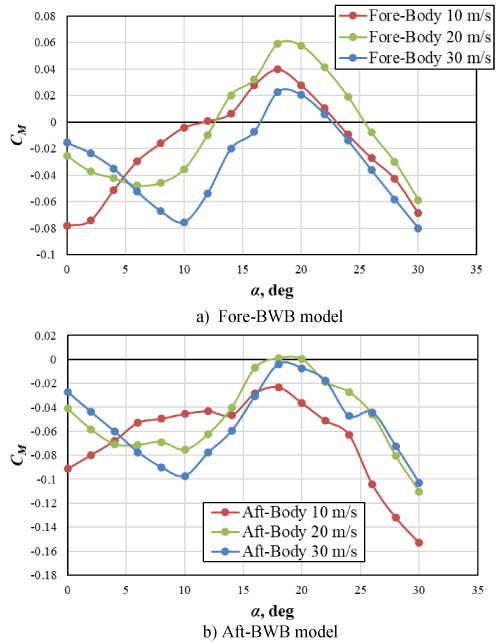
Stability and aerodynamic efficiency for long range flight
For a flying wing aircraft, particularly with a VTOL UAV, it is undesirable to have too much negative, or nose down, pitching moment about the aerodynamic center. Due to the lack of a tail, it becomes increasingly difficult to compensate for the downward pitch, making the craft unstable. The CM values of the BWB models are given in Figure 10 for 10, 20 and 30 m/s. The fore-body model has a region of positive moment from about 12° to 23° at 10 m/s, 13° to 25° at 20 m/s, and 16° to 23° at 30 m/s. As can be seen in Figure 10a), the pitching moment is just above or below zero. For the aft-body model, CM is mostly negative for all three speeds.
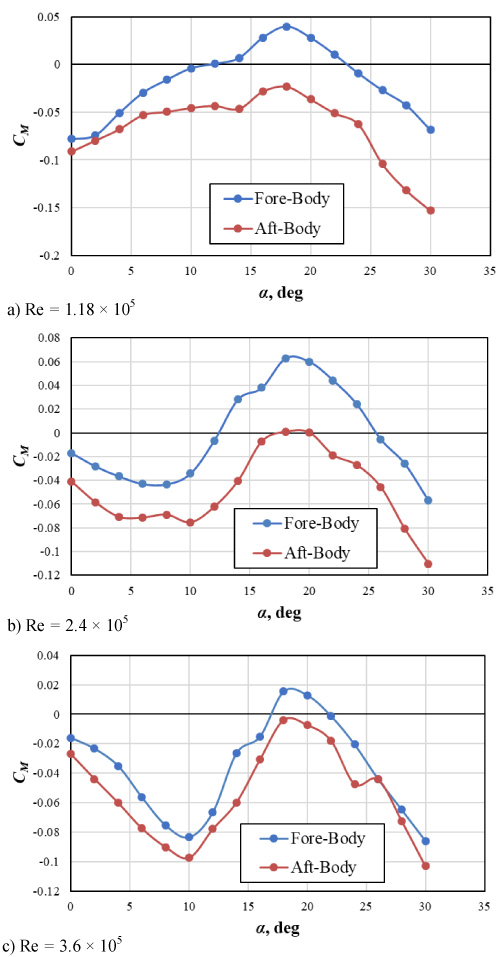
Figure 11 provide a side-by-side comparison of the pitching moments at each Reynolds number. As can be seen from the figures, the pitching moments of the aft-body are consistently negative. From a stability viewpoint, the fore-body configuration is advantageous, as expected. Since the moment arm from the elevon control surface to the center of gravity of the UAV is usually relatively short, the elevon cannot compensate for the nose down tendency unless excessive, drag-producing elevon deflection is used.
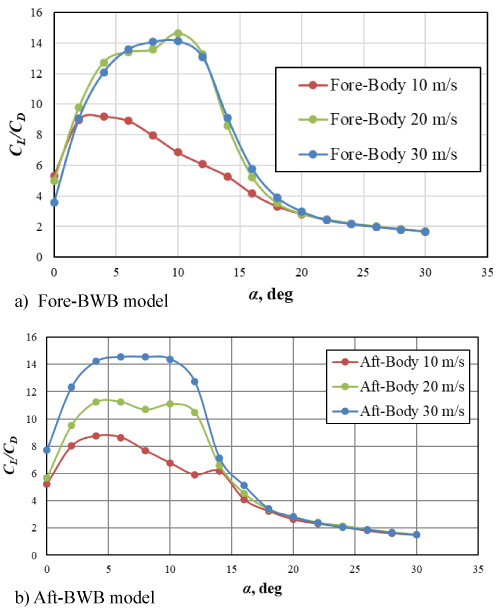
The lift-to-drag ratios are important parameters in determining the performance of each BWB configuration. Higher CL/CD correlates to better efficiency during flight. For the presented UAV concept, a long range of flight is desirable, so the angle of attack, where CL/CD is maximized, is of interest. From Figure 12, for both the fore- and aft-body models, CL/CD values are much lower at 10 m/s than the other cases. In the case of the fore-body, CL/CD are increased with the speed increase from 10 m/s to 20 m/s and remain about the same at 30 m/s. For the aft-body, CL/CD¬ values gradually increase at higher speeds. The fore-body configuration is more advantageous at 20 m/s.
It is apparent from the presented data that the aerodynamics suffers greatly at low speeds causing a significant decreases of the lift-to-drag ratio with a Reynolds number decrease.
Characterization of Lifting-off Propulsion
Single motor tests
Thrust force measurements were conducted on four vertical lift propellers-motors that are entirely submerged within the fuselage structure. From the thrust data obtained using the RCbenchmark loadcell, the thrust coefficients CT were calculated and plotted
Here, the spinning rate is calculated as n = RPM/60 and the nominal propeller diameter is D = 12.7 cm.
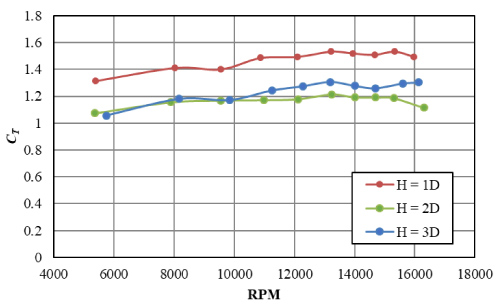
First, each propeller running separately was investigated. Figure 13 shows the resulting CT values for Propeller 1 at values of H. The closer the propulsion to the ground there is a notable increase in the CT values. The values at height of 2D and 3D are close to each other, and lower than that at the height of 1D. This indicates that by the height of 2D, the ground effects are negligible. In all three cases, an increase in motor RPM corresponds to a slight increase in the thrust coefficient.
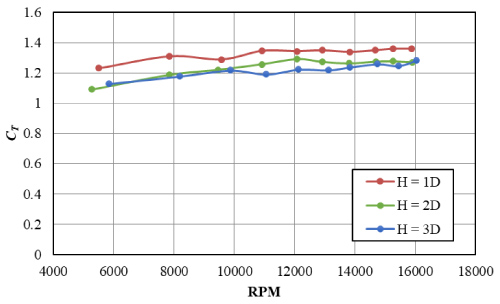
For the case of Propeller 2, Figure 14 shows the CT values at heights of 2D and 3D are lower in comparison to the 1D case. However, unlike with Propeller 1, the differences are less significant. At the larger heights, the thrust coefficient values are close to each other, which also indicate that at these heights, there is no longer ground effect.
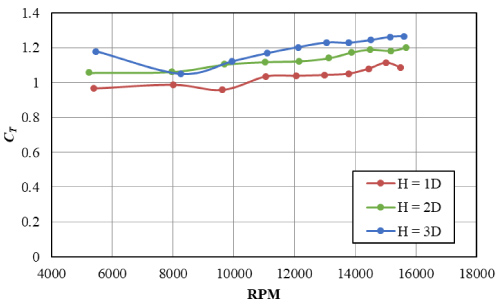
As seen in Figure 15, for Motor 3, the airframe at a height of 1D generates lower CT than at 2 and 3 propeller diameters. As seen in the previous propeller tests, the values of CT at positions of 2D and 3D are much closer together than at the lower position. This is keeping up with the trend that at the larger distances, there is no discernable impact on the performance of each motor due to the ground. However, at 1D, unfavorable ground effects are observed through the loss of thrust. This can be attributed to the fact that Propeller 3 is surrounded by larger supporting structures in the aircraft fuselage in comparison to the other propellers. Propellers 1, 2 and 4 are located closer to the edge of the body so there is no drop of the pressure experienced as would be expected if they were positioned at a more central location of the fuselage.
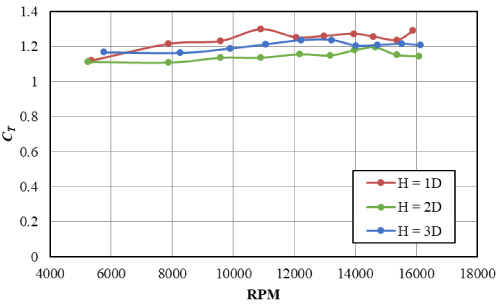
Based on Figure 16, it is seen that Propeller 4 has similar characteristics of Propeller 2. The CT values at all three heights are close to each other. At a height of 3D, CT slightly increases with RPM, and at 1D and 2D, they slowly decrease.
Test results for a system of four propellers
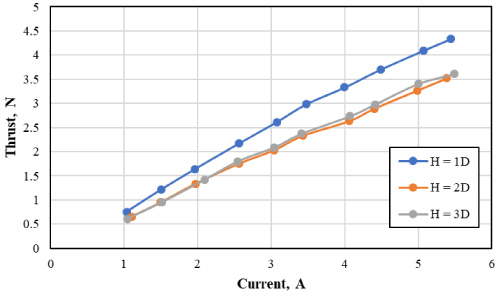
The thrust force was measured on four motors connected in parallel and running simultaneously. Figure 17 shows the thrust force at the three heights above the ground. At the height of 1D, the thrust values are greater compared to heights of 2D and 3D. At a maximum inputted current, the thrust force increases by 27%. The lowest thrust values are seen when the system is positioned at 2D as compared to the case of 3D. Obviously, favorable ground effects are produced by the system when placed at one propeller diameter or closer to the ground.
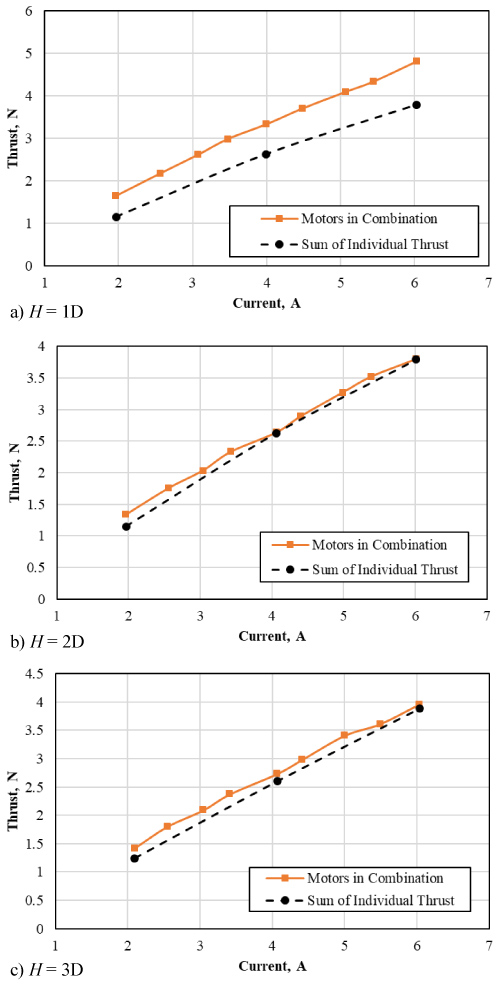
Measured thrust forces generated by a system (combination) of four propellers running simultaneously were compared against thrust forces obtained by summing up individual thrust forces on motors running separately. In the case of the smallest height H = 1D (Figure 18a), measured thrust forces for the system are significantly greater than those obtained based on data for separately propellers running. At the input current of 5A, the thrust in four-propeller system increases by 29%. This is a clear indicator of favorable interactions of slipstreams of propellers running simultaneously. When the airframe is placed close to the ground, the slipstreams impinge on the ground, creating fountains causing an increase in static pressure beneath the craft [15]. At H = 2D (Figure 18b) and 3D (Figure 18c), the expected and experimental results are close to each other.
Conclusions
The aerodynamic characteristics of two BWB wing models and of a system of four propellers in ground proximity were investigated experimentally.
Fore- and aft-body BWB models were tested in the wind tunnel at 10, 20 and 30 m/s, which correspond to the low-to-moderate Reynolds numbers of 1.18 × 10⁵, 2.4 × 10⁵, and 3.6 × 10⁵. The lifts slope and the lift coefficients are higher at 20 and 30 m/s compared to the 10 m/s qualified as a low Reynolds number case. However, lift coefficient values at the zero angle of attack are much higher for both fore- and aft- models at lower velocity. An interesting feature of the lift curves of fore-body model is that no typical stall was observed. After reaching local maxima the lift coefficients remain approximately constant. A lift-to-drag ratio significantly decreases with a Reynolds number decrease.
The fore-body model exhibits a region of positive pitching moment from about 12-16° to 23-25° angle of attack. For the aft-body model, it is mostly negative.
Thrust force measurements were conducted on four vertical lift propellers-motors entirely submerged within the fuselage structure of the UAV. First, thrust data was collected on each motor-propeller running individually. These tests show an increase in thrust for three of the four propellers distant one propeller diameter from the ground indicating favorable ground effects.
Thrust measurements on a system of four lift motors-propellers running simultaneously gave similar results. There is an increase in the thrust force the of four-propeller system is located at one propeller diameter of the ground. This result suggests favorable interactions between slipstreams of multiple propellers in a system. Moreover, a greater amount of thrust is found in comparison to the sum of individual thrust values of each propeller-motor. This is attributed to a fountain effect, in which the propellers slipstreams’ interaction increases the pressure between the aircraft body and the ground.
Acknowledgments
The authors would like to thank Pascal Planchenault and Elvin Flores for their contributions to this work.
References
- Office of the Secretary of Defense (2002) Unmanned aerial vehicles roadmap: 2002-2027. U.S. Department of Defense.
- (2013) Unmanned Systems Integrated Roadmap 2013-2038. U.S. Department of Defence.
- Saeeda A, Younesb A, Caic C, et al. (2018) A survey of hybrid unmanned aerial vehicles. Progress in Aerospace Sciences 98: 91-105.
- Sato A (2003) The RMAX Helicopter UAV. Aeronautic Operations, Yamaha Motor Co., Ltd., Shizuoka, Japan.
- Hanlon M (2004) Yamaha's RMAX - the worlds most advanced non-military UAV. New Atlas - New Technology and Science News.
- Radhakrishnan A, Schmitz F (2005) Quad tilt rotor aerodynamics in ground effect. 23rd AIAA Applied Aerodynamics Conference.
- Shkarayev S, Moschetta JM, Bataille B (2008) Aerodynamic design of micro air vehicles for vertical flight. Journal of Aircraft 45: 1715-1724.
- (2014) Boeing Phantom Swift selected for Darpa X-plane competition.
- Chiew J, Aftosmis M (2018) Efficient simulation of multi-rotor configurations with low Reynolds number propellers. Applied Aerodynamics Conference.
- Bouskela A, Jacquinot K, Reguine T, et al. (2017) Design of a fixed-wing and tilt-rotor vertical takeoff and landing aircraft. Design Report, University of Arizona, Tucson, AZ.
- Getman A, Wesely B, Talamantes J, et al. (2018) Vertical takeoff and landing unmanned aircraft system. Design Report, University of Arizona, Tucson, AZ.
- Wells DP, Olson ED (2011) Hybrid wing body planform design with vehicle sketch pad. AIAA Paper.
- Kim H, Harding D, Gronstal DT, et al. (2016) Aerodynamic design of the hybrid wing body with nacelle: N3-X propulsion-airframe configuration. AIAA Paper.
- Pereira JL (2008) Hover and wind-tunnel testing of shrouded rotors for improved micro air vehicle design. Ph.D. Thesis, University of Maryland, College Park, MD.
- Kohlman DL (1981) Introduction to V/STOL airplanes. Iowa State University Press, Ames.
- Borgman D (2018) Wind tunnel characterization. University of Arizona.
- (2013) 36” x48” Recirculating wind tunnel & data acquisition system. Operation and maintenance instructions. Engineering Laboratory Design, Inc.
- (2015) Model Position System (MPS) Acquisition and Control Software. User Manual, Force Measurement Systems, 31.
- https://cdn-docs.rcbenchmark.com/wp-content/uploads/2018/07/2018-07-25-RCbenchmark-1580-datasheet.pdf
Corresponding Author
Sergey Shkarayev, Professor, Department of Aerospace and Mechanical Engineering. AIAA Senior Member, University of Arizona, Tucson, AZ, 85721, USA.
Copyright
© 2020 Footohi P, et al. This is an open-access article distributed under the terms of the Creative Commons Attribution License, which permits unrestricted use, distribution, and reproduction in any medium, provided the original author and source are credited.