Towards an Airfoil Catalogue for Wind Turbine Blades at IDR/UPM Institute with OpenFOAM
Abstract
A methodology to efficiently simulate wind tunnel tests of several airfoils with OpenFOAM has been developed in this work. This methodology bridges OpenFOAM capabilities with MATLAB post-processing in order to analyze efficiently the performance of wind turbine airfoils at any angle of attack. This technique has been developed to reduce the cost, in terms of time and resources, of wind tunnel campaigns on wind turbine blade airfoils. Different turbulence models were used to study the behavior of the airfoils near stall. Wind turbine airfoils need to be characterized for all possible angles of attack, in order to reproduce the real aerodynamic patterns during operation. Unfortunately, this situation is translated into a huge demand of wind tunnel testing resources, airfoil manufacturing and data post-processing. The high costs in terms of experimental measurements have encouraged many researches to elaborate airfoil catalogues by performing Computational Fluid Dynamics (CFD) simulations. Results are compared with a testing campaign on wind turbine airfoils aerodynamics run at AB6 wind tunnel of IDR/UPM located at the campus Universidad Politécnica de Madrid (Madrid, Spain), this tunnel being particularly suited for bi-dimensional applications. It is an open wind tunnel with a test section of 2.5 × 0.5 m, the turbulence intensity is under 3% at a Reynolds number of Re ≅ 5•105.
Keywords
Wind turbine blade, Airfoil catalogue, Turbulence models, CFD, OpenFOAM, Wind tunnel test
Introduction
Wind turbine airfoils need to be characterized for all possible angles of attack, in order to reproduce aerodynamic behavior from any real operating condition. Unfortunately, this requires a huge demand of wind tunnel testing resources, airfoil manufacturing and data post-processing. The high costs in terms of experimental measurements has inspired this work to elaborate an airfoil catalogue by performing CFD simulations with the open source software OpenFOAM, following the example of existing researches [1,2]. Although most of them only analyzed the performance at angles of attack within the range from α = -20º to α = 20º, some interesting works studying the airfoil performances at very high angles of attack can be found in the literature; see for example the report [3]. In Fuglsang, et al. 2004 the design and experimental verification of Risø-B1 airfoil family using a structured mesh is presented. A direct design method based on an optimization algorithm coupled with XFOIL is presented. Transition was modelled by the en method. Ellipsys code was used to verify the magnitude of Cl, max and the shape of Cl in the post-stall region. Leading edge roughness, stall strips, vortex generators and Gurney flaps are studied at Reynolds number from Re = 1.6•106 to Re = 9•106. The combination of Gurney flaps and vortex generators was shown as an attractive option for the root of a wind turbine blade.
Wind turbine design and in particular the blade design has received the attention of many researchers through the last recent years targeting renewable power extraction optimization [4-7].
The development of thick airfoils for the inner part of the blade of the wind turbine has been approached by different methodologies (blade element theory, experimental test and numerical simulations [8-10]). The good stall characteristics can help to keep high aerodynamic performance and prevent structural problems for the blade [11].
Numerical simulations can help understand the airfoil aerodynamics, reduce the number of models to be manufactured and tested, and also improve the quality and reliability of the wind tunnel testing, for example by improving the pressure taps distribution on the model's surface to measure the wind flow effects.
An efficient meshing technique to simulate two-dimensional flow field around a generic body was created and validated through the prediction of the performance of the NACA 0012 airfoil. This methodology allows us to generate the mesh for one angle of attack only, obtaining the mesh for other angles of attack with a simple modification of the initial mesh (that is, without the need of creating a new one from the beginning, resulting in a considerable reduction of the time and computational costs).
In the present work, the post-stall behavior of airfoils is not considered due to the extremely high computational cost of unsteady numerical simulations and the limited resources available to perform them. The text is organized as follows: The experimental and numerical set-up is described in Section 4, whereas the results are included in Section 5. Finally, conclusions are summarized in Section 6.
Experimental and Numerical Set-Up
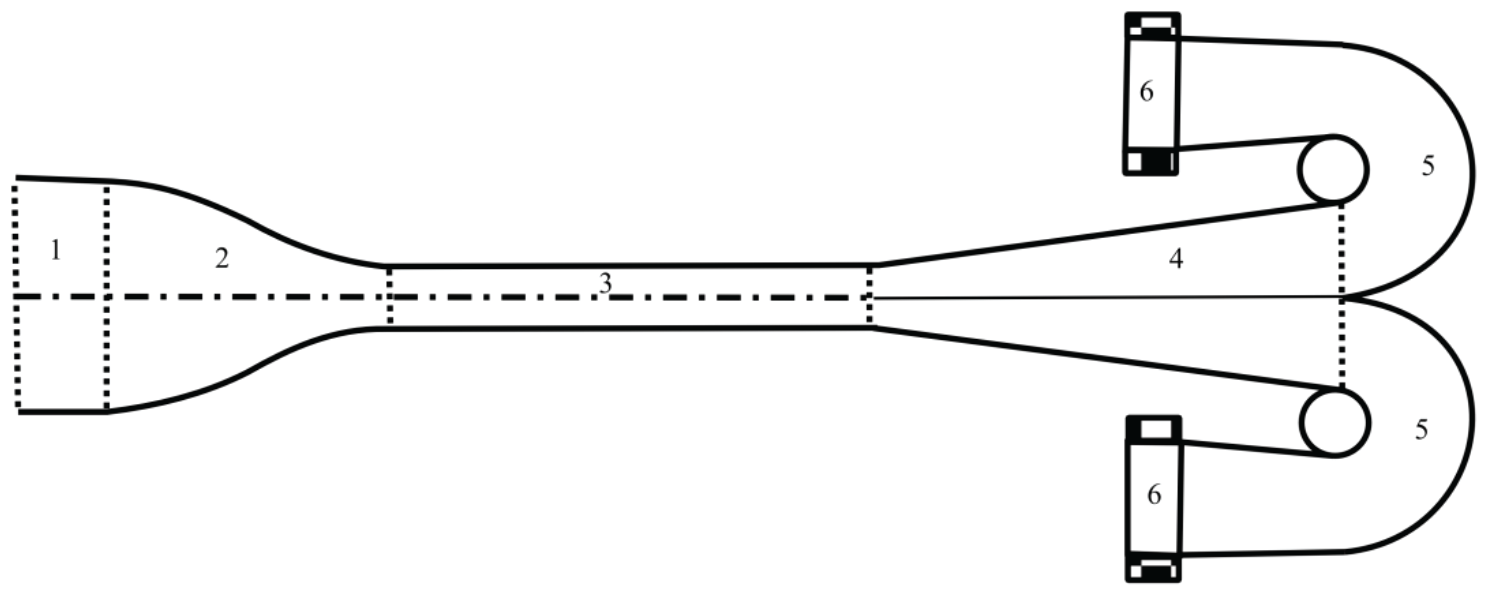
The AB6 is an open wind tunnel with a 2.5 m × 0.5 m test section and 4 m length, with a 4.5:1 contraction ratio. A sketch of the wind tunnel is shown in Figure 1. The flow at the testing chamber is two-dimensional, with less than 1% differences along the vertical direction. The turbulence intensity is under 3% for a flow speed of 25 m/s at the center of the test section, the Reynolds number being Re ≅ 5•105. The airfoil's chord is 0.3 m and the span 0.49 m, the maximum blockage of the test section is between 3% at small angles of attack, up to 12% at 90º. Airfoil was mounted at 1.225 m from the tunnel floor and at 1.9 m from the nozzle outlet.
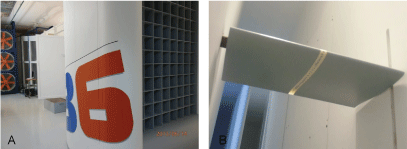
Pressure measurements were carried out at the central section of the airfoil surface using pressure taps. The airfoil pressure distribution was integrated to obtain normal force, lift and drag and moment coefficients (obviously, this approach has a reduced accuracy at low angles of attack, as drag forces mainly depends on skin friction in that situation). The airfoil section was equipped with 53 to 63 pressure taps depending on the airfoil, having a diameter of 1.5 mm. The pressure differential model ZOC 33/64PxX2 from Scanivalve Corp and a positioner Newport model RV-120-PPHL with a precision of 1/1000 degree were used. LabView interface was used to control positioner, data acquisition system, pressure probes and ambient conditions. Pressure was measured for 35 seconds with a sampling frequency of 150 Hz. In Figure 2 the test chamber is shown.
As mentioned above, the software chosen for this study is the open source CFD software OpenFOAM. The solver used is simpleFoam, a steady-state solver for incompressible, viscous and turbulent flow based on the SIMPLE algorithm. Different turbulence models and different near-wall treatments have been used. With wall functions, high-Reynolds turbulence models (Re ≅ 6•106), namely k - ω SST, k - ε, realisable k - ε and Spalart-Allmaras were simulated. When resolving boundary layer, low-Reynolds turbulence models (Re ≅ 2•105 and Re ≅ 5•105), namely Launder-Sharma k-ε, k-ω SST and Spalart-Allmaras. A different mesh is used for Low - Re problems, trying to keep y < 1. Also, a simple grid independence analysis was performed using the k - ω SST model and taking advantage of the refineWallLayer tool, using the drag coefficient Cd at zero angle of attack as parameter. The characteristics of the different meshes and the results are included in Table 1.
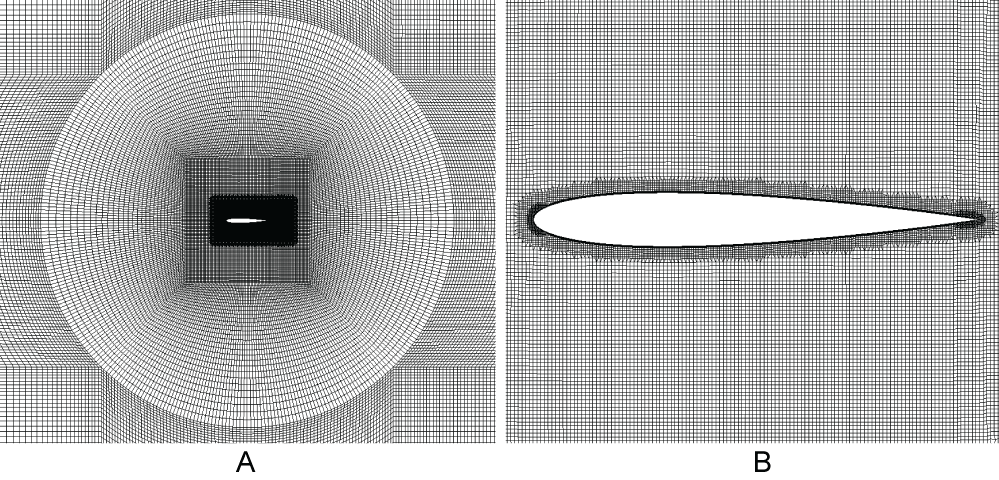
Mesh 1 described in Table 1 was chosen for the simulations, to reduce computational costs in terms of time and resources, since the error with respect to the finest mesh tested can be considered sufficiently low. The final mesh is displayed in Figure 3. The numerical schemes have been chosen, according to mesh quality, following instructions and suggestions provided in reference [12]. All the schemes are collected in the Table 2, referred to OpenFOAM's syntax. The "default" scheme is used, unless something different is specified. The boundary condition used at the inlet and outlet is freestream (for pressure freestreamPressure) and calculated uniform 0 for νT. For ε fixedValue at the inlet and zeroGradient at the outlet. On the airfoil surface no slip for velocity and zeroGradient for pressure, wall functions are used with high-Reynolds and for low-Reynolds a small fixedValue (1•10-12) was used. For more detailed information on the boundary conditions see reference [13].
Often, when simulating flows around a body at different angles of attack, a new mesh is generated for each angle of attack. It is easy to understand how this makes the pre-processing phase very time-consuming. A solution could be using an O-mesh or a C-mesh and changing the inlet boundary condition for the velocity, but this cannot be done when simulating a real wind tunnel. In the present work, OpenFOAM native mesh generators, blockMesh and snappyHexMesh, and its utilities were used to generate, rotate and merge the several meshes used to simulate the flow around the studied airfoils at different angles of attack. Basically, the body is surrounded by a cylindrical region that can be split from the rest of the mesh, rotated to change the angle of attack, and then stitched again to the external region. The procedure relies on the following OpenFOAM utilities:
• blockMesh to generate a background, structured mesh.
• surfaceFeatureExtract to create a file containing information about the geometry.
• snappyHexMesh to generate the mesh around the body.
• topoSet to generate two files containing a list of the cells of the internal and external region.
• splitMeshRegions to split the two regions of the mesh.
• transformPoints to rotate the inner mesh.
• mergeMeshes to merge again the two meshes.
• stitchMesh to stitch the mesh, deleting the existing internal patches.
• extrudeMesh to make the mesh suitable for 2D applications.
The strategy of splitting and rotating the internal mesh (see Figure 3) strongly reduces the computational time required to generate new meshes. This strategy could also be used to interpolate between the wind tunnel test results if problems arise during the measurement process. The proposed methodology makes the process of simulating the flow around a body independent of the shape of the body after a few iterations to find the right parameters for snappyHexMesh. As aforementioned, for more details about the meshing technique see reference [13].
The corrections performed in the tunnel to improve the measurements where:
• Leakage detection and modification. The leakage detection was performed with a visualization of the flow between the intrados and the extrados using wool. In order to block the flow an adhesive foam was attached to the airfoil, covering the gap between the airfoil and the wall.
• Pitot tube position. The wind speed on the Pitot tube differs from the wind speed measured in the airfoil location. In order to avoid coefficient miscalculations a correlation between both speeds was performed and applied to the measured wind speed.
• Leading edge. The leading edge must be a stagnation point at angle of attack zero. This fact does not happen always and a correction factor is applied in order to correct all the pressures. It can occurs due to dynamic pressure deviations.
• Trailing edge extrapolation. Due to the difficulty to insert pressure taps at the trailing edge, it has been assumed a constant value for the pressure coefficient from the last tap to the trailing edge.
The trailing edge extrapolation can be replaced by the value from the simulation once this has been previously validated.
Results
Validation
An example of the mesh generated with the above-mentioned procedure around the NACA 0012 airfoil is shown in Figure 3. Different turbulence models were used in order to reproduce flow detachment and stall conditions. Besides, the effects of the Reynolds number, varying it from Re = 2•105 to Re = 6•106, were analyzed with RANS simulations using realizable k - ε, k - ω SST and Spalart-Allmaras turbulence models. The simulations have been performed in the linear region of the lift coefficient C_l up to stall.
High-Reynolds models
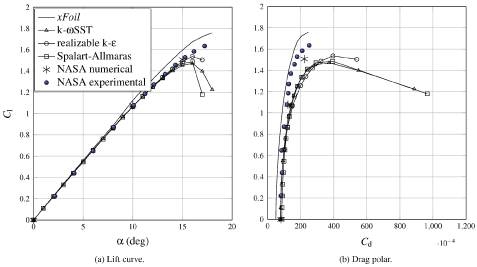
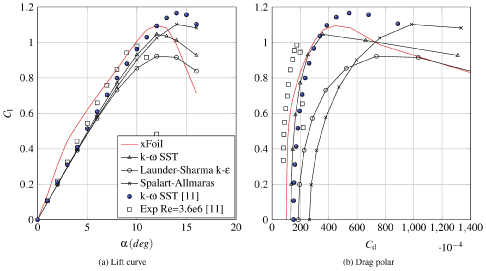
Pressure distributions and polar diagrams obtained from the different airfoils studied are successfully compared to the corresponding ones from the available literature [14-17], obtained with wind tunnel testing and numerical simulations. The example provided in Figure 4 refers to the validation case of the performances of NACA 0012 airfoil, using the above-mentioned turbulence models, at Re = 6•106. The Reynolds number chosen is the same of the references [16,17], whose results are used as terms for comparison together with results obtained with XFOIL [18]. It is clear that the lift and drag coefficients are very close to the ones from literature for low angles of attack, and less accurate when approaching the stall due to an early prediction of flow detachment.
Low-Reynolds models
The lift and drag coefficients have been calculated and compared with results from a Master Thesis dissertation from the Technical University of Denmark [19], obtained in OpenFOAM using a structured mesh and the k - ω SST turbulence model at Re = 2•105, and results obtained with XFOIL at the same Reynolds number. These results are shown in Figure 5 with the understanding that both XFOIL and numerical simulations with fully turbulent models cannot properly catch the behavior of the flow at such a low Reynolds number.
Airfoil catalogue
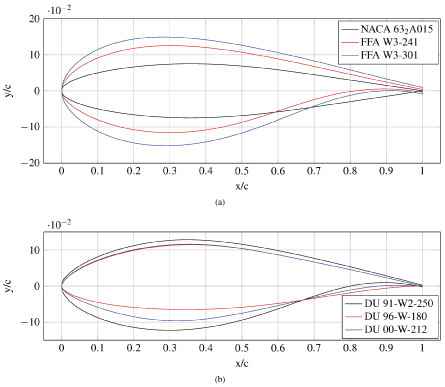
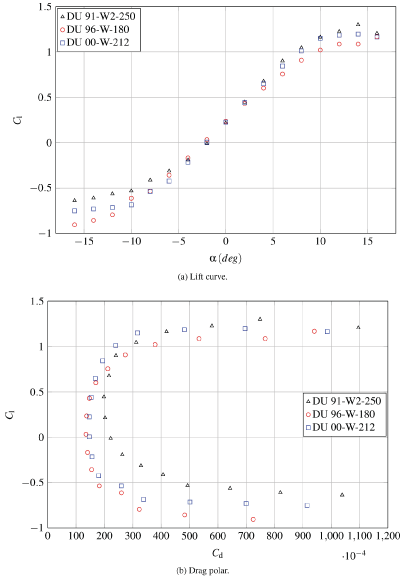
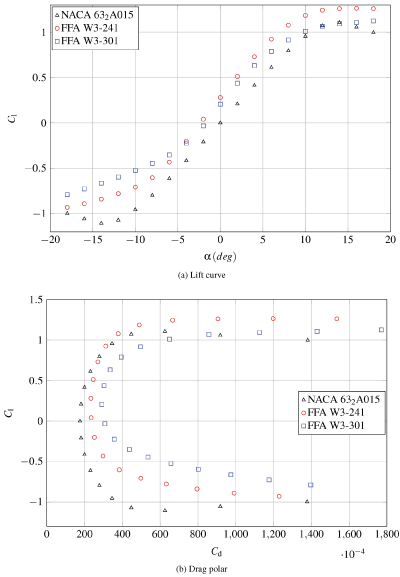
The six airfoil geometries studied in the catalogue (NACA 632A015; DU 91-W2-250; DU 96-W-180; DU 00-W-212; FFA W3-241; and FFA W3-301) are shown in Figure 6. In the following subsections, the lift and drag coefficients, as well as the pressure coefficient at α = 6º and α = 12º angles of attack are included for each case. In Figure 7 can be observed the increase of the maximum lift coefficient due to the thickness increase, which also implies an increase of the drag coefficient.
NACA 632A015
This airfoil is a modified version, identified with the capital letter "A", of the corresponding NACA 6-series airfoil. These airfoils were designed to maximise the chordwise extent of laminar flow in order to reduce the drag coefficient, at least in a limited range of operating conditions close to the design lift coefficient [20]. Thus their polar are characterized by a region of lower drag, with centre at the design lift coefficient, known as low-drag bucket. The NACA 632A015 is a symmetric airfoil, whose thickness is 15% of the chord, the design coefficient is equal to zero and the extent of the low-drag bucket is 0.2 above and below the design lift coefficient.
The angle of maximum lift, the maximum lift coefficient and the minimum drag coefficient are close to the other predictions. Concerning the lift coefficient, the first two turbulence models give very close results, which also are in great agreement with data from XFOIL; slight differences can be appreciated in the stall region, whereas the maximum lift coefficient an the incidence of maximum lift are still very close. The prediction of the curve's slope in the linear region obtained with the Launder-Sharma k - ε turbulence model is in fair agreement with XFOIL and the ones obtained with the other turbulence models; the maximum lift coefficient is underpredicted, even though the angle of maximum lift is very close to the other results. All the turbulence models predicted higher drag coefficients than XFOIL.
5.2.2 DU 91-W2-250
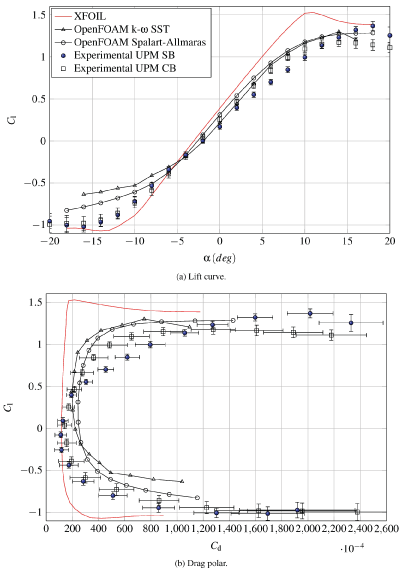
The DU 91-W2-250 is the first of the three wind turbine dedicated airfoils designed at the Technological University of Delft included in the catalogue. More information and data can be found in [21,22]. As the designation suggests it, has a thickness equal to the 25% of the chord, being suitable as airfoil for mid sections of wind turbines' blades [21]. Lift and drag coefficients obtained with the k - ω SST and Spalart-Allmaras turbulence models in OpenFOAM are compared with XFOIL calculations and experimental data as shown in Figure 8 and Figure 9.
Regarding the lift coefficient, results from computational calculations are in good agreement, except in the stall region at negative incidences. The predictions of the lift curve slope are inside the interval of one standard deviation of experimental data and XFOIL calculations. Experimental data show a considerable improvement after the implementation of wind tunnel corrections (CB).
Concerning the drag coefficient, both computational predictions of the minimum drag coefficient overestimate XFOIL and experimental data, but the variation of the drag coefficient as a function of the lift coefficient is quite similar to XFOIL. Experimental minimum drag coefficient is very close to XFOIL calculation, and again the correction improved the results. At high angles of attack the differences in drag coefficient are higher.
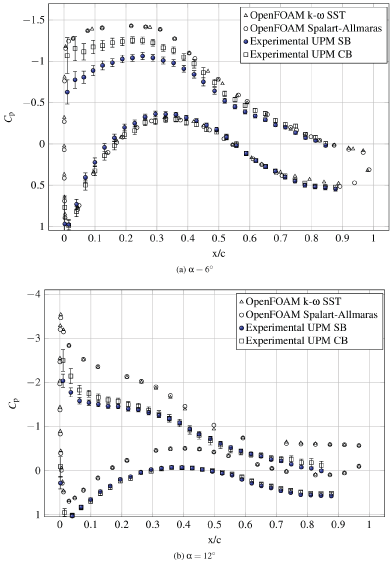
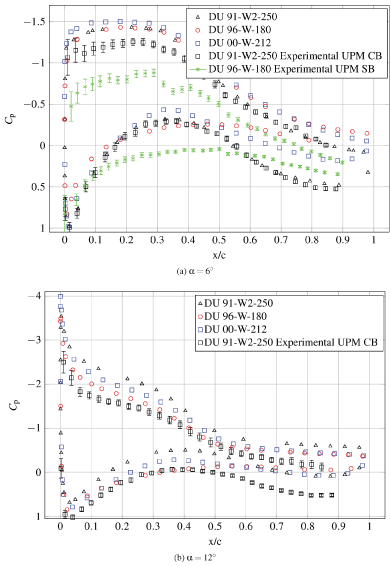
Despite the differences between test and simulations in pressure coefficient distribution around the airfoil are reduced after tunnel corrections, the increase with the angle of attack of these differences in the pressure side in the rear part of the airfoil leads to think that a small leakage could still remain.
5.2.3 DU 96-W-180
This is the second airfoil from the DU series analysed. The thickness of the DU 96-W-180 is the 18% of the chord, and is thus suitable for the tip sections of wind turbines' blades [21]. The lift coefficient, predictions obtained with both turbulence models are very close to XFOIL results except for the stall region. Indeed, the slopes of the lift curves and the zero-lift incidences are in good agreement, whereas the maximum lift coefficients obtained from CFD calculations are lower than XFOIL prediction. Nevertheless, the maximum lift incidence and the post-stall behaviour are predicted very accurately with the k - ω SST turbulence model.
The predictions of the drag coefficient, as for all the other cases studied, are higher than XFOIL results, whereas the behaviour of the drag coefficient, which change very little until massive separation occurs, is qualitatively similar.
In airfoil DU 96-W-180 a bump is shown in the pressure coefficient on the suction side (see Figure 10), at x = 0.3c (where c stands for the airfoil chord), and being extended to x = 0.45c. The recirculation bubble and other instabilities that arise in the low Reynolds number flow can't be captured with steady simulation, even laminar bubbles are mapped in transition turbulence models.
5.2.4 DU 00-W-212
This is the third and last airfoil from the DU series. The thickness of the DU 00-W-212 is around the 21% of the chord, and is thus suitable for the mid sections of wind turbines' blades [21].
Regarding the lift coefficient, results obtained in OpenFOAM and experimental ones are in great agreement at positive incidence, but are very different at negative incidence. XFOIL calculations show higher slope and maximum lift coefficient. The post-stall behaviour is qualitatively similar for XFOIL calculations, OpenFOAM predictions with k - ω SST model and experimental data, with a slight decrease of the lift coefficient as the angle of attack increases. The maximum lift coefficient is similar for each curve except the one obtained with the k - ω SST turbulence model.
The drag coefficient curves obtained with OpenFOAM and XFOIL are qualitatively similar, but OpenFOAM predicts higher drag. The minimum drag coefficient from experimental data is in good agreement with XFOIL results, but increases far more rapidly as the incidence increases.
5.2.6 FFA W3-301
This is the second and last airfoil of the FFA series to be studied. The FFA W3-301's thickness is around the 30% of the chord as shown in Figure 6.
Lift and drag coefficients obtained with the Spalart-Allmaras turbulence models in OpenFOAM are compared together with FFA W3-241 and NACA 632 A015 in Figure 11.
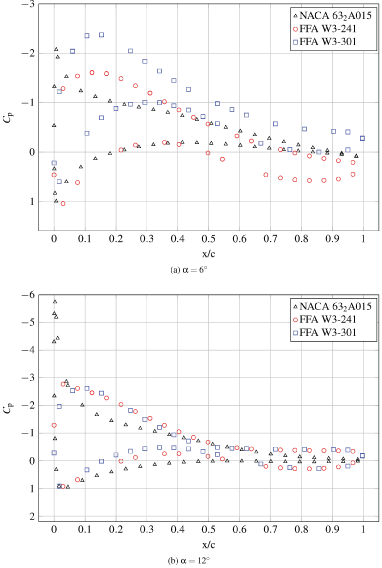
In Figure 12 can be observed in the pressure distribution the different behaviour at 6º and 12º between the suction peak in the leading edge of the NACA and the smoothed distribution of the FFA family.
Conclusions
An efficient meshing technique to simulate wind tunnel tests over a generic body for any angle of attack with OpenFOAM has been introduced and successfully validated through a simple test case. Different airfoil families used of wind turbines have been simulated with the proposed methodology.
OpenFOAM simulations help to understand the aerodynamics of wind turbine airfoils, to reduce the number of models to be manufactured and tested, and also to improve the quality and reliability of the wind tunnel facility (i.e., improving the pressure taps distribution on the models surface to measure the wind flow effects, leakage detection, etc.).
Simulation results with high and low Reynolds turbulence models have been compared with experimental results, XFOIL and other simulations found in the bibliography.
Although, in general results of the present are quite good, with the tendencies of the tested airfoils behaviour correctly reproduced, it is also fair to admit some issues that need to be corrected in future works. First of all, the flow of the wind tunnel needs to be improved in terms of turbulence and uniformity, in order to be closer to an ideal 2-D flow. Secondly, the transition turbulence models should be used to capture the transition phenomena in the suction side in order to reproduce accurately the flow field around the airfoil.
Acknowledgments
The authors are indebted to the IDR/UPM Institute staff for the constant support.
References
- Fuglsang P, Bak C, Gaunaa M, et al. (2004) Design and verification of the Riso-B1 airfoil family for wind turbines. Journal of Solar Energy Engineering (Transactions of the ASME) 126: 1002-1010.
- Bertagnolio F, Sørensen NN, Johansen J, et al. (2001) Wind turbine airfoil catalogue. Risø National Laboratory, Roskilde, Denmark.
- Shur ML, Spalart PR, Strelets M, et al. (1999) Detatched-eddy simulation of an airfoil at high angle of attack. Engineering Turbulence Modelling and Experiments 4: 669-678.
- Bai CJ, Wang WC (2016) Review of computational and experimental approaches to analysis of aerodynamic performance in horizontal-axis wind turbines (HAWTs). Renewable and Sustainable Energy Reviews 63: 506-519.
- Huang CC, Chi-Jeng Bai, YC Shiah, et al. (2016) Optimal design of protuberant blades for small variable-speed horizontal axis wind turbine-experiments and simulations. Energy 115: 1156-1167.
- Lee MH, Shiah YC, Bai CJ (2016) Experiments and numerical simulations of the rotor-blade performance for a small-scale horizontal axis wind turbine. Journal of Wind Engineering and Industrial Aerodynamics 149: 17-29.
- Waris M, Ishihara T (2012) Dynamic response analysis of floating offshore wind turbine with different types of heave plates and mooring systems by using a fully nonlinear model. Coupled Systems Mechanics 1: 247-268.
- Xingxing Li, Ke Yang, Lei Zhang, et al. (2014) Large thickness airfoils with high lift in the operating range of angle of attack. Journal of Renewable and Sustainable Energy 6.
- Han Z, SONG Wenping, GAO Yongwei, et al. (2016) Design and verification of airfoil families for large-size wind turbine blades. Applied Mathematics and Mechanics 37: 67-84.
- Zhang L, Li X, Yang K (2016) Experimental and computational aerodynamic investigations of very thick wind turbine airfoils. Journal of Renewable and Sustainable Energy 8.
- Grasso F (2013) Development of Thick Airfoils for Wind Turbines. Journal of Aircraft 50: 975-981.
- Guerrero J (2016) Introductory OpenFOAM course-training. Module 9, Università degli Studi di Genova, Genoa, Italy.
- Donisi L (2017) 2D Investigation of aerodynamic performance of wind turbine dedicated airfoils with OpenFOAM. Master's thesis, Università degli Studi di Napoli Federico II, Naples, Italy.
- Bjorck A (1990) Coordinates and calculations for the FFA-WL-XXX, FFA-W2-XXX and FFA-W3-XXX series of airfoils for horizontal axis wind turbines. FFA TN 1990-15, The Aeronautical Research Institute of Sweden.
- Jafari SAH, Kosasih B (2014) Flow analysis of shrouded small wind turbine with a simple frustum diffuser with computational fluid dynamics simulations. Journal of Wind Engineering and Industrial Aerodynamics 125: 102-110.
- Ladson CL (1988) Effects of independent variation of Mach and Reynolds numbers on the low-speed aerodynamic characteristics of the NACA 0012 airfoil section. NASA TM 4074, National Aeronautics and Space Administration, Langley Research Center.
- NASA Langley Research Center (2017) Turbulence Modeling Resource.
- Drela M (1989) XFOIL: An analysis and design system for low Reynolds number airfoils. Low Reynolds Number Aerodynamics 1-12.
- Kaloyanov T (2011) Investigation of 2D airfoils equipped with a trailing edge flaps. Master's Thesis, Technical University of Denmark, Lyngby.
- Abbott IH, Von Doenhoff AE (1959) Theory of Wing Sections, Including a Summary of Airfoil Data. Courier Corporation.
- Van Rooij R, Timmer N (2004) Design of airfoils for wind turbine blades. Delft University of Technology, The Netherlands.
- Timmer WA, Van Rooij RPJOM (2003) Summary of the Delft University wind turbine dedicated airfoils. Transactions-American Society of Mechanical Engineers Journal of Solar Energy Engineering 125: 488-496.
Corresponding Author
F. Sorribes-Palmer, Professor, Instituto Universitario de Microgravedad "Ignacio Da Riva" (IDR/UPM), ETSI Aeronáutica y del Espacio, Universidad Politécnica de Madrid, Pza, del Cardenal Cisneros 3, Madrid 28040, Spain.
Copyright
© 2018 Sorribes-Palmer F, et al. This is an open-access article distributed under the terms of the Creative Commons Attribution License, which permits unrestricted use, distribution, and reproduction in any medium, provided the original author and source are credited.

