Effects of a Full Scale Aircraft Immersed within a Large Aviation-Fuel Fire in Crosswind on the Flame Shape - A Numerical Study
Abstract
Large Eddy Simulation combined with an Eddy Dissipation Concept (EDC) combustion model shows the feasibility for simulations of a full scale aircraft immersed within a large aviation-fuel fire in a moving fluid medium. Coupling between the condensed fuel and gas phases allows investigating the roles of the wind speed on the burning rate of condensed fuel, and consequently, the heat release rate. The predicted combustion efficiency of a large scale liquid pool fire remains approximately constant with a value of 85%. The predicted burning rate of a liquid pool fire increases with wind speed up to critical value of about 3-4 m/s, then decrease strongly with a further increase in the wind speed. It appears that the primary flame zone is not significant affected by the presence of an aircraft for the wind speed below 2 m/s. The prediction indicates that interaction between the aircraft and fire environment combined with the influence of medium wind speed of 5 m/s affects dramatically the flame shape. Presence of an aircraft leads to a factor of about 1.8 increases in the elongation of turbulent boundary layer diffusion flame for the wind speed beyond 5 m/s. globally, the flame height in large-scale pool fire is mainly associated with the fire dynamics at low source Froude number and the flame length with the wind speed.
Keywords
Fire models, Heat flux, Crosswind, Aircraft, Burning rate, Flame shape
Introduction
Fuel is carried in three fuel tanks, all of which are integrally formed within the aircraft's wing structure. A general feature of most, uneven temperature distributions can occur, producing areas of locally relatively high temperatures. Such local effects can also be produced by different causes, such as a distorted fuel nozzle, flow pattern, distortion of the dimensions of the can or cooling airflow disturbance caused by repairs or faulty design/manufacture. The aircraft is fitted with separate fire and overheat detection systems designed to alert the crew to excessive temperatures within the engine nacelles. The engine failure may be caused by an explosive rupture of the combustion chamber outer case. The rupture immediately causes the engine to run down. The fire ignites when fuel from the punctured wing tank access panel comes into contact with combustion gases escaping from the damaged engine. Although the wind has strength so slight that it has a relatively insignificant factor in terms of aircraft handling-there is a powerful body of evidence which clearly shows that the influence of the wind on the accident is paramount. When the aircraft decelerates up to zero velocity, the fire transition into a quasi-static, intense pool fire outside the hull, falls into two subcategories: those where the fuselage has been ruptured to some degree, as result of crash damage for example, giving the fire direct access to the cabin interior; and those in which the hull is initially intact and capable of presenting a barrier to the external fire. The wind drives the static fire plume against and beneath the hull, making a more rapid penetration of the alloy fuselage skins inevitable. The decision making process regarding the main threat on the passenger survivability in aviation company depends increasingly on numerical simulations.
Intensive research has been carried over decades on the pool fires from a liquid fuel pool [1-10], though only a small proportion of the work has looked specifically on interaction between objet and fire environment combined with the influence of medium wind speed [11]. The burning rate of free pool fire can be estimated with a simple correlation [1] that requires only the knowledge of fuel properties. The empirical correlation of Peatross [2] for fuel mass loss rate is limited to the case where the heat fluxes from low gas and wall temperature can be negligible. The theoretical model developed by Utiskul [3] allows predicting mass loss rate solely for small-scale pool fire experiments, because flame radiation heat feedback to the liquid surface was neglected. The study of Tewarson [4] was focused on a steady-state heat balance at the fuel surface with a radiation adjustment through the Spalding number. The work of Orloff [5] illustrated the application of Froude modelling to the development of a homogeneous fire radiation correlation. Based on the experimental data of Karlsson [6] for radiative heat feedback, the work of Hamins [7] developed a global approach to predict the mass burning flux for liquid pool fires. In an analytical study of Beaulieu [8], the measured flame temperature is required to quantify the effect of enhanced ambient oxygen concentration on flame heat flux, and consequently on burning rate of liquid fuel. Furthermore, large scale fire also implies poor entrainment, therefore enhanced soot production. For a heavily soothing flame such as fire, radiation is a crucial aspect of combustion, and can dominate other modes of heat transfer. No predictive burning rate simulation in a large-scale liquid pool fire in cross flow have been reported yet due to the difficulties in the prediction of the radiative flux associated with the soot formation. The effects of wind on a pool fire are complex. Depending on the wind speed, there may be an effect of convective enhancement. The wind may also bring about improved mixing and more efficient combustion which will tend to increase the flame temperature [11]. Furthermore, the plume will be displaced which will bring about a significant change to the radiation profile. Interaction between a flame and a cross-flow was described by Lavid, et al. [12] in terms of the ratio between buoyant and inertia forces in assessing if the flame is controlled by a natural or forced convection. Putman [13] investigated the behaviour of small fires, indicating that an increase of the longitudinal ventilation rate enhanced the flame length. From tests of full-scale wind aided fires [14], reduction in the flame length with an increase of wind speed was found. Tests were conducted by Keltner [15] to simulate fuel spill fires that might occur under the wing of a transport aircraft. A considerable effort has been made by Greiner [16] and Suo-Anttila [11] in conducting full-scale numerical and experimental simulations of the fuel evaporation rate and heat flux distributions with the presence of an object engulfed in a large fuel fire. The computations effort of a large pool fire with a diameter of 20 m in cross-flow [17] was driven, which was essential to demonstrate that CFD was able to assess the complex geometry or physics.
The current CFD approach is much more realistic, when dealing with the characteristics of the wind-induced interaction of liquid fires and large objects, than the simpler alternatives [14,15]. A tractable theoretical formulation is proposed to predict the heat release rate controlled by fire scenario from a liquid pool, and the impact of an aircraft on flame structure. The pyrolysis rate of the condensed fuel is strongly dependent on the heat feedback from the flame associated with soot formation via radiation. Soot production in fire plumes is a highly complex subject due to the spatially-varying formation and oxidation processes, the influence of turbulent fluctuations and strong temperature, and fuel dependent effects. Note that in the version 5 or 6 of FDS [18] which will be used in this study, the soot yield value, defined as the fraction of the fuel mass that is converted into soot, should be specified. This empirical parameter is well known for well-ventilated fires (for example, 0.042 for kerosene and 0.037 for heptanes), but cannot be applied to large-scale fires due to an increase of local equivalence ratio beyond one. In order to properly calculate soot production in under-ventilated condition without specifying any of the parameters for adjusting the flame temperature, a principle of smoke point [19] was embedded within FDS5. In such type model, the parameter for differences in soothing behaviour of different fuels is the pre-exponential factor which is reversely proportional to its laminar smoke point height which has been measured for many fuels [19]. This makes CFD calculations of flame radiation in non-premixed flames of an arbitrary hydrocarbon fuel feasible, thereby making it an especially useful tool for the fire safety. Currently, we lack the ability to introduce this soot model in FDS6 due to the increasing complexity in its structure.
Physical Modeling
Advanced fire physics model, which is the subject of the current work, requires state-of-the-art sub models (combustion, multidimensional participating radiation, soot formation, heat transfer, etc.) which are coupled with condensed fuel vaporization.
Reacting system in gas phase
Globally, the basis of the analysis is the conservation equations of mass, momentum, energy and species, a set of three-dimensional elliptic, time-dependent Navier-Stokes equations. The gas temperature in reacting system is derived from the energy equation including the heat release rate, which is determined from the consumption rate of the two combustibles of CO and fuel. The combustion processes are governed by the convection-diffusion equations for the mass fraction of fuel, O2, CO, CO2, H2O and N2 via two chemical reaction steps. The current model uses classic principle of smoke point [19] to relate soot production to material properties. The Eddy Dissipation Concept (EDC) [20] assumes that the chemical reaction in a turbulent flow takes place where reactants and hot products are molecularly mixed. A detailed description of the numerical models can be found in FDS (Fire Dynamics Simulator) user guide [18].
Phase coupling conditions
The pyrolysis model of the composite material needs effective material properties for properly estimating the thermal degradation of solid fuels in a fire situation, including evaporation, charring and internal heating. Advanced measurements on temperature-dependent, composite material property information on thermal conductivity, density, heat capacity, heat of pyrolysis and reactions Arrhenius parameters would require an extensive experimental effort. Furthermore, each material component in the composite fuel may undergo several competing reactions, and each of these reactions may produce some other solid component (residue) and gaseous species. More comprehensive and complex models would be prohibitive in the framework of large CFD problems. A pyrolysis process of the charring materials gives rise to a charred surface layer and its thickness increases with time. The charred surface layer shields the heat flux and thereby limits the rate of fuel gas production. However, the presence of a forced cross flow over the composite surface facilitates crack of the charred layer. In the current model, the pyrolysis process is assumed to occur solely over the composite material surface. This simplicity allows to using a thermal equilibrium over the surface of the virgin condensed material, and the pyrolysis rate is calculated [21] with the mass balance across the interface:
Here B denotes the mass transfer number, and the convective mass transfer coefficient, hm,conv, is defined as,
Where is the density, α the thermal diffusivity, and l the local length scale. The Nusselt number and Reynolds number are defined respectively as,
The empirical constants are given as m = 0.037 and n = 4/5 for the Reynolds number beyond the value of 3 x 10⁵, and m = 0.664 and n = 1/2 for Re below that value.
The radiative mass transfer coefficient, hm,ray, is expressed as,
Here, Cp denotes the gas specific heat, Ts the surface temperature of the condensed fuel, and Tg the gas temperature. The radiation heat flux is obtained from the radiant intensity [18], I, by solving a radiative transfer equation associated with a mean absorption coefficient in a gray medium. For situations where the condensed fuel is a diffusively reflecting and emitting surface, the radiant intensity over the burning surface is calculated by using the following expression [18],
Here, denotes the surface emissivity, Ω the solid angle and rs the direction vector of the intensity. For simplicity, six bands are selected to give an accurate representation of the most important radiation bands of CO2 and H2O. For the calculation of the gray or band-mean gas absorption coefficient, a narrow-band model (RadCal) has been implemented in FDS [18]. The effect of soot concentration on radiation is included by adding the radiation coefficient of soot into that of gas [19].
The mass transfer number, B, is defined from the heat of combustion [21].
Here νF/O is the stoichiometric fuel/oxygen ratio, Hc the heat of combustion, Cpl the liquid specific heat, Lv the fuel latent heat, and the local oxygen mass fraction. The B-number approach as Eq.(1) is employed because its robustness and efficiency has been tested [21].
For the liquid fuel as kerosene, the mass transfer number, B, is defined from the mass fraction of liquid equilibrium vapor, YF,s, which is obtained from Clausius-Clapeyron equation [18].
Here YF is the gas fuel mass fraction. Once ignition occurs over the liquid surface when the mixing between the fuel vapor and air is close to the stoichiometric condition, the Eq.(6) is also used for determining the mass transfer number, B.
Even with the B-number approach, the number of properties needed is staggering and we lack the ability to accurately quantify here through bench-scale experiments. Table 1 presents the temperature-independent material property found in literature [21] for the liquid fuel (kerosene), and directly measured in our laboratory for the composite material. These parameters (Table 1) are used in the FDS [18] input file for the numerical simulations.
The condensed fuel is assumed to be thermally-thick, a one-dimensional heat conduction equation for the material temperature is solved. The surface temperature, Ts, is affected by gains and losses with the heat balance across the interface:
Here, λ is the thermal conductivity of condensed fuel.
Boundary conditions and mesh size
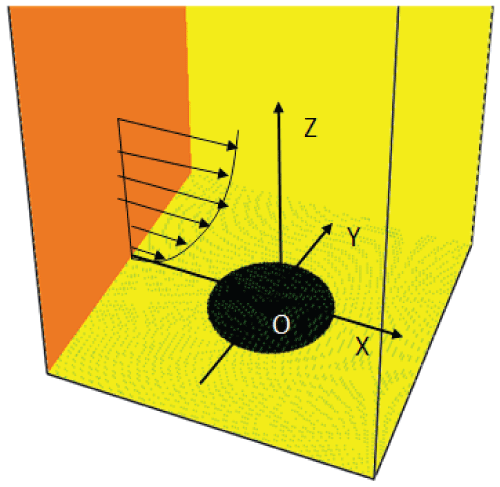
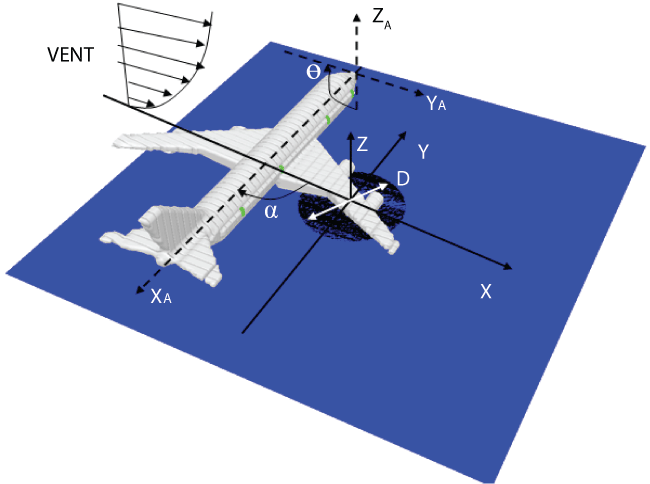
Schematic diagram of a large-scale pool fire of 19 m in diameter and the coordinate system used in the numerical simulation are shown in (Figure 1). The occurrence of a large pool fire engulfing an aircraft in cross flow is illustrated in (Figure 2). Upon encountering the perturbation induced by an aircraft in crosswind, the boundary layer probably changes rapidly from transition into a fully turbulent one. The viscous sub layer is critically dependent on the near-wall model due to important viscous effects. An extremely small grid size (mm) is required to fully resolve the turbulent boundary layer and the complex flow instabilities in the wake behind the cylinder for the high Reynolds number flow, making practical fire simulations difficult. In the present work, the computational nodes immediately adjacent to a solid wall are located in the fully turbulent region. The Couette flow is assumed to prevail near the wall surface, and the convective heat feedback is calculated from a wall function [22] far away from the wall for viscous effects to be negligible.
Here and E are the constants in logarithmic law of the wall, is the von Karman constant, Pr the Prandtl number, the non dimensional distance from the wall and P an empirical function defined by Djilali [22]. This simplicity allows faster computations and by this, a higher spatial discretization and an increase of the resolved part of the fire oscillation. Besides, predictions of the most dominant radiative heat transfer are generally less sensitive to the near-wall turbulence model. The cylindrical fuselage is approximated by using small steps of 0.15 m in height. The free-stream speed upwind of the pool fire is specified at x = 0. The velocity profile of the incoming or free-stream flow, which is assumed to be turbulent, is assigned a logarithmic one appertaining to fully-rough flow [17]. The free-stream flow conditions are imposed to the other boundaries.
As an aircraft decelerates up to zero velocity due to an engine failure, the fire transition into a quasi-static fire burning takes place above a large pool of liquid fuel. Scenarios of an aircraft post-crash fire are highly variable because of the extremely varied nature of wind conditions. Given in Figure 2 is a general schematic diagram of the aircraft engulfed in a large pool fire subjected to a wind. The coordinate system (XA, YA, ZA) in the numerical simulation is fixed at the head of the aircraft for the analysis of the incident heat flux on the skin of the aircraft fuselage, and the one (X, Y, Z) for the temperature, velocity, chemical species, etc. in gas phase. The influence of deviation in the wind speed on the behavior of the fire is studied by taking into account a speed range of 0-10 m/s.
The aircraft with a length of about 65 m and a diameter of 5.5 m is considered (for example, B747 or A350 family). The aircraft is elevated at a height of about 1.5 m from the floor. The calculations were performed using a computational mesh, which was made up of 200 × 200 × 250 cells with overall dimension of 90 m in length (x), 90 m in width (y) and 100 m in height (z). For the aircraft fire considered, the lowest peak value in HRR is about 400 MW, giving a characteristic length [18] of about 18 m. The gross features of the fire plume phenomena can be correctly described when the characteristic length is spanned by roughly sixteen computational cells, giving a grid size of about 1 m. The grid is locally refined with extra grid points being added in strong shear stress zones, such as near the pool fire surface, around the cylindrical fuselage, and in the wake region behind the aircraft. Along the length, x, cell sizes start at 0.15 m around the pool fire, and stretch to about 1 m at the free boundary. In the z direction, cell sizes are approximately 0.1 m in the vicinity of the burning zone and stretch to about 1.2 m near the free boundary. A uniform grid is used with a cell size of approximately 0.45 m in the transversal direction, y. Comparison indicates some minor changes, but the basic characteristics of the flow are unaltered when the resolved length scale in LES, is of the order of 0.2 m in the reactive zone. Nevertheless, the greatest source of error in the numerical simulation may originate from the sub-grid viscosity and the numerical diffusion both depending on the mesh size. The simulated physical time is about 180 s in transient mode with a time-step of about 10-4 s, and CPU time was of the order of two or three weeks as a function of the wind condition. The baseline grid simulations use 16 processors through parallel processing of a Linux cluster. Up to now, investigations of the large-scale fire are limited to computations on relatively coarse meshes everywhere [17].
Results and Discussion
The effects of the presence of an aluminium or composite-type aircraft in a pool fire on the major changes in the overall flame structure are investigated. The following fire scenario is considered: i) The source of spilled fuel adjacent to the engine below the wing is about 25 m far away from the fuselage; ii) Ignition is triggered by flammable conditions existing around a thermal energy source; iii) Flaming combustion is initiated and develops over the liquid fuel surface. This analysis of liquid pool fire considers only a steady-state burning after the initial stage of a fire growth.
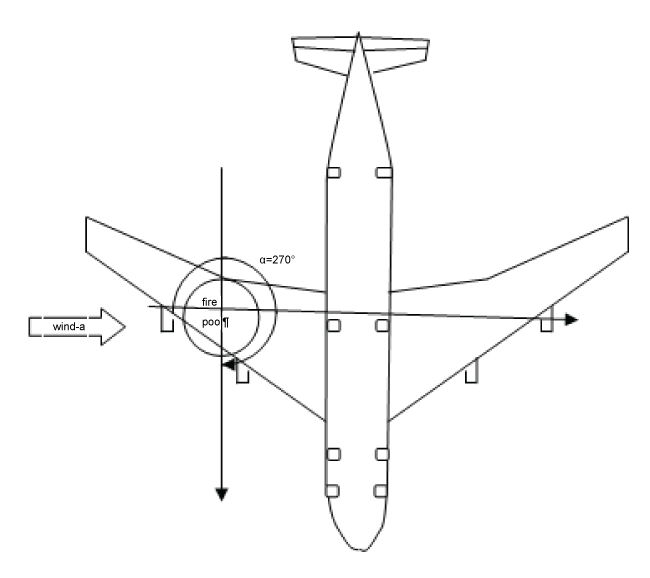
Radiative heat transfer is combined with wind-enhanced, aircraft-induced turbulence and global flame zone redirection. The wind direction directly affects the view factor from the flame to the fuselage skin, and consequently, changes in the maximum heat flux to the fuselage skin depend on the aircraft orientation. Interaction between the pool fire and the aircraft becomes the strongest when the aircraft moving direction is perpendicular to the crosswind () for the high wind speed, as shown in (Figure 3). Such a particular situation (Figure 3, ) is considered in the following section for investigating the effects of the wind intensity on the major changes in the overall flame structure.
Heat flux and burning rate of the condensed fuels
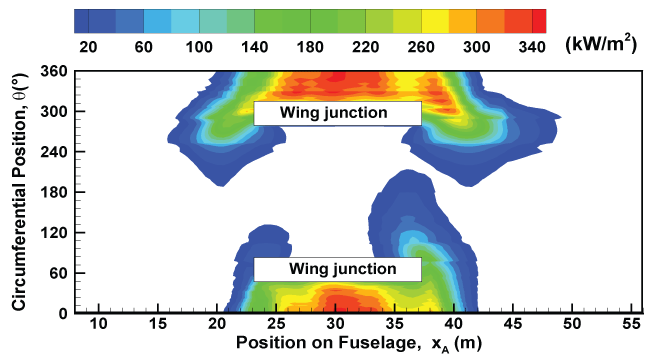
As an illustration, iso-contours of the predicted total heat flux from the flame to the fuselage skin of an aircraft are presented in Figure 4 for a high speed of 10 m/s. Note that almost the same heat flux level exists over the skin of the aluminium and composite-type aircraft. The wind speed higher than 5 m/s leads to a shallower smoke plume, and a region of increased heat flux to 340 kW/m2 occurs only underneath the mock fuselage as a result of acceleration of the flow there creating a well-mixed region which can significantly strength the heat transfer. The peak in heat flux on the fuselage skin is below 35 kW/m2 for the wind speed lower than 2 m/s. This is due to the fact that the pool fire is far away from the fuselage (about 25 m), and the weak cross flow is deflected by the buoyancy-induced air entrainment in the pool fire, preventing the flame from reaching fuselage.
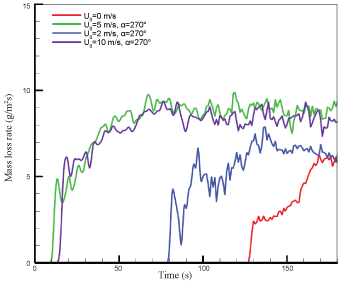
When a composite-type aircraft immerses in a pool fire, the heat flux higher than 30 kW/m2 from the flame to the fuselage skin results in a degradation of the solid material within 3 minutes. History of the mean mass loss rate of the composite material with a value in a range of 8-10 g/m2 s depending on the wind speed is presented in (Figure 5). Note that the mass loss rate of composite material is rather sensitive to aircraft orientation relative to the wind direction due to change in the radiation view factor from flame to the exposed fuselage skin. Globally, burning rate of the composite-type aircraft becomes the strongest when the aircraft moving direction is perpendicular to the crosswind (Figure 3) for the wind speed beyond 5 m/s. It is seen that during the flame spread period, the mass loss rate increases quickly when an actively burning region over the composite surface is present, and is generally higher at strong wind velocity. For a wind speed below 2 m/s, the flame stands up into a plume in front of aircraft under a buoyancy-controlled condition, and hence, about 80 s are required to starting degradation of such composite material. Increase of the wind speed strengthens significantly degradation of the composite-type fuselage due to the enhanced impact of the flame on the fuselage skin. For a wind velocity beyond 5 m/s, only 10 s is sufficient for starting degradation of the composite material. During the steady state period, the burning rate per unit area of composite material increases with wind speed up to 2 m/s, beyond this limit; it becomes largely independent of wind.
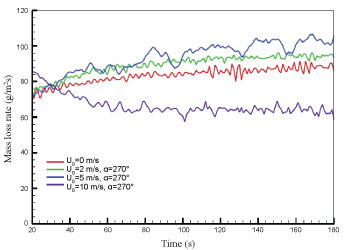
The heat feedback from the flame to the liquid pool surface affects directly the liquid heating rate to its boiling point of about 220 °C and consequently, its vaporization rate. History of the mass loss rate of the liquid fuel for the different wind intensity is presented in (Figure 6). The global regression rate is found to increase from 60 g/m2 s to a value of approximately 70 g/m2 s with a rise of the wind velocity to 2 m/s. A further increase of the wind speed to 5 m/s strengths the mixing of the reactants and induces the most rapid regression of the liquid fuel as a result of the enhanced heat flux. The high wind speed of 10 m/s greatly attenuates the radiative feedback to the liquid fuel surface due to reduction in the flame cover, thereby depressing the fuel burning rate. The mass loss rate of the liquid fuel is about 90 g/m2 s for the wind speed of 5 m/s, which represents an increase of about 30% as compared to that for a high speed of 10 m/s.
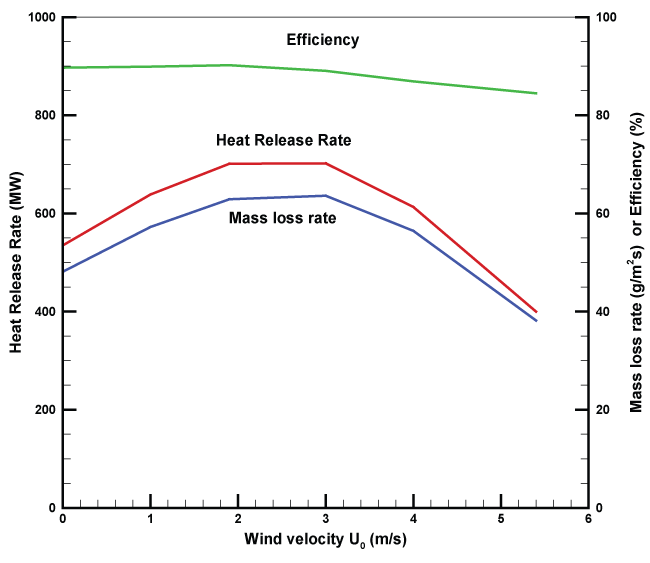
The previous works [23,24] have been carried out on the liquid pool fires without presence of large object like aircraft. In order to compare their experimental findings, we focus on a global analysis at steady-state for the calculated heat release rate (HRR), burning rate and combustion efficiency as a function of wind speed without presence of an aircraft (Figure 1). For the large-scale fire, the theoretical HRR is larger than the effective one due to the oxygen depletion. There are other complications deriving from the intermittency of the behaviors, with luminous regions of efficient combustion appearing randomly in the outer surface of the fire according to the turbulent fluctuations in the fire plume. As shown in Figure 7, the computed combustion efficiency, which is determined from the ratio between the calculated and the theoretical heat release rates, remains approximately constant with a value of 85%, consistent with the experimental findings [23]. The predicted burning rate per unit area of a liquid pool fire increases only with wind speed up to 2 m/s, beyond this limit; it becomes largely independent of wind, then decreases strongly. Several studies show a significant increase in the burning rates of large open-air pools with increased wind [24]. The maximum fuel recession rate is about 5 mm/min, which follows approximately the fuel recession rate of 6.3 mm/min measured during the course of the experiment in a 9.1 m by 18.3 m pool [1]. It appears that the burning rate of a liquid fuel in the presence of an aircraft is significantly enhanced because the stratified thermal layer flow recirculation around an aircraft improves the heat transfer from the flame to the liquid surface.
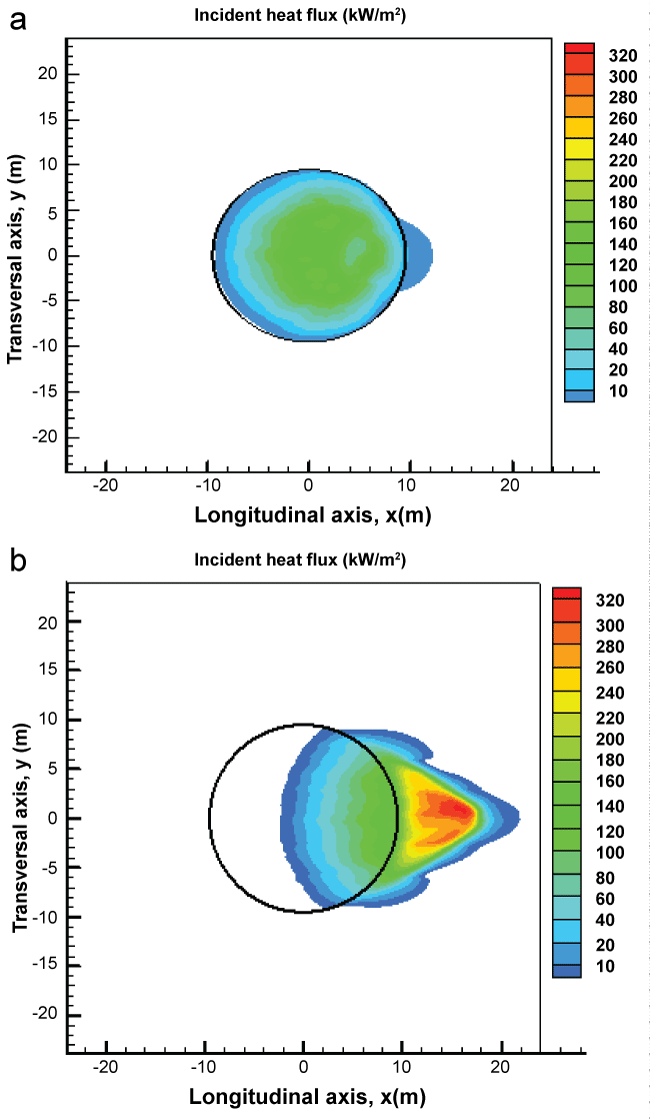
Radiative feedback to the pool surface controls the rate of burning for fire size beyond one meter [23,24]. The predicted trends of the heat flux contours for the low and medium wind speeds without presence of an aircraft are illustrated in (Figure 8). For the low wind speed (Figure 8a), moving downwind from the low heat flux region at the leading edge, the heat flux increases to 110 kW/m2 at the pool centre. Furthermore, with an increase of the wind speed to 5 m/s (Figure 8b), the plume is displaced which brings about a significant change in the radiation distribution, and hence in the rate of vaporization of the liquid fuel. The peak in heat flux shifts from the pyrolysis zone, yielding a drastic reduction in the radiative heat feedback upstream the pool center. Downstream the pool centre, the peak in heat flux is below 150 kW/m2 over the pyrolysis zone. The great influence of crosswind on the in homogeneity of the total heat flux across the surface of large liquid pool has been confirmed experimentally [25]. There are two basic burning regimes for the liquid pool fire in cross flow: radiatively-dominated burning for low wind speed and convectively dominated burning for the high wind speed. The mass loss rate of the liquid fuel is about 50 g/m2 s in quiescent condition, which represents a reduction of 15% as compared to that when the pool fire is subjected to a low wind speed of 2 m/s. The wind brings about an important mixing and a more efficient combustion which tends to increase the heat release rate. For the wind speed between 2 to 3 m/s, the total exposed liquid surface with a mean regression rate of 65 g/m2 s feeds the flame, resulting in a maximum HRR of approximately 700 MW (Figure 7). A decay phase of the regression rate of the liquid fuel up to 40 g/m2 s occurs due to the shift of the peak in heat flux from the pyrolysis zone for the wind speed beyond 3 m/s. Several studies indicate a slight decrease in burning rate at very large diameters (> 10 m), but there is not enough reliable data to accurately describe this for general cases [1]. This contributes to a reduction in HRR of about 35% as compared to that of a low wind speed. In hydrocarbon large-scale fires, the fuel-rich region near the pool surface can greatly attenuate radiative feedback to the fuel, thereby depressing the mass burning rate. As a consequence, the heat feedback to the pyrolysis surface is less than 10% of the heat released by combustion.
Distribution of the thermal plume
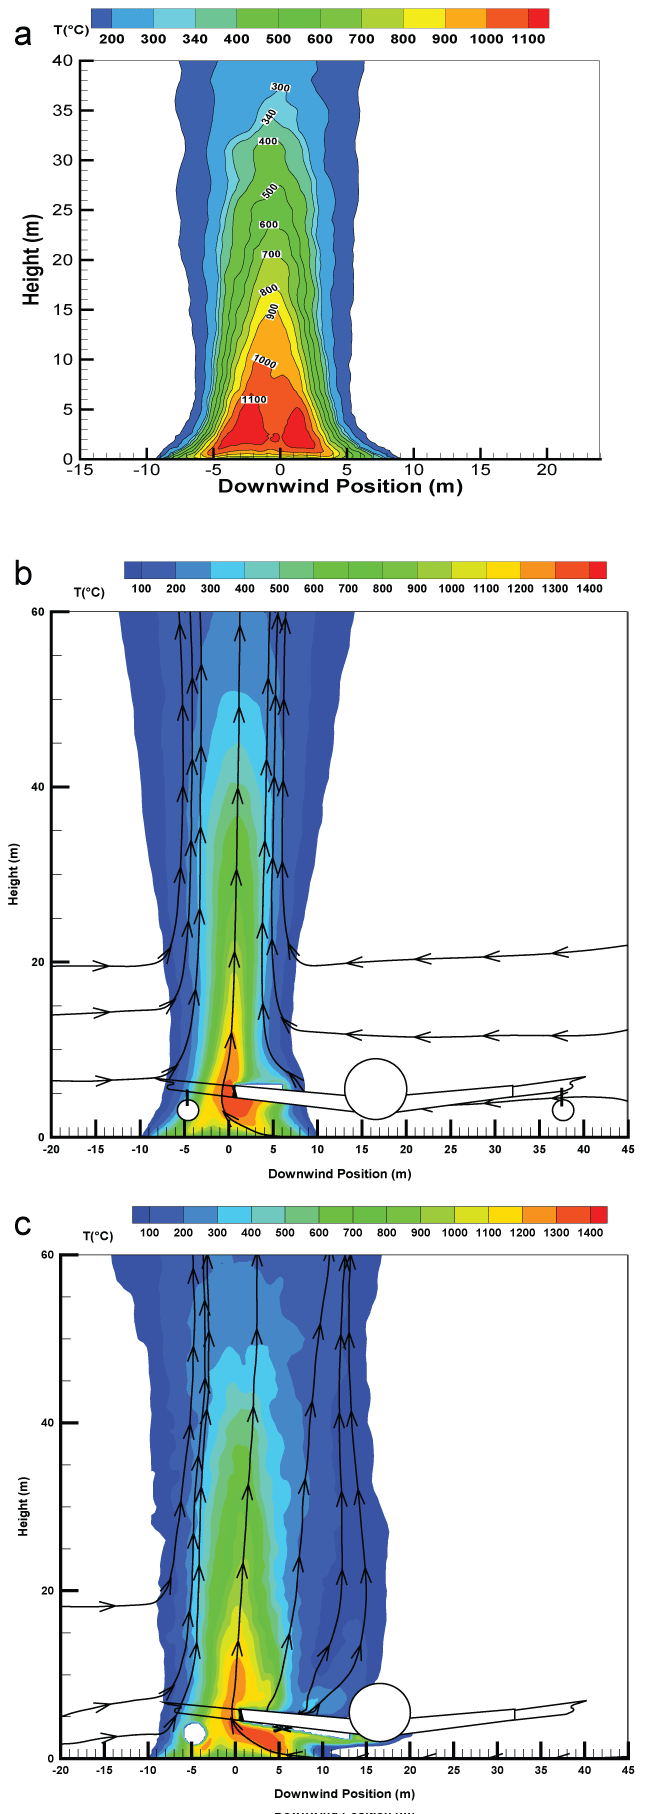
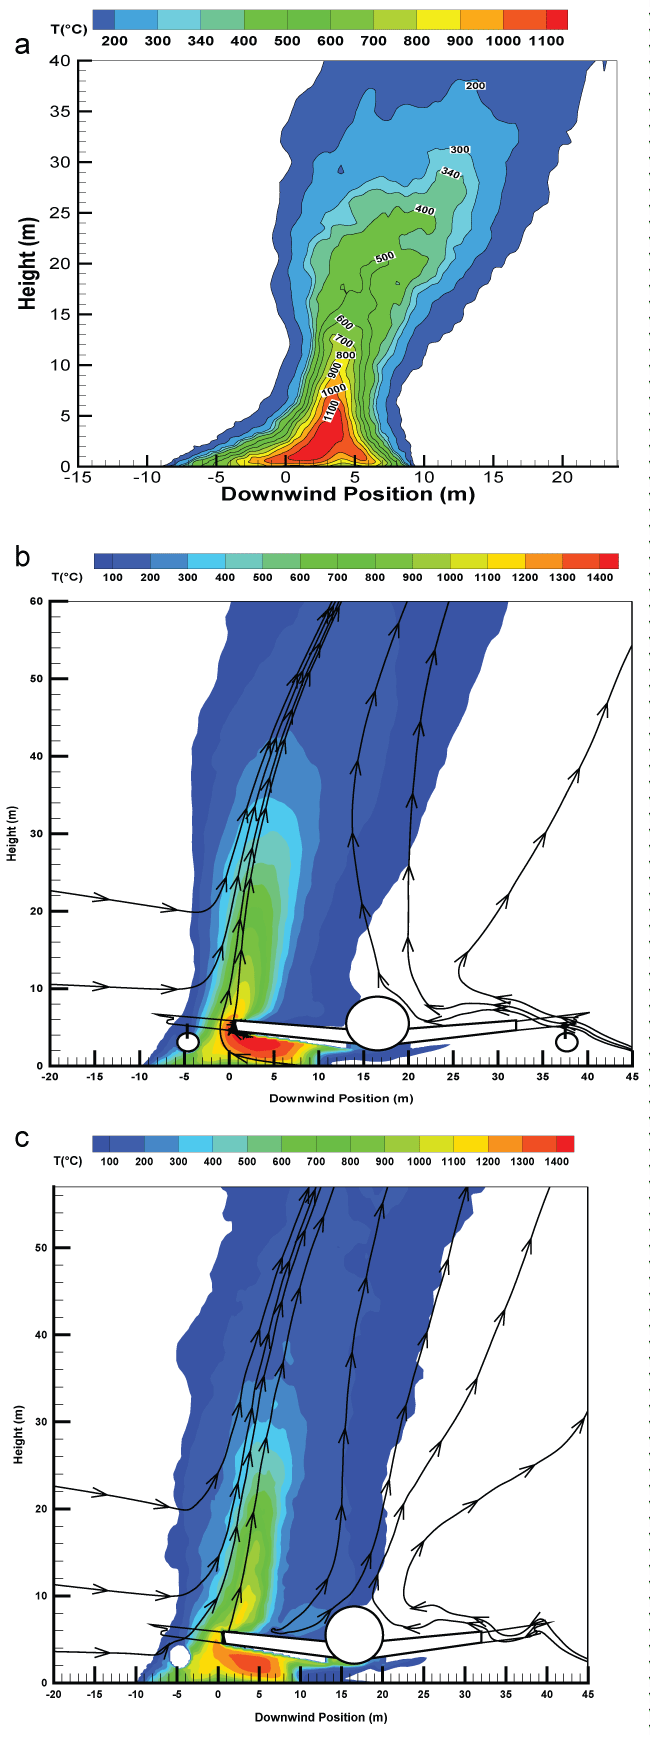
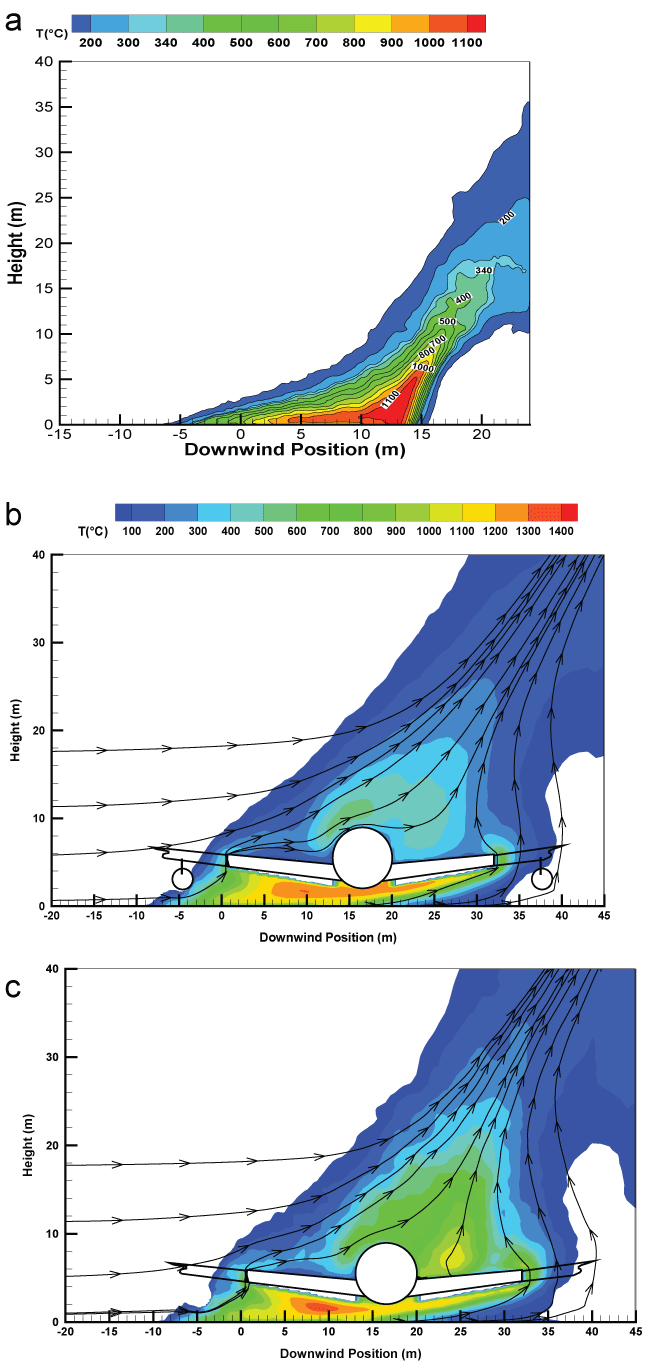
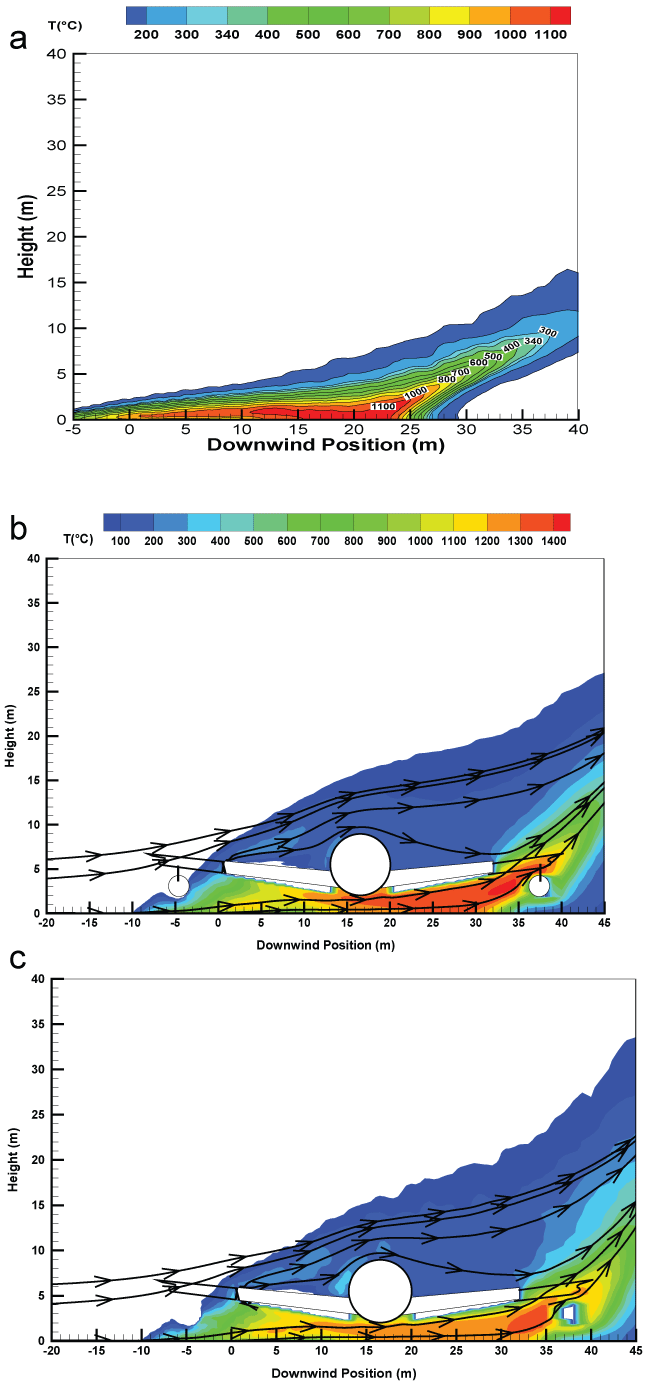
Given in Figure 9, Figure 10 and Figure11 and Figure 12 are the iso-contours of the time-averaged temperature from the liquid pool fire of about 19 m in diameter over the central plane. The major changes in the overall flame structure with the presence of an aircraft for the various wind speeds are described as follows.
1) Under a quiescent condition Figure 9, fresh air buoyantly entrained feeds the flame with oxygen and cools the smoke influencing natural convection and then air entrainment. Without the presence of an aircraft, this quiescent pool fire consists of a buoyancy dominated flame with a peak temperature of about 1100 °C. With the presence of an aircraft, the main part of the flame, i.e., the primary flame zone, is essentially vertical, but it is perturbed producing highly-mixed, and therefore highly combusting regions with a peak temperature of 1400 °C. Moreover, for the composite-type aircraft Figure 9, there is an excess of fuel due to degradation of the composite material over the wing skin. This situation induces an increase in the thermal plume volume resulting from the fire growth.
2) The cross-flow with a low wind speed Figure 10 is slightly deflected near the fire source as a result of an enhanced thermal blockage by the buoyancy forces. Air entrainment and wind velocities are practically of the same order of magnitude. Nevertheless, the presence of an aircraft (Figure 10) restricts the development of a boundary layer diffusion flame near the leading edge, and produces highly combusting regions on the leeward side of the liquid pool with a peak temperature of about 1400 °C. It appears that the main part of the flame, i.e., the primary flame zone is not significant affected by the presence of a composite-type aircraft (Figure 10).
3) A further increase of wind speed to 5 m/s Figure 11 enhances the interaction between the cross-flow and pool fire, characterized by an elongation of the flame in the downstream direction. Presence of an aluminium-type aircraft Figure11 downstream a pool fire facilitates the global flame shape alterations which are combined with global enhancements in turbulent mixing. The region directly surrounding just in front of the aircraft is immersed in the highly combusting zone with a peak temperature of about 1300 °C due to complex wind/vorticity interactions. Flow is moving over the top of the aircraft creating stream wise vortices. This situation induces an increase of the flame cover over the top of the aircraft with a temperature level of about 500 °C for an aluminium type aircraft Figure 11 and 700 °C for a composite one (Figure 11). Besides, on the leeward side of the aircraft, the enhanced convective transport, as a whole, leads to a significant flame drag with a temperature of 1300 °C.
4) For the high windward flow of U0 = 10 m/s Figure 12, the strong acceleration of the air flow over the burning surface of the liquid fuel allows to a significant elongation of turbulent boundary layer diffusion flame. Presence of an aircraft induces a major change for the length of the flame and the buoyant thermal plume of about 200 °C over the top of the aircraft. The fuel-rich flow can be ejected from underneath of the aircraft Figure 12, and this creates a second flame zone with a temperature of 1400 °C on the leeward side of the aircraft due to enhanced mixing by the presence of the vortices in the wake behind the aircraft. For the composite type aircraft, the magnitude of the wind speed is sufficient to direct the flame to the bottom surface of the fuselage. This causes an excess of the fuel gas from the pyrolysis of the fuselage skin. Combustion beneath belly of fuselage is probably close to rich limit of flammability due to a decrease in the oxygen concentration there. Consequently, the presence of a composite-type aircraft Figure 12 results in a reduction in temperature of approximately 200 °C beneath belly of fuselage as compared to an aluminium-type one (Figure 12).
Flame length and its height
Illustrations in Figure 9, Figure 10, Figure11 and Figure12 allow demonstrating the competition between the buoyancy and inertia forces. Globally, the flame propagation over condensed fuel surface occurs in two successive modes. In the first mode, when the flame is confined within a boundary layer which is slightly disturbed by the buoyancy forces. The flame is progressively elongated in the downstream direction with a flame shape practically independent of the wind velocity. Transition to the second mode, occurring earlier at low wind velocity where the flame stands up to form a buoyant plume. The second mode is evident from a sharp rise of the flame height where the ratio (Froude number) of the horizontal and the upward forces in the flow stream is low. According to the observation, we tend to establish some relations for the flame height and length only in absence of an aircraft.
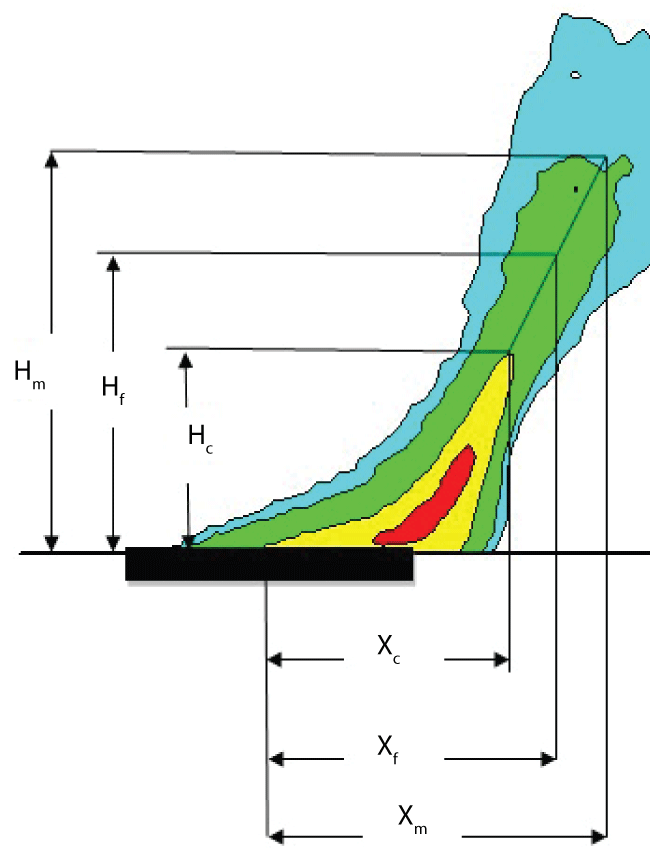
Turbulent flames exhibit the large spatial and temporal variations of the flame, named as a pulsing behavior. According to a mapping flame luminosity technique [26] using a camera, the mean flame length/height (Xf/Hf) can be derived from the maximum flame ones (Xm/Hm) and the continuous ones (Xc/Hc) corresponding to the flame presence probability of 0.05 and 0.95, respectively. It was checked that the so-determined persistent flame shape, as defined in Figure 13, can be expressed as, Xf = 0.5 (Xm+ Xc) and Hf = 0.5 (Hm+ Hc), corresponding to a gas temperature of about 450-500 °C. Determination of the time-averaged flame extent (500 °C) is of particular concern in considering the ignition of adjacent objects by radiation, and as a consequence, the flame propagation. Zukoski [27] proposed a non-dimensional continuous flame height for a large-scale pool fire in a quiescent condition, including the effect of the pool diameter as:
Here Q* is the fire characteristic dimension [27]. Putnam [13] established the experimental relations between the flame shape and cross flow velocity without presence of an object within the fire in intermediate scale. However, for the large scale fire considered in crosswind, the calculated flame extent is significantly smaller than the Putnam's correlation for the low wind speed (), and larger beyond that wind speed. It is well known that reduced-scale tests do not necessarily reflect the behaviour of large fire situations due to the development of turbulence and radiation loss as soot levels rise upto a value where the fire is effectively optically thick and saturated. Apte, et al. [28] had already pointed out that these existing relations may no longer apply to a large-scale fire due to the negligence of the scale effects in correlation. Nevertheless, with the help of the analysis of Putnam [13] for a fire in cross flow, the following relations are established from best fit of the numerical results, as,
Here Fr is the Froude number defined from the cross flow velocity and the flame height (Eq.10), as
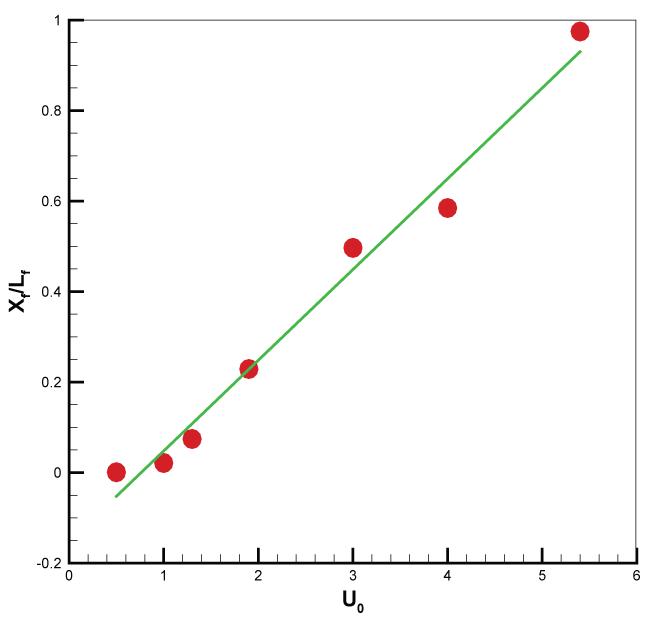
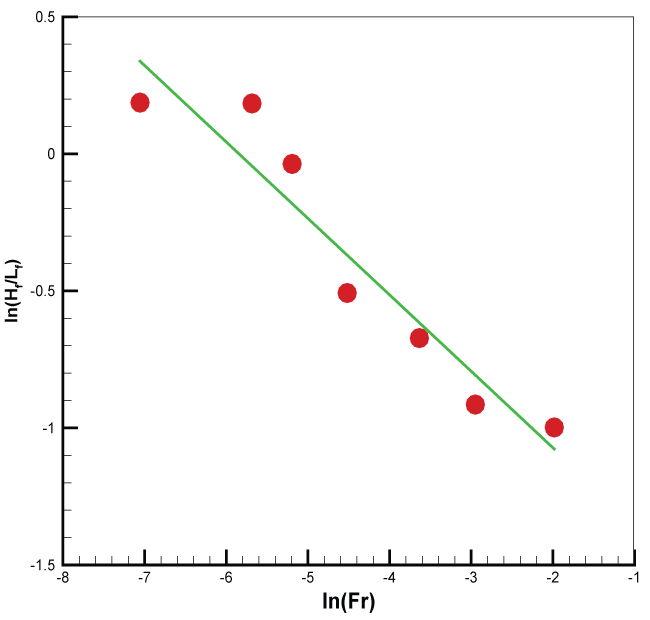
Figure 14 shows that the predicted flame length normalized by the flame height Lf appears as an increasing function of the wind speed. The linear relation of the flame extent with the wind velocity is consistent to the experimental observation of Kolb [26]. In the presence of an aircraft, the flame length correlation (11) should be multiplied by a factor of about 1.8 for the wind velocity beyond 5 m/s. As illustrated in Figure 15, a decreasing function of the Froude number with a power of 0.27 is found for the predicted flame height Hf normalized by Lf. It is found that the flame height is not significant affected by the presence of an aircraft, and its correlation can be approximately used in all the cases.
Profiles of temperature and velocity
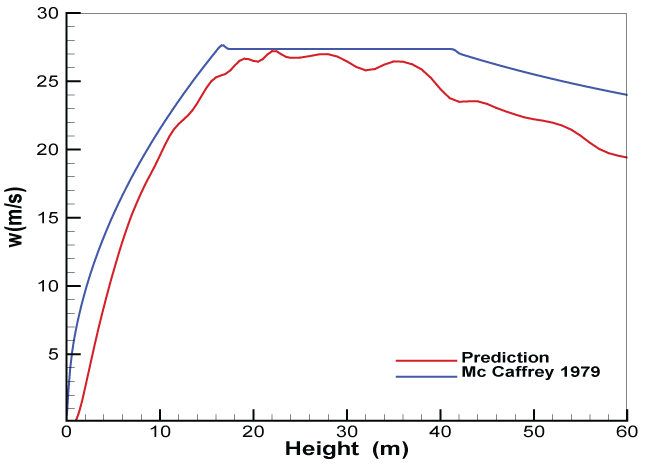
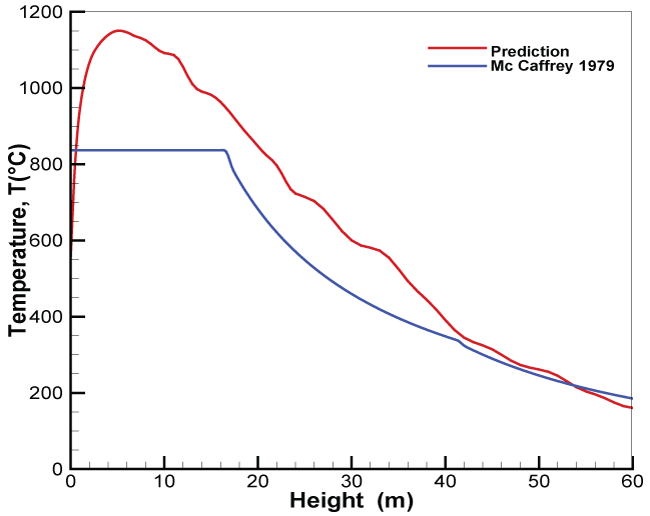
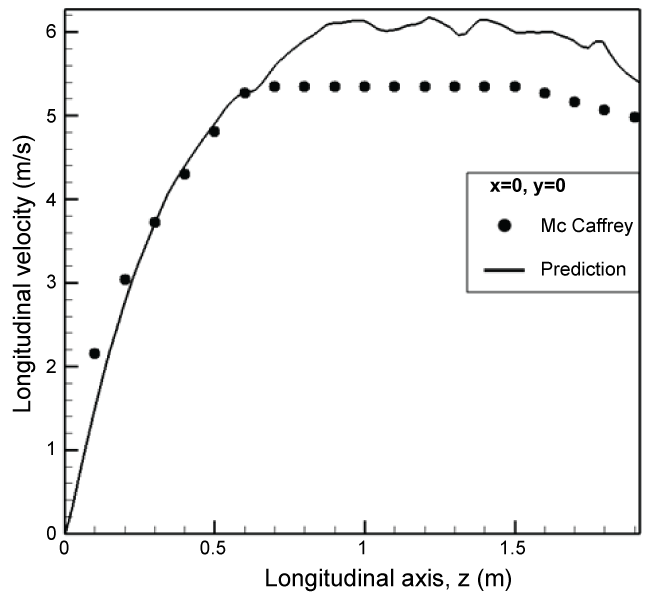
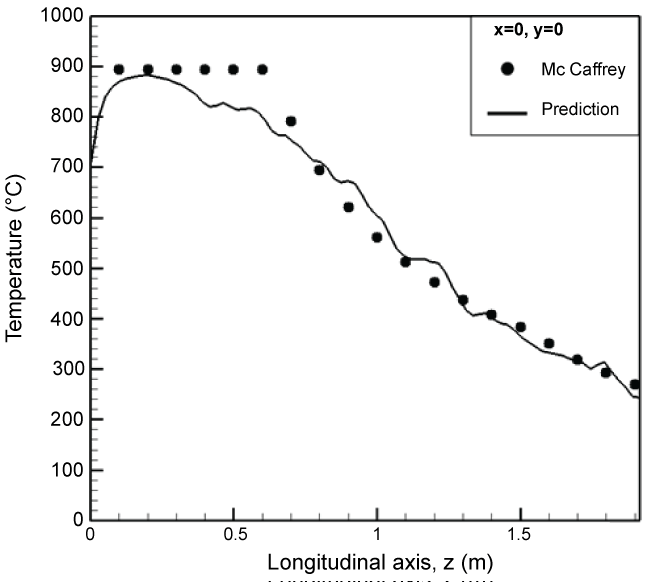
During a fire, determination of the velocity and temperature profiles is of particular concern in considering the dispersion of the combustion products. Under a quiescent condition Figure 9, McCaffrey [29] established some relations for temperature and axial velocity from the experimental data by using a square methane burner of 0.3 x 0.3 m2 for a heat release rate in a range of 15 to 60 kW. We tend to compare the profiles of the predicted gas temperature and vertical velocity along the centerline with McCaffrey's correlation [29]. It is found that the burnt gas is strongly accelerated in the persistent flame zone and then stabilized above the intermittent flame zone. As shown in Figure 16, the peak in axial velocity occurs at a height of about 15 m from the burning surface. Overall, evolution of the predicted axial velocity is in good agreement with the correlation in the first two zones of the flame. In the thermal plume region, the predicted velocity follows only the decreasing trend of the McCaffrey's correlation. As illustrated in Figure 17, the peak in the predicted temperature occurs where the mixture is within the flammability limits in a large premixed region far away from the pyrolysis surface. In fact, for a large scale fire, above the pyrolysis surface, pulsating flame occurs as the oxygen starvation begins and the oxygen-lean fuel-rich hot layer is being formed. Burning has occurred in a lack of oxygen, the excessive pyrolysis products are accumulated at the fire base. Finally, more fuel exists near the pyrolysis zone than the air required for its complete combustion, the flame exhaust, said the ventilation-controlled fire occurs near the pyrolysis zone. The effects of flame exhaust on the temperature rise near the pool surface cannot be taking into account by the McCaffrey's correlation. Except for the region close to the pyrolysis zone, decrease of the predicted temperature along the centerline follows closely the correlation trend above the intermittent flame zone. For verifying the scaling effect on the temperature and velocity distributions, pprofiles of the predicted gas temperature rise and vertical velocity from an intermediate pool fire size of 0.75 m are also compared with McCaffrey's correlation in (Figure 18, Figure 19). For such reduced-scale pool fire, the flame is attached to the burner base, said fuel controlled fire, and there is sufficient oxygen available for combustion. The predicted temperature and velocity are in good agreement with the McCaffrey's correlations. This implies that the difference between the prediction and correlation for the temperature in the fuel-rich zone will become progressively significant as long as the pool fire scale is beyond 1 m.
Conclusion
The present CFD results, although preliminary, indicate that wind speed plays a dominant role on the heat flux distribution, and consequently, the burning rate of liquid pool fire. The competition between the buoyancy and inertia forces dominates the proper flame characteristics, inducing a major change from a buoyant plume to a boundary layer diffusion flame. The importance of considering the presence of an aircraft in the fire environment is noted for the wind speed beyond 5 m/s. For large scale fires, a difference between the predicted temperature/axial velocity and existing experimental relations derived from an intermediate scale fire, is significant.
Currently there are still many limitations to its precise application to large scale fires due to turbulence development. Scenarios of a real large-scale fire are highly variable because of the extremely varied nature of wind conditions. Although the fire dynamic behaviour in large-scale is qualitatively correct, any attempt to draw quantitative conclusion is discouraged due to uncertainties introduced by large grid size which is primarily a problem of computational economy, and other idealizations inherent in the model. Presently, analysis of these relations is primarily limited to characterization of the fire in the absence of other influencing factors such as the atmospheric conditions with the fluctuations in wind speed and direction. A negligence of the unavoidable deviations of wind speed/direction from their average values in the numerical simulation may induce large difference from the real fire situation. More comprehensive pyrolysis model in addition to the effects of liquid motion on the vaporization rate of the liquid fuel should be further investigated.
Acknowledgements
This study is sponsored by the European Project Aircraft Fire under Contract number FP7-2010-265612-CP.
References
- Babrauskas Vytenis (1983) Estimating large pool fire burning rates. Fire Technology 19: 251-261.
- Peatross MJ, Beyler CL (1997) Ventilation effects on compartment fire characterization. In: Fire Safety Science-Proceedings of the Fifth International Symposium 5: 403-414.
- Utiskul Y (2006) Theoretical and experimental study on full-developed compartment fires. Fire Engineering, University of Maryland, USA.
- Tewarson A, Lee JL, Pion RF (1981) The influence of oxygen concentration on fuel parameters for fire modelling. Symp (Int) Combust 18: 563-570.
- Orloff Lawrence, John De Ris J (1982) Froude modelling of pool fires. Symposium (International) on Combustion 19: 885-895.
- Karlsson Bjorn, Quintiere James (1999) Enclosure Fire Dynamics. CRC Press, FL.
- Anthony P Hamins, Jiann C Yang, Takashi Kashiwagi (1999) A global model for predicting the burning rates of liquid pool fires. NIST.
- Beaulieu Patricia A, Dembsey Nicholas A (2008) Effect of oxygen on flame heat flux in horizontal and vertical orientations. Fire Safety J 43: 410-428.
- Novozhilov V (2001) Computational fluid dynamics modelling of compartment fires. Prog Energy Combust Sci 27: 611-666.
- Snegirev A Yu (2004) Statistical modelling of thermal radiation transfer in buoyant turbulent diffusion flames. Combust Flame 136: 51-71.
- Jill Suo-Anttila, Louis Gritzo (2011) The effects of wind on fire environments containing large cylinders. Combustion Science and Technology 181: 68-77.
- M Lavid (1977) Gravitational effects on chemically reacting laminar boundary layer flows over a horizontal flat plate. Symposium (International) on Combustion 16: 1157-1158.
- Abbott A Putnam (1965) A model study of wind-blown free burning fires. Symposium (International) on Combustion 10: 1039-1046.
- Anders Lönnermark, Haukur Ingason (2006) Fire spread and flame length in large-scale tunnel fires. Fire Technology 42: 283-302.
- NR Keltner, W Gill, LA Kent (1994) Simulating fuel spill fires under the wing of an aircraft. Fire Safety Science 4: 1017-1028.
- Greiner Miles, Suo-Anttila Ahti (2004) Validation of the Isis-3D computer code for simulating large pool fires under a variety of wind conditions. Journal of Pressure Vessel Technology 126: 360-368.
- YL Sinai, MP Owens (1995) Validation of CFD modelling of unconfined pool fires with cross-wind: flame geometry. Fire Safety J 24: 1-34.
- Kevin B McGrattan, Randall J McDermott, Craig G Weinschenk, et al. (2013) Fire Dynamics Simulator - Technical Reference Guide. (6th edn), NIST Special Publication.
- T Beji, J Zhang, Delichatsios M (2008) Determination of soot formation rate from laminar smoke point measurements. Comb Sci and Tech 180: 927-940.
- Bjorn F Magnussen, Ivar S Ertesvag (2000) The eddy dissipation turbulence energy cascade model. Combustion Science and Technology 159: 213-235.
- A Murty Kanury (1984) Introduction to Combustion Phenomena, Gordon, New York.
- N Djilali, I Gartshore, M Salcudean (1989) Calculation of convective heat transfer in recirculating turbulent flow using various near-wall turbulence models. Numerical Heat Transfer 16: 189-212.
- V Babrausks (2002) SFPE Handbook of Fire Protection Engineering. (3rd edn), National Fire Protection Association, Quincy.
- Lois E, J Swithenbank (1979) Fire Hazards in Oil Tank Arrays in a Wind. Symp (Int.) on Combustion 17: 1087-1098.
- Koseki JA, Gritzo LA, Kent LA, et al. (1996) Actively cooled calorimeter measurements and environment characterization in a large pool fire. Fire and Materials 20: 69-78.
- Gilles Kolb, Jose L Torero, Jean-Michael Most, et al. (1997) Cross flow effects on the flame height of an intermediate scale diffusion Flames. Proceedings of the Korea Institute of Fire Science and Engineering Conference 169-177.
- EE Zukoski, BM Cetegen, T Kuubota (1985) Visible Structure of Buoyant Diffusion Flames, Symposium (International) on Combustion 20: 361-366.
- VB Apte, Bilger RW (1991) Wind aided turbulent flame spread and burning over large-scale horizontal PMMA surfaces. Combustion and Flame 85: 169-184.
- Bernard J McCaffrey (1979) Purely buoyant diffusion flammes : Some experimental results. Centre for Fire Research, National Bureau of Standards, Washington D. C.
Corresponding Author
HY Wang, Institut P', Fluides-Thermique-Combustion, Universite de Poitiers, France.
Copyright
© 2017 Wang GD, et al. This is an open-access article distributed under the terms of the Creative Commons Attribution License, which permits unrestricted use, distribution, and reproduction in any medium, provided the original author and source are credited.

