Characterizing the Soils of Asossa Agricultural Research Center Farm, with Closer Evaluation of Fertility Status, Asossa Western Ethiopia
Abstract
The study aims to analyze the morphological, pedonogical and physic-chemical properties of the soils of part of Asossa Agricultural Research Center, to improve agricultural productivity of the farm. Two soil profiles were opened to represent the identified site units of the study area, examined and described. Samples were collected from the two pedons according to the natural pedogenic horizons identified, analyzed for both physical and chemical properties and characterized. Soil profiles were described as per FAO-WRB soil profile description guidelines. Both pedons with soft, very firm, very sticky and very plastic consistence characteristics were common in the lower underlying horizons. The surface horizon bulk density value ranges from 1.04 to 1.10 g.cm-3. The highest (35%) field capacity values were observed in the subsoil horizon (100-200 cm) and (45-120 cm) for pedons 1 and 2 respectively. The lowest (25%) field capacity values were observed in the subsoil horizon (20-35 cm) of pedon 1. The pH value of the Al+3with depth of the soil horizon of both pedons. The very low organic carbon and medium to very low total nitrogen content in the study area indicates low fertility status of the soil. Available P showed almost constant distribution and below the critical crop requirement with depth of the studied soil pedons. The status of the Ca in the tested soils ranges from low to medium in sub surface and surface horizon respectively. The exchangeable K in studied soils had 0.1 Cmol (+) kg-1 through all horizons and indicated the soil of the area is deficient of K nutrient. It also had a humic soil property with organic carbon content greater than 1% as weighted average over a depth of 100 cm from the soil surface and recognized meeting a humic qualifier at third unit level of classification. The soils represented by both pedons were classified as humic-dystric nitisols.
Keywords
Soil, Morphological, Physical, Chemical, Pedon, Profile, Horizon
Introduction
Soil is the most important resource required for Agricultural production [1]. Soils have many variables, which have multiple types of characteristics. The variables influence not only the pedogenesis and development, but also the uses and productivity of soils. Therefore, in order to understand the similarities, dissimilarities and relationships among different soil types, it is important to study the physico-chemical properties of soils under land use. The existence of various types of soils in different parts of Ethiopia is related to the variability of soil forming factors in type, degree and intensity. Soil types and characteristics show great variations across the various regions of Ethiopia. Agricultural land productivity is related to these various soil characteristics [2]. Natural conditions, such as geology, climate, topography, biotic and land use/ land cover changes are largely responsible in creating regional and local differences in soil types and characteristics. However, although knowledge on soil physical and chemical characteristics plays a vital role in enabling production and productivity of the agricultural sector on sustainable basis and to undertake research in the Asossa Wereda, there is no much information about the soils of the research farm of the studied area as well as the Asossa Wereda as a whole.
The term structure relates to the arrangement of primary soil particles into aggregates or peds. The formation and maintenance of a high degree of aggregation are among the most difficult tasks of soil management, and yet they are among the most important properties, since they are a potent means of influencing ecosystem function [3]. Texture is an important soil physical characteristic because it in part, determines water intake rate (infiltration), water storage in the soil, the ease of tilling the soil, the amount of aeration (vital to root growth), and also influence soil fertility [4].
The depth of profile, organic matter content, pH, percent base saturation and type of clay mineral are affected by the type of climate in a given area [5]. Vegetation affects the amount and type of organic matter added to a soil [6] and this tends to significantly affect soil structure, colour, pH, CEC, infiltration and water holding capacity of soils [7]. The physical properties of soil such as soil colour, texture, structure, density, porosity and water content are the dominant factors affecting the use of a soil [8]. They have crucial role in describing several productivity level of a given area [7]. Most of them change with land use-system and its management such as cultivation and its intensity, the instruments used, and the nature of the land under cultivation as well as management of crop residues and application of manure. Therefore specifically, the objective of the study was to characterize and classify the soils of the study area using the criteria of the World Reference Base for Soil Resources soil legend.
Materials and Methods
Description of the study sites
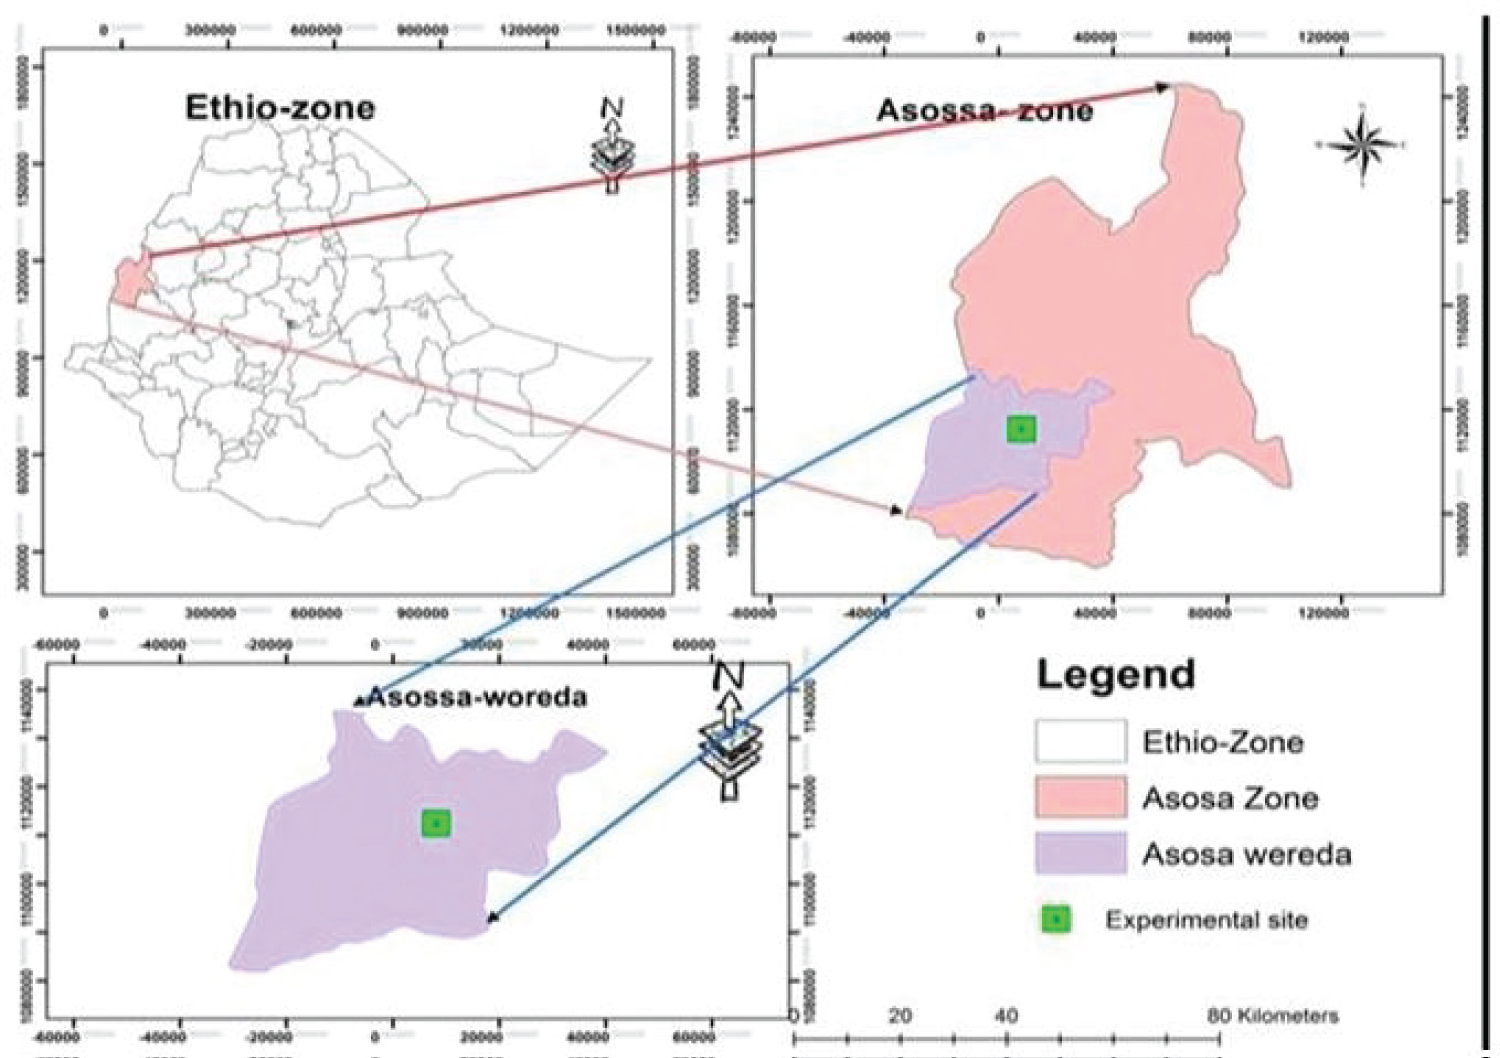
The experiment was conducted in Benishangul Gumuz Regional State, at Asossa Agricultural Research Center (AsARC) research farm in 2016/17 main cropping season under rain fed field condition. Benishangul Gumuz Regional State is geographically located at 9°30' to 11°39''N latitude and 34°20' to 36°30''E longitude covering a total land area of 50,000 square kilometer. The study site is located at 10°02'05''N latitude and 34°34'09''E longitudes. The study area is situated east of Asossa town and west of Addis Ababa about 4 and 660 km distance, respectively. Asossa has unimodal rainfall pattern, which starts at the end of April and extends to mid-November, with maximum rainfall received in June, to October. The total annual average rainfall of Asossa is 1275 mm. The minimum and maximum temperatures are 16.75 and 27.92 °C, respectively. The dominant soil type of Asossa area is Nitosols with the soil pH ranging from 5.0 to 6.0 (Figure 1).
Site survey and sampling
The study area was surveyed using the grid method based on the slope of the land. An initial reconnaissance survey of the study area was done to identify the external features (local indicators of soil fertility), followed by transect walks and selection of representative transect sampling points. Representative soil pedon sampling sites were selected based on the land use. A total of two soil pedons were opened (cultivated and uncultivated) from representative land of Asossa Agricultural farm that located at Amba 12 kebele. The coordinates and elevation of the study area were taken with the aid of a portable global positioning system (GPS). The depths of the pedons varied depending on land form of the site in relation to soil profile development. A 2m*2m area, and 2m depth for uncultivated pedon 1 and 2m*2m, and 1.2 m depth for cultivated pedon 2, soil pit was excavated at representative spot in the research station from cultivated and uncultivated land. The soil pedon was described in situ following guide lines for soil description [9]. All profiles were sampled according to the identified natural horizons from bottom to the top and carefully labeled for laboratory studies. Lastly soil samples were collected from every identified horizon of the pedon.
Soil sampling and analysis
The soil samples collected from each horizon of the soil pedon were air dried and ground to pass through 2 mm sieve for all the soil parameters to be studied except for total nitrogen and organic carbon which were passed through 0.5 mm sieve to remove the coarser materials. Finally, the soil pedon samples were analyzed for selected agriculturally relevant soil physicochemical properties at the Regional Soil Laboratory in Benshal-gul Gumuz following the standard analytical procedures.
Two soil pedons were opened (uncultivated and cultivated land) from representative landform to characterize and classify the soil of study area. Field observation, pedon opening, horizon designations, pedon description and sampling of freshly opened soil pedons were carried out using the procedures of FAO [9] guidelines. The Munsell soil color chart [10] was used to identify soil colors both in moist and dry conditions. Unfortunately, uncultivated pedon 1 was opened on site covered with annual grass and the second pedon was opened on ploughed site recently. Soil morphological characteristics such as soil color, structure, and soil consistence were described in the field during soil sample collections. The soil samples collected from the soil profile on genetic horizon basis were air dried and ground to pass through a 2 mm size sieve in preparation for the analysis of all soil properties. Finally, the soil profile samples were analyzed for physicochemical properties at the Benshal-gul Gumuz Soil Laboratory using standard analytical procedures.
The undisturbed core samples were used from all horizon for the determination of dry bulk densities and soil moisture contents. The soil physical properties analysed in the laboratory, included soil moisture content, soil texture, bulk density and particle density. The moisture contents at field capacity (FC) and permanent wilting point (PWP) were measured at -1/3 and -15 bars soil water potential, respectively, using the pressure plate apparatus [11].
Available water holding capacity (AWHC) was then obtained by subtracting PWP from FC. Determination of particle size distribution was carried out by the Bouyoucos hydrometer method as described by Okalebo, et al. [12]. Hydrogen peroxide (H2O2) was used to destroy the organic matter and sodium hexa-metaphosphate (NaPO3) was used as dispersing agent. Once the sand, silt, and clay separates were calculated in percent, the soil was assigned to a textural class based on the soil textural triangle [13]. Particle density (Pd) was estimated by the pycnometer method as described by Blake. Total porosity was estimated from the bulk density (Bd) and particle density (Pd) as:
Total porosity (%) = [1-(Bd/Pd)] × 100
The chemical properties studied included pH, CEC, exchangeable acidity, exchangeable bases (Ca, Mg, Na, K), organic carbon, total nitrogen, and available P) were analyzed for all horizon of both pedon.
Soil pH was determined using a pH meter with combined glass electrode in water (H2O) at 1:2.5 soil:water ratio as described by Carter [14]. Organic carbon was determined by oxidizing carbon with potassium dichromate in sulfuric acid solution following the Walkley and Black method [15]. Finally, the organic matter content of the soil was calculated by multiplying the organic carbon percentage by 1.724. The total nitrogen contents in soils were determined using the Kjeldahl procedure by oxidizing the organic matter with sulfuric acid and converting the nitrogen into NH4+ as ammonium sulfate [16]. Exchangeable acidity was determined by saturating the soil samples with potassium chloride solution and titrated with sodium hydroxide as described by Mclean [17]. Available phosphorus was determined in Olsen methods. In the Olsen procedure, the soil samples were shaken with 0.5M sodium bicarbonate at nearly constant pH of 8.5 in 1:20 of soil to solution ratio for half an hour and the extract was obtained by filtering the suspension as indicated by Olsen, et al. [18].
Exchangeable bases (Ca, Mg, K and Na) in the soil were estimated by the ammonium acetate (1M NH4O Ac at pH 7) extraction method. In this procedure, the soil samples were extracted with excess of NH4O Ac solution, and Ca and Mg in the extracts were determined by atomic absorption spectrophotometer, while flame photometer was used to determine the contents of exchangeable K and Na as described by Rowell [13]. Soil cation exchange capacity (CEC) was measured after leaching the ammonium acetate extracted (ammonium ion standard) soil samples with 10% sodium chloride solution. The cation exchange capacity of the clay fraction was estimated by dividing the CEC of the soil by the percentage of the clay and then multiplied by hundred and expressed as cmol (+) kg-1 clay. Finally, the percent base saturation (PBS) was computed as the ratio of the sum of the exchangeable bases to the CEC of the soil as:
Results and Discussion
Morphological properties of soil pedons
The results of pedon description and laboratory analysis of soil physical and chemical properties are presented and discussed in the following subsections. Four horizons (A, AB, Bt1 and Bt2) for pedon 1 (uncultivated) and three horizons (Ah, BA and Bt) for pedon 2 (cultivated) were identified. The morphological properties of the soil are given in Table 1. Soil color of the surface horizon of uncultivated was 2.5YR 2.5/1 when moist and 2.5YR 3/3 when dry (Table 2). The dry colors of the surface horizons contained the same hues Munsell notations but increased by one to two units of value and chroma from the moist colour. The increase of dry value and chroma over moist colour might be due to the reflection of light under dry soil and moist soil adsorbed the light. In uncultivated pedon1 the colour ranges from reddish black (2.5YR 2.5/1) to very dusk red (2.5 YR 2.5/2) to dusky red (10 R 3/4) and finally to dark reddish brown (2.5 YR 3/4) from top to down within depth under moist condition. The top soils dark colour of this pedon could reflect the higher amount of organic matter of the surface soil than subsurface soil. This result is similar with Tadele and Alemu, who reported that relatively dark brown surface soil colour could be attributed to a relatively high content of organic matter of the surface soils.
The existing slight variability in structure characteristics could be related to horizons in the pedon and contents of organic matter. Both pedons of the top soil (A & Ap horizon) had strongly coarse granular that changed to a moderately fine angular blocky with depth under lower horizon (Bt1, Bt2 and Bt horizon) in secondarily structure. The angular blocky structure of sub surface horizon is slightly in line with De Wispelaere, et al. [19] that characterized the nitic horizon of nitosols south western Ethiopia as well-developed blocky soil structure. The development of blocky structure types could be related to the low level of organic matter, reduction in abundance of plant roots and higher clay percentage of subsoil horizons.
With depth of the both pedons soft, very firm, very sticky and very plastic consistence characteristics were common in the lower underlying horizons. This result might be the change in consistence characteristics from surface to subsurface soil horizons reflects the high contents of clay and low contents of organic matter of subsoil horizons. In all of the horizons the boundary topography was described to be smooth but changing from a diffuse to gradual distinctness with depth of the pedon (Table 3). The gradual and diffuse boundaries in the lower horizons reflect lack of presence of distinct morphological differences between the subsequent subsoil horizons of Nitisols. The same as in all of the horizons the root size and abundance was described as many medium to very few fine roots with in horizon depth. In all of the horizons both pedon was described to be well drained of the water. This result is similar with Bekele and Getahun [20] who reported the nitisols of Asossa soil are well drained, porous with clay-to-clay loam texture and low organic matter content.
Soil physical properties of pedons
Soil texture: The textural class of the studied soil varied from loam in surface soil to clay in sub soil of uncultivated pedon 1. On the other hand, the textural class of the cultivated pedon 2 was clay through surface to subsurface soil (Table 1). This revealed that the sand and silt content of the soil decreased and the clay content increased with the soil depth of both soil pedons (Table 1). Clay content increases during the weathering processes. Therefore the silt/clay ratio is often used to distinguish young and old parent materials. Silt/clay ratio of less than 0.15 is characteristics of young materials [21]. Though the horizons of the soil have silt/clay ratio above 0.15, the horizon depths have influence on soil silt/clay ratio, and the surface horizons have higher silt/clay ratio as compared to subsurface horizons. The decrease in silt/clay ratio with depth is an indication that depth shows clay migration from the upper to the lower horizon. Lower silt/clay ratio in the lower horizons also indicates better water retention capacity than the overlaying horizon.
Bulk density, particle density and porosity: The bulk densities of the studied soils showed great variability with respect to contents of organic matter and position of horizons in a pedon (Table 1). In both pedons the lower values were recorded under the surface horizon than the underlying horizon. The surface horizon bulk density value ranges from 1.04 to 1.10 g cm-3; the lowest value was recorded under uncultivated pedon 1 that had higher organic matter than the other subsurface and surface horizon as confirmed from soil characterized (Table 1). According to Miller, et al. [22], for good plant growth, bulk densities should be below 1.4 and 1.6 g cm-3 for clay and sand soils, respectively. So the bulk density values observed in these soils were within the normal range for mineral soils.
The total porosity of soil depends on the bulk density of the soil. As the bulk density of the soil increased the total porosity of the soil decreased. Regarding the total porosity, the highest total porosity (56.6%) was obtained in uncultivated pedon 1 than cultivated pedon 2 (52%) in the study site (Table 1). The higher values of total porosity corresponded to the higher amount of organic matter contents and lower bulk density values. The smallest number of total porosity of soil (48.07%) was recorded in the sub surface horizon of pedon 1 and followed by (49.6%) sub surface horizon of pedon 2. According to Brady and Weil [23], ideal total porosity values, which are acceptable for crop production, are around 50%.
Hence, the soil of Humic-dystric Nitisols of Asossa area has an acceptable range of total porosity values for crop production.
Soil water content
In most of the cases, there was no clear pattern of variation in field capacity (FC) at the studied soils of the area. Soil field capacity (FC), ranged from 27.4 to 30% at surface (Table 1), the higher field capacity being recorded for the horizon containing relatively high content of clay. On the other hand, the lowest field capacity was not recorded for horizons having low contents of clay, revealing an absence of any clear pattern of association with this soil attribute. These variations in moisture contents of the soil at FC might be due to variation in soil organic matter as soil organic matter makes the soil to retain water by increasing its surface area. The highest levels of moisture at FC and PWP corresponded with the highest clay contents in the sub surface horizon of both pedon (Table 1). Abayneh has also reported that although the degree of correlation was weak, available water capacity (AWC) showed positive correlation with organic matter and clay contents, but negative correlation with bulk density and silt content and this implies the improvement of soil structure and organic matter content could increase AWC.
Soil chemical properties of pedons
Soil reaction, exchangeable acidity and exchangeable Al+3: The pH value of the Al+3with depth of the soil horizon of both pedon (Table 4). The higher soil pH in surface horizon might be related with the high cation exchangeable capacity, relatively low exchangeable acidity and low exchangeable Al+3 surface horizon than the sub surface soil of the studied area. Ethio SIS [24] classified pH values into five classes, strongly acidic < 5.5, moderately acidic 5.6-6.5, neutral 6.6-7.3, moderately alkaline 7.3-8.4 and strongly alkaline > 8.4. The soils in the study area had 5.2 (strongly acid) to 5.7 (moderately acidic) in the subsurface and surface horizons respectively (Table 4).
The most favorable pH for availability of most plant nutrients correspond roughly with the optimum range of 6 to 7 [25]. The range of soil reaction in experimental site may limit crop production by influencing the availability of important plant nutrients. The same as the exchangeable acidity and exchangeable Al+3 value of the studied area showed an irregular increase with depth of the soil horizon in uncultivated pedon 1, on the other hand showed a regular increase with depth of the soil horizon in cultivated pedon 2 (Table 4).
Organic carbon, total nitrogen and available phosphorous
The limited available data indicated that the soil organic carbon revealed slight variation between uncultivated pedon 1 and cultivated pedon 2 and it decreasing with the depth of soil. This result is similar with Bahilu, et al. [26] who found the organic carbon of soil was significantly affected by land use and slope at Delta Sub-watershed of South Western Ethiopia. Total nitrogen contents of the soils also showed the same trend as soil organic carbon. Studies made in Ethiopia [27] show that levels of soil organic carbon are related to land use history, and are generally expected to be low in cultivated soils as compared to the same fallow land.
The amounts of organic carbon content recorded can be categorized as low (2-4%), at surface, and very low (< 2%) in sub surface horizons of both pedons [28]. Similarly the rating of total N of > 1% as very high, 0.5 to 1% high, 0.2 to 0.5% medium, 0.1 to 0.2% low and < 0.1% as very low N status as indicated by Landon [28]. Therefore, the experimental soils qualify for medium in total N at the surface horizon to the first layer of sub surface horizon of both pedons. On the other hand sub surface horizon categorized to < 0.1% as very low total nitrogen. The very low organic carbon and medium to very low total nitrogen content in the study area indicate low fertility status of the soil. This result is similar with Bekele, et al. [29], who report very low OC and very low to medium N content of Asossa area of Benshal- gul gumuz indicated low fertility status of the soil could be due to continuous cultivation and lack of incorporation of organic materials.
Soil organic carbon was determined to estimate the amount of organic matter in the soil. Organic matter has an important influence on soil physical and chemical characteristics, soil fertility status, plant nutrition and biological activity in the soil [3]. The highest value of soil organic matter was recorded at the surface soil layers and it decreased with increase in soil depth. The amount of organic matter content showed a sharp decline with depth of all studied profiles, suggesting the relatively more addition of decomposable organic materials in the surface horizons. Yihenew [30] reported that most cultivated land soils of Ethiopia are poor in their organic matter content due to low amount of organic materials applied to the soil and complete removal of the biomass from the field. According to Landon [28], available (Olsen extractable) soil P level of less than 5 mg kg-1 is rated as low, 5-15 mg kg-1 as medium and greater than 15 mg kg-1 is rated as high. Thus, the available (Olsen extractable) P throughout the studied soils (Table 2) was below the critical level. In surface horizon it varied from 3.22 to 3.94 mg kg-1 in uncultivated profile 1 and cultivated pedon 2 respectively, similarly it were varied from 3.08 to 3.11 mg kg-1 in uncultivated pedon 1 and cultivated pedon 2 respectively, in subsurface horizon.
Cation exchange capacity and percent base saturation
According to Landon [27], CEC of the soils greater than 40 cmol (+) kg-1 are rated as very high and 25-40 cmol (+) kg-1 as high and CEC of soil from 15-25, 5-15 and < 5 cmol (+) kg-1 of soil are classified as medium, low, and very low, respectively. So, rating the CEC soil of studied area ranges from 25.8 cmol (+) kg-1 depth to 34.5 cmol (+) kg-1 that high, implying good for agricultural purpose. Furthermore, such high CEC value provides the soil with high buffering capacity so that one can apply the required amount of fertilizer dosage without any immediate negative effects on the soils. CEC values generally showed declining trends with depth of both pedons. The increase in clay contents with depth of the profiles was not parallel with increase in CEC. This indicates that the clay content of soil did not influence the CEC of soil in studied area. This result is contrary to Donahue, et al. who reported the cation exchange capacity has a relationship with texture. The cation exchange capacity of a soil could then relate with the organic matter content of a soil [3].
The percent of base saturated of the studied area varied from 22.5 to 24.2%, which showed medium percent base saturation of the surface horizon (Table 5). Landon [28] reported that base saturation is an indication of soil fertility. Soils with percentage base saturation of < 20%, 20-60% and > 60% are considered as low, medium, and high in fertility quality [28]. Thus, the Nitisols of the present study area exhibited medium to low percentage base saturation levels (Table 5) which implies basic cations were lost from the soil through the processes of leaching due to the high rainfall.
Exchangeable Ca was found to predominate the exchange complex of the soil colloidal particles in both the soil of the studied area (Table 6). Landon [28] categorized Ca as < 2.0 Cmol (+) kg-1 soil very low, 2.0 to 5.0 Cmol (+) kg-1 low, 5.1 to 10.0 Cmol (+) kg-1 medium, 10.1-20.0 high and > 20.0 Cmol (+) kg-1 as very high. Based on this categorization, the status of Ca in tested soils ranges from low to medium in sub surface and surface horizon respectively. The highest exchangeable Ca (6 cmol (+) kg-1) soil was recorded under surface horizon of uncultivated pedon 1, while it decreased with the depth of the both pedons. The analytical result of Ca and Mg indicated that surface horizon has higher amount of these cations than sub-surface horizons. According to Mesfin [2], most Nitisols profiles show Ca and Mg higher in the surface horizon than in the horizon below; this can be attributed to recycling through leaf fall and decay.
The concentrations of the monovalent basic cations (exchangeable K and Na) were far lower than the concentrations of the diavalent basic cation (exchangeable Ca and Mg) in both soil pedons and soil horizons within a pedon. However, exchangeable Na was relatively higher than K in all soil horizone. Exchangeable K in studied soils had 0.1 Cmol (+) kg-1 through all horizons as given in Table 5. This was very low according to Landon [28] rating. He categorized the exchangeable K in soils as < 0.2 very low, 0.2 to 0.4 Cmol (+) kg-1 low, 0.41-1.2 medium, 1.21-2.00 high and > 2.00 Cmol (+) kg-1 as very high. The soils in the study area had very low K, indicating that these soils have no adequate levels of K for crop production. The result disagrees with the common idea that Ethiopian soils are reach in K. But it agrees with Belay [31] and Wakene [32] who reported K deficiency in Eutric Vertisols of Melbe (Tigray) and Dystric Nitisols of Bako area, respectively. In both land forms, the analytical values of cations are in the order: Ca > Mg > Na > K. Yihenew [30] reported a similar order (Ca > Mg > Na > K) for Alfisols.
The potassium to magnesium ratio of the studied soil was less than 0.7. In contrast to this result, Fanuel [33] and Hillette, et al. [34] reported K to Mg ratio lower than 0.7 and probability of Mg induced K deficiency in soil of southern and central highland of Ethiopia, respectively. On the other hand, the Ca/Mg ratio observed in the soils studied ranged between 1 to 3 and crop not likely to Mg fertilizer application. It is stated that Mg deficiency can occur in soils with high ratio of exchangeable Ca/Mg exceeding 10 [35]. This confirmed that the Ca did not induce Mg deficiency in the soil of studied area. The recommended Ca/Mg ratios are < 5/1 for field crops, < 3/1 for vegetables and sugar beets and < 2/1 for fruit and greenhouse crops [36]. In the study area, K: Mg ratio was less than 1:1 in all of soil samples collected. This confirmed that Mg induced K deficiency existed in the study areas. This can be corrected by K application to bring the K to Mg ratio closer to 1:1.
Classification of soil at experimental site
Major diagnostic criteria in recognizing the nitric subsurface horizon of both pedons are, diffuse to gradual/and diffuse to smooth boundary, moderate coarse granular to moderately fine angular blocky, no gleyic or stagnic properties, cay loam or finer texture and silt/clay ratio less than 0.4 with subsoil, low value and chroma with 2.5 YR hues; but sometimes 5 and 10 YR hues in some horizon is observed under moist and dry consistence and the CEC (in 1M NH4OAc at pH 7) corrected for organic matter is less than 36 Cmolc kg-1.
On the basis of pedon description (Table 2) and the results of analysis of soil samples collected from each horizon (Table 4, Table 5, Table 6 and Table 7), the soils of the experimental site were characterized. The subsurface horizons of both pedon had maximum accumulation of clay which was 9% more than the surface horizon. The percentage base saturation of the pedon decreasing with depth highest (24.2%) at the surface horizon while the lowest (14.1%) at the subsurface horizon.
Accordingly, both pedon had low base saturation status (less than 50 percent) in all of its parts between 20 and 100 cm from the soil surface and qualified for dystric concept at the subunit level. It also had a humic soil property which is having organic carbon content of greater than 1 percent as weighted average over a depth of 100 cm from the soil surface and recognized meeting a humic qualifier at third unit level of classification. Therefore, soils represented by both pedons were classified as Humic-dystric Nitisols [37].
Summary and soil management strategy of the area
In recent years, crop productivity in Ethiopia in general and in Benshal-gul Gumuz region in particular has shown a declining trend, in spite of the best use of improved varieties. The most possible causes of this decline are soil fertility depletion and the continuous use of the traditional fertilizer, which have limited number of essential plant nutrient. In addition, due to high rainfall, soil erosion is a severe problem in sloping areas where vegetative cover is very low. Two soil pedons were opened from adjacent land uses (uncultivated and cultivated) to characterize and classified the soil of study area. Accordingly, both pedons had low base saturation (less than 50% percent) in all of its parts between 20 and 100 cm from the soil surface and qualified for dystric concept at the subunit level. It also had a humic soil property which is having organic carbon content of greater than 1 percent as weighted average over a depth of 100 cm from the soil surface and recognized meeting a humic qualifier at third unit level of classification. Therefore, soils represented by both pedons were classified as Humic-dystric Nitisols.
The morphological and physical characteristics soil of the studied area indicated well -drained condition, clay loam to clay texture, relatively low soil bulk density, strongly coarse granular to moderately finer angular blocky values favorable soil condition for agricultural purpose. Consequently these properties bring proper aeration, free drainage, and increasing infiltration of water and reduce surface run off or soil erosion. Furthermore, very friable consistence, absence of hard pan fragments implies that the soils are good for agriculture, as easy to root penetration and cultivation. However major problems with the soil chemical properties investigated include low to medium basic cations (Ca, Mg, K and Mg), low available P content could be related to P fixation by Al and Fe, very low organic carbon and medium to very low total nitrogen content in the study area indicate low fertility status of the soil. Based on these limitations therefore, it is suggested that the recommended soils management practices and approaches of improving soil chemical properties by application of basic materials like vermin-compost, compost, farm yard manure and lime. Similarly crop residues management and complementary use of organic and inorganic materials should be determined on the farm to improved soil productivity.
Similarly integrated nutrient management system which embraces a holistic approach of integrated use and management of organic and inorganic nutrient sources in a sustainable way should be adopted. Additionally periodic soil tests of site are very imperative to properly monitor the soil fertility indices and prevent decline and degradation of soil fertility. The low TN and OC contents in the soils need to be amended through N-fertilizer management and the application of integrated nutrients management (INM). Lastly a more detail soil survey of the site is advocated to put the land into best uses, make predictions about the behavior of soils and evaluate/predict the effects of land use on the environment of the study area.
Conflict of Interests
The authors have not declared any conflict of interests.
References
- Khanif YM (2010) Improvement of Soil Carrying Capacity for Better Living. Department of Land Management, Faculty of Agriculture University Putra Malaysia, 43400, Serdang Selangor Malaysia.
- Mesfin A (1998) Nature and management of Ethiopian soils. Alemaya University of Agriculture. Ethiopia: 272.
- Brady NC, Weil RR (2002) The nature and properties of soil. (13th edn), Preason Education, Asia. 960.
- Gupta PK (2000) Handbook of soil fertilizer and manure. Anis offset press, Paryapuni, New Delhi, India, 431.
- Mitiku H (1987) Genesis, characteristics and classification of soils the Central Highlands of Ethiopia. PhD Desertion, State University of Ghent, Faculty of Science, Belgium: 399.
- Parker R (2000) Introduction to plant science. Delmar, Thomson Learning, USA, 704.
- Ahmed H (2002) Assessment of spatial variability of some physico- chemical propertiesof soil under different elevations and land use system in the Western slopes of mount Chilalo, Arsi, Ethiopia, 111.
- Tadele B, Alemu L (2016) Physico-Chemical Properties and Agricultural Potentials of Soils of Tembaro Woreda, Kembata Tembaro Zone, Southern Ethiopia. Journal of Chemistry and Materials Research 8.
- FAO (1990) Guidelines for soil profile Description 3rd ed. Soil Resource Management and Conservation Service, Land and Water Development Division, Rome: 70.
- Munsell Color Company (1975) Munsell soil color charts. Munsell color company, Inc. Baltimore 18, Maryland, USA.
- Klute A (1965) Water holding capacity. In: C.A. Black, Methods of soil analysis, Agron. Part I, No. 9, American Society of Agronomy, Madison, Wisconsin, USA, 273-278.
- Okalebo JR, Gathua KW, Womer PL (2002) Laboratory methods of soil and plant Nutrient management guidelines for agronomic crops grown in Mississippi, Mississippi State University Extension Service, Mississippi.
- Rowell DL (1994) Soil science: Method and applications. Addison Wesley Longman Limited, England, 350.
- Carter MR (1993) Soil sampling and methods of analysis, Canadian Soil Science Society. Lewis Publishers, Boca Raton, Florida: 823.
- Walkley A, Black IA (1934) An examination of the Degtjareff method for determining soil organic matter and proposed modification of the titration method. Soil Science 37: 29-38.
- Sahlemedhin S, Taye B (2000) Procedures for Soil and Plant Analysis. National Soil Research Organization, Ethiopian Agricultural Research Organization, Addis Ababa, 110.
- McLean EO (1965) Aluminum. In: CA Black, Methods of Soil Analysis. Agron Part II, Am Soc Agron, Madison, Wisconsin, USA: 978-998.
- Olsen SR, Cole CV, Watanabe FS, et al. (1954) Estimation of available phosphorus in soils by extraction with sodium bicarbonate. US Department of Agriculture 939: 1-19.
- De Wispelaere L, Marcelino V, Regassa A, et al. (2015) Revisiting nitic horizon properties of Nitisols in SW Ethiopia. Geoderma 243: 69-79.
- Bekele A, Getahun D (2016) Influence of Phosphorous and Nitrogen Fertilizer Rate on Grain Yield of Rice at Kamashi Zone of Benshal-gul Gumuz Region, Ethiopia. Journal of World Economic Research 5: 8-14.
- Buole SW, Hole FD, McCracken RJ (1997) Soil Genesis and Classification. 4th edition. The Iowa State University Press, 527.
- Miller RW, Donahue RL, Miller JU (1995) Soils in our environment. (7th edn), New Jersey, 649.
- Brady NC, Weil RR (2008) The nature and properties of soils. (14th edn), Prentice Hall, New Jersey.
- Ethiopia Soil Information System (EthioSIS) (2014) Soil fertility status and fertilizer recommendation atlas for Tigray regional state, Ethiopia. Addis Ababa, Ethiopia.
- Brook RH (1983) International course on soil and plant analysis: Lecture notes. Service Laboratory for Soil, Plant and Water Analysis, Soil Science Department, Faculty of Agriculture, Minia University, Egypt.
- Bahilu B, Mulugeta L, Alemayehu R (2014) Soil Fertility Status as Affected By Different Land Use Types and Topographic Position: AAs case of Delta Sub-watershed, Southern Ethiopia. Journal of Biology, Agriculture and Healthcare 4: 91-105.
- Mohammed A, Le Roux PAL, Barker CH, et al. (2005) Soils of Jelo micro-catchment in the Chercher highlands of eastern Ethiopia: I. Morphological and physical properties. Ethiopian Journal of Natural Resources 7: 55-81.
- Landon JR (1991) Booker Tropical soil manual, a hand book for soil survey and agricultural land evaluation in the tropics and subtropics. Longman, Booker, 474.
- Bekele A, Getahun D, Dereje A (2016) Determination of Optimum Rates of Nitrogen and Phosphorus Fertilization for Finger Millet (Eleusine coracana L. Gaertn) Production at Assosa Zone, in Benishangul - Gumuz Region of Ethiopia. Advances in Sciences and Humanities 2: 1-6.
- Yihenew G (2002) Selected chemical and physical characteristics of soils of Adet Resaerch Centre and its testing sites in northwestern Ethiopia. Ethiopian Journal of Natural Resources 4: 199-215.
- Belay T (1996) Characteristics and landscape relationships of Vertisols and Vertic Luvisols of Melbe Tigray, Ethiopia. Ethiopian Journal of Science 19: 93-115.
- Wakene N (2001) Assessment of important physicochemical properties of Dystric Udalf (Dystric Nitosols) under different management systems in Bako area, western Ethiopia.
- Fanuel L (2015) Soil spatial variability analysis, fertility mapping and soil plant nutrient relations in Wolaita zone, Eouthern Ethiopia, PhD Thesis, Haramaya University, Ethiopia.
- Hillette H, Tekalign M, Riikka K, et al. (2015) Fertility Status and Whet Nutrient contents in Vertisol Cropping System of Central Highlands of Ethiopia. Agriculture and Food Security 4: 1-10.
- Tisdale SL, Nelson W, Beaton JD (1995) Soil fertility and fertilizers. 5th edition New York, Toronto, Oxford Sydney, 684.
- Havlin JL, Beaton JD, Tisdale SL, Nelson WL (1999) Soil Fertility and Fertilizers. Prentice Hall, New Jersely: 345-355.
- Food and Agriculture Organization of the United Nation/World Reference Base for Soil Resources (FAO-WRB) (1998) World reference base for soil resources. World Soil Report, No. 84 Rome, 88.
Corresponding Author
Bakala Anbessa, Ethiopia Institute of Agricultural Research, Asossa Agricultural Research Center, Asossa, Ethiopia
Copyright
© 2022 Anbessa B. This is an open-access article distributed under the terms of the Creative Commons Attribution License, which permits unrestricted use, distribution, and reproduction in any medium, provided the original author and source are credited.