Silicon Adsorption on Clay Soils Affect by Silicon and Phosphorus Addition Using Freundlich Adsorption Model
Abstract
Silicon (Si) is an element, not essential, but is beneficial for some plants. The Freundlich model was used to describe Si adsorption on soil samples which pretreated with different Si and phosphorus (P) concentrations and inculpated for 60 days. Soil incubated samples were: T1 soil had no Si or P (control); T2, T3 and T4 soils contained 50, 100, and 200 mg Si L-1, respectively. T5 and T6 soils contained 50 mg Si L-1 in combined with either 7 or 10 mg P L-1 along with T7 and T8 soil contained 100 mg Si L-1 in combined with either 7 or 10 mg P L-1. Finally, T9 and T10 soil contained 200 mg Si L-1in combined with either 7 or 10 mg P L-1. A series of adsorption experiments were performed using sodium meta silicate pentahydrate (Na2O3Si.5H2O) solution prepared to have concentrations representing 0, 14, 28, 42 and 56 mg Si L-1 in combination with phosphorus at the concentrations of 50 and 100 mg L-1 using Ca(H2PO4)2 salt. The supernatant of Si concentration was determined. The amount of element adsorbed was calculated as the difference between applied element concentrations and that remaining in solution after equilibration. Adsorption isotherms were determined at room temperature (25℃ ± 1). Results revealed that a positive trend was generally found; increases in amount of adsorption onto soil with increasing Si concentration and equilibrium concentration under both P applied concentrations in concerned solution either applied separately or applied + initial available Si concentration in soil. The Freundlich equation provides a good fit to the sorption data for all incubated soil samples and R2 values were ranged from 0.6 to 0.8. Present study indicated that adsorption capacity value (Kf) decreased from T1 to T4 soil samples under both P applied concentrations but Kf values under 100 mg L-1 P was lower than its under 50 mg L-1 P, and intensity adsorption values (1/n) gave almost an opposite trend to that of capacity adsorption (Kf) values. Moreover, adsorption of Si onto soil incubated with different Si concentrations in combined with P2 decreased as compared to P1 under both P applied concentrations. Also, present study showed that the higher values of Kf obtained in P1 incubated soils ( T5 , T7 and T9), compared to Kf values of P2 incubated soils (T6, T8 and T10), and intensity adsorption values (1/n) gave almost an opposite trend to that of capacity adsorption (Kf) in both P1 and P2 soils. Finally, large Si sorption capacity and low Si affinity for the surface sites were observed in soil incubated with high Si concentration compared to soil incubated with low ones.
Keywords
Silicon, Phosphorus, Interaction, Adsorption, Freundlich equation
Introduction
Silicon (Si) is an element, not on essential nutrient, but beneficial for some plants, its equilibrium concentration is largely controlled by adsorption/desorption reactions [1]. The extent and rate of Si adsorption is dependent on the sesquioxide content of the soil, soil pH, and the presence of other anions [2]. Ma and Takahashi [3] reported that sorption of silicate increased but desorption decreased with increasing Si concentration possibly as a result from a lateral interaction among adsorbed silicate ions leading to cluster formation. Huang, et al. [4] reported that the adsorbed silicate increased with increasing equilibrium silicate concentration; the shape of these adsorption isotherms fell into the so-called "S-type" isotherm. Yu and Li [5] previously showed that when equilibrium silicate concentration was less than about 30 mg SiO2 kg-1 adsorbed silicate increased rapidly with increasing equilibrium silicate concentration and thereafter showed little increase with increasing equilibrium silicate concentration.
In contrast, Si sorption increases in soil could be attributed to a multilayer Si formation at the soil surface [6], since silicic acid polymerization probably occurs under acidic conditions [7] and at Si concentrations exceeding 2 mM [8]. Hingston, et al. [9] showed that the competition of anions for metal active surface sites depends on the relative affinity of anions for the surface and the relative concentrations of such anions. Namasivayam and Prathap [10] added that silica adsorption was lowered by phosphate; this implies no specific number of sites on the adsorbent, which are exclusive for both silica and phosphate. There are few reports described anion sorption using mathematical Freundlich or Langmuir models [4] and [11]. Ma and Takahashi [3] and [12] reported that addition of P may not only decrease Si adsorption, but may also displace adsorbed Si because of its higher site affinity thus suggesting that some sites of Si adsorption may be the same as those of P.
Thus, when silicate is added first, Si may be adsorbed, but when P is added subsequently, the absorbed Si may be displaced by P due to the latter's high affinity to the sites. Hu, et al. [13] reported competition between silicon and phosphorus as to increases silicon desorption and rate in soil. Due to decreased bonding energy of silicon; application of phosphorus produced the pushing action for silicon adsorption. Cartes, et al. [14] showed that adsorption intensity of silicon increased with the addition of P which indicating that the affinity for Si diminishes as P sorption progresses in soil, the decrease in the amount of sorbed Si could be produced from direct competition with P for binding sites.
It could be also a consequence of the increased difficulty in approaching the mineral surfaces for Si due to both the changes in electrical charges and the steric effects caused by increasing surface coverage by P. Moreover, Si seems to be specifically sorbed mainly onto sites of negative charge. Szulc, et al. [15] reported that phosphorus reduces the sorption of silicon which becomes more readily available in the soil environment and can potentially be taken up by plants. Lee and Kim [11] showed that adsorption of phosphates in soils of acidic and neutral pH is higher than silicates, which increases the concentration of silicon in the soil solution. The current study was planned to investigate adsorption and dynamics of silicon by different pretreated and incubated soil samples as well as response to interactions.
Materials and Methods
Studies of adsorption were developed to be used in an experiment dealing with the adsorption behavior of silicon at different concentrations from this element with phosphorus. Soil samples were collected from agriculture research centre farm, Giza, Egypt, coordinates (29o58/ 55.046// N) and (31o12/ 49.272// E). The soil samples air-dried and passed through a 2 mm sieve. Some physical and chemical characteristics of the studied soil are present in (Table 1) as described by Page, et al. [16]. Multi series experiments were performed using soil samples previously pretreated and incubated with different concentrations of Si and P.
Soil incubated samples were : T1 soil did no Si and P (control), T2 soil content of 50 mg Si L-1, T3 soil content of 100 mg Si L-1, T4 soil content of 200 mg Si L-1, T5 soil content of 50 mg Si L-1 together with 7 mg P L-1 (Pi1), T6 soil content of 50 mg Si L-1 together with 10 mg P L-1 (Pi2), T7 soil content of 100 mg Si L-1 together with 7 mg P L-1 , T8 soil content of 100 mg Si L-1 together with 10 mg P L-1, T9 soil content of 200 mg Si L-1 together with 7 mg P L-1, T10 soil content of 200 mg Si L-1 together with 10 mg P L-1. Technique of adsorption described by Cartes, et al. [14] and Morsy, et al. [17] A series of adsorption experiments was performed using sodium metasilicats benta hydrate Na3SiO4.5H2O solution prepared to have concentrations representing 0, 14, 28, 42 and 56 mg L-1 in combination with phosphorus at the concentrations of 50 and 100 mg L-1, P1 and P2, using Ca(H2PO4)2 salt. Aliquots were finally taken out, to be analyzed for Si [16]. The amount of element adsorbed was calculated as the difference between applied elements concentrations and that remaining in solution after equilibration. Adsorption isotherms were determined at room temperature.
According to Bangroo, et al. [18] Freundlich equation is
x/m = Kf Ce1/n ………..………………………………. Equation (1)
The linear form of Freundlich's equation is given by
log x/m =1/n log Ce + log Kf…………………………. Equation (2)
Where: -
Ce → element concentration in the equilibrium solution (mg L-1)
x/m → amount of element adsorbed per unit mass of soil (mg kg-1)
Kf→ measure of adsorptive capacity (mg kg-1)
1/n → determines the intensity of adsorption or sorption energy. (L kg-1)
Isa, et al. [19] reported that the 1/n values indicate the deviation in linearity of the adsorption isotherm.
• If n = 1→ the adsorption is linear, i.e., the sites are homogeneous and there is no interaction between the adsorbed species.
• If 1/n < 1 → the adsorption is favorable, the adsorption capacity increases, and new adsorption sites appear.
• If 1/n > 1→ the adsorption is unfavorable, the adsorption bonds are weak, and the adsorption capacity decreases
The Freundlich adsorptive capacity and intensity of adsorption or sorption energy constant were obtained from slope and intercept of the mentioned relationship, respectively, by regressing log x/m against Log Ce. An intensity of adsorption or sorption energy is reciprocal of slope and adsorptive capacity constant is reciprocal of intercept (log Kf).
Results and Discussion
Soil incubated with different concentrations of silicon
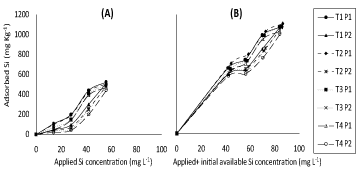
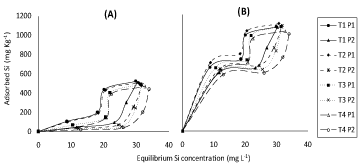
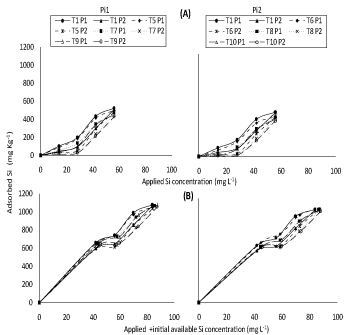
(Figure 1) represents response of adsorbed Si on soil samples (incubated with different concentrations of silicon) to either applied Si separately or applied + initial available Si concentration under both P applied concentrations in the concerned solution. (Figure 2) representing correspondent responses to equilibrium Si concentration in the concerned solution. From such plots, positive trends were generally found; higher concentrations of silicon were generally lower effective. Higher amount of adsorption was obtained with T1 soil under both of P concentrations (50 and 100 mg L-1 P).
This is different from soils of T2, T3 and T4 incubated with high concentration of silicon, slight decreases, for the amount of silicon adsorbed compared to T1. Application of P2 (100 mg L-1) to soils (T1, T2, T3 and T4) decreased Si adsorption compared to application of P1 (50 mg L-1) rate which may be attributed to competition between silicon and phosphorus, these results are in a good agreement with those of [13] who reported that supplying phosphorus to the soil decreased the amount of adsorption for silicon. In fact, Moreira and Alleoni [20] reported that evaluation for adsorption mechanisms in competitive systems allow a more precise evaluation of the metal behavior in the soil compared to the single metal adsorption, non-competitive systems being also involved. Later on, Ma and Takahashi [3] pointed out that some sites of Si adsorption may be the same as those of P.
Thus added P may not only decreases Si adsorption but may also displace adsorbed Si because of its higher site affinity; this result is in a good agreement with those of [21] who reported that silicate had low affinity with bound sites of adsorption than phosphate. Cartes, et al. [14] previously showed that the decrease in amount of sorbed Si could stem from direct competition with P for binding sites. It could be also a result of the increased difficulty in approaching the mineral surfaces for Si due to both the changes in electrical charges and the steric effects caused by increasing surface coverage by P. It may be worth to mention that despite the similarity in the general trends of obtained results of (Figure 1 and Figure 2), in P presence, applied Si + initial available Si concentration (Figure 1 and Figure 2B) had, as expected, higher value of adsorbed Si as compared to their application separately (Figure 1 and Figure 2A).
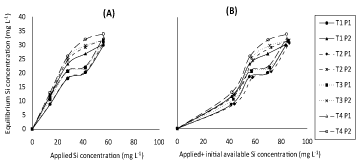
Figure 3 represents a plot describing the correspondent positive relationship between equilibrium Si concentration, results showed that higher equilibrium silicon concentration was obtained with T4 soil under both P concentrations (50 and 100 mg L-1 P) compared to soils of T1, T2 and T3 which incubated with low concentration of silicon slightly decreased equilibrium silicon concentration. Application of P2 (100 mg L-1), compared to application of P1, increased equilibrium silicon concentration possibly attributed to competition between Si and P on the adsorbed sites. In fact, according to Ma and Takahashi [3] reported that P had higher affinity with the bound sites of adsorption than Si. Thus, application of P may not only decrease Si adsorption but may also displace adsorbed Si from adsorption sites to increase Si in soil solution. These results are in a good agreement with those of [12] and [13] who reported that Si desorption increased with increasing of P concentration in the solution. It may be worth to mention that despite the similarity in the general trends of obtained results of (Figure 3), in P presence, applied Si + initial available Si concentration (Figure 3B) had, as expected, higher value of equilibrium Si concentration as compared to their application separately (Figure 3A).
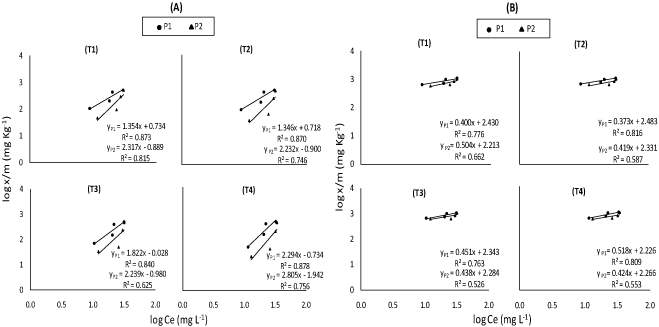
Fitting the adsorption data to different equations, the sorption isotherms were examined according to their linear form. Data in (Figure 4) was plotted according to the Freundlich adsorption isotherm by taking log x/m against log Ce; parameters of adsorption capacity (Kf mg Kg-1) and adsorption intensity or bonding energy (1/n L Kg-1) calculations for the concerned soil are shown in (Table 2). Adsorption capacity (Kf) can be related to both plant uptake and environmental pollution. Low Kf values indicate that most of the metal present in the system remains in the solution and is relatively available for transport, chemical processes, and plant uptake, on the other hand, high values show lower mobility and higher retention of metal in the soil [22].
In fact, obtained values indicated that adsorption capacity (Kf) decreased from T1 to T4 soils under both P concentrations (50 and 100 mg P L-1), the highest value Kf in T1 sample may be due to lowest Si concentration in incubated soil, consequently low Si mobility and high retention of Si in the soil. T2, T3 and T4 soils had, on the other hand, less Kf values possibly attributed to high concentration of Si in incubated soil which led to high Si mobility and low retention of Si in the soil. Kf values under P2 concentration were lower than Kf values under P1 concentration. These results agree with those of Hu, et al. [13] and Cartes, et al. [14] who reported that Kf values decreased with increasing P concentration. Again, this may be not only attributed to competition between Si and P on the adsorbed sites but also to the higher affinity of P with the bound sites of adsorption than Si which decreased the capacity of soil to adsorb Si.
It may be worth to mention that despite of similarity in the general trends of obtained results, (Table 2), applied Si + initial available Si concentration in soil (B) had, as expected, higher value of Kf as compared to their application Si separately (A) under both P applied rates. Intensity adsorption values (1/n) gave almost an opposite trend to that of capacity adsorption (Kf) values under both P concentrations (50 and 100 mg P L-1). 1/n values under P2 concentration were higher than those of under P1 concentration. These results are similar to those of [14] who reported 1/n increases with increasing of P concentration indicating that the affinity for Si diminishes as P sorption progresses.
These results agree with those of [23] who showed that the rate of P adsorption increased with the increase in their concentration. Hu, et al. [13] added that supplying P to the soil decreased the amount of adsorption for Si because of competitive between Si and P and increased Si desorption from the soil. It may be worth to mention that despite the similarity in the general trends of obtained results of (Table 2), in presence of P, applied Si + initial available Si concentration in soil (B) had, as expected, lower value of 1/n as compared to their application separately (A).
Soil incubated with different concentrations of silicon and phosphorus
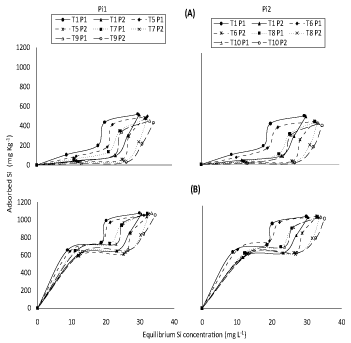
(Figure 5) represent response of adsorbed Si on soils incubated with different concentrations of silicon and phosphorus to either applied Si separately or applied +initial available Si concentration under both P applied concentrations in the concerned solution. (Figure 6) representing correspondent responses to equilibrium Si concentration in the concerned solution. From such plots, similar trends were found to those of (Figure 1 and Figure 2). In spite of that, soil incubated with different concentrations of silicon (50, 100 and 200 mg Si L-1) and phosphorus (7 and 10 mg P L-1) together had lower adsorbed silicon than those incubated with different concentrations of silicon only.
In fact, KafKafi and Bar-Yosef [24] reported that when silicate was adsorbed, equal amounts of phosphate were desorbed, which suggested that adsorption occurred on similar sites. Obtained results in (Figure 5 and Figure 6), also show that Pi2 concentration (10 mg L-1) had, as expected, lower value of adsorbed Si than Pi1 (7 mg L-1) rate possibly again attributed to competition between silicate and phosphate on adsorption sites which decrease silicon adsorption. Kafkafi, et al. [25] and Obihara and Russell [26] reported that silicate adsorption decreased by the presence of phosphate, which suggests that the same sites are active in adsorption. Obtained data agree with those of Ma and Takahashi [12] who reported that, silicate desorption increased but its adsorption decreased with increasing phosphorus concentration in the soil solution; sites of Si adsorption seemed to be the same as those of P although being different in site affinity.
Recently, Hu, et al. [13] showed that application of P had two phases, one is dealing with decreased adsorbed Si concentration and the other dealing with easily desorption of silicon due to lower bonding energy of silicon. Again, it may be worth to mention that despite the similarity in the general trends of obtained result of (Figure 5 and Figure 6), in presence of P, applied + initial available Si concentration (Figure 5 and Figure 6B) had, as expected, higher value of adsorbed Si as compared to their application separately (Figure 5 and Figure 6A). Moreover, the effect of applied Si separately on adsorption of Si on all studied soils were more clear than applied + initial available Si concentration at different concentrations of P presence.
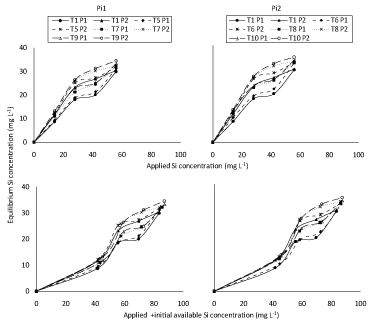
Finally, it was thought advisable to show relationship between equilibrium Si concentration and either applied Si separately (A) or applied + initial available Si concentration (B) at applied P. (Figure 7) shows similar trends to (Figure 3), in spite of that soil incubated with different concentrations of silicon together with phosphorus concentrations (Pi1 and Pi2 soils) have higher equilibrium silicon concentration than soils incubated with different concentrations of silicon only. These results were in a good agreement with those of Kafkafi, et al. [25] who reported that silicate was desorbed by soils when phosphate fertilizer was added, which indicated that phosphate is more strongly adsorbed than silicate. Obtained results in (Figure 7), also show that Pi2 concentration (10 mg L-1) had, as expected, higher value of equilibrium Si concentration than Pi1 (7 mg L-1) rate possibly again attributed to competition between silicate and phosphate on adsorption sites which should decrease silicon adsorption on the soil and increased silicon desorption from the soil. These results agree with those of [13] who reported that Si desorption increased with increasing of P concentration in the solution. More recently, Cartes, et al. [14] pointed out that the decrease in amount of sorbed Si could stem from direct competition with P for binding sites. It could be also a consequence of the increased difficulty in Si approaching the mineral surfaces due to both the changes in electrical charges and the steric effects caused by increasing surface coverage by P.
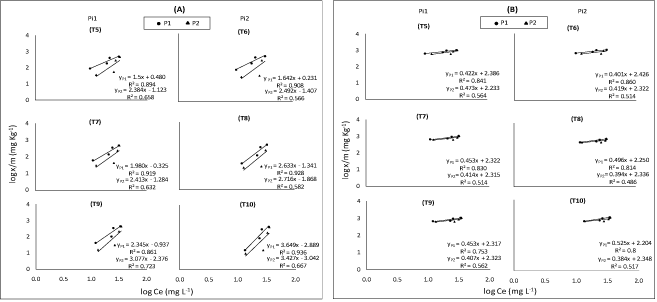
It may be worth to mention that despite the similarity in the general trends of obtained results of (Figure 7), applied + initial available Si concentration (Figure 7B) had, as expected, higher value of equilibrium Si concentration as compared to Si application separately (Figure 7A) under different P concentration. Moreover, the effect of applied Si on equilibrium Si concentration in all studied soils were more clear than applied + initial available Si concentration under different rates of P. Fitting the adsorption data to different equations, the sorption isotherms were examined according to their linear form of equations, data in (Figure 8) was plotted according to the Freundlich adsorption isotherm by taking log x/m against log Ce; parameters of adsorption capacity (Kf mg Kg-1) and adsorption intensity or bonding energy (1/n L Kg-1) calculated for the concerned soil are shown in (Table 3).
Present values in (Table 3) show similar trends to (Table 2) under both of P concentrations (50 and 100 mg L-1). In spite of that, soil incubated with different concentrations of silicon (50, 100 and 200 mg Si L-1) together with phosphorus (7 and 10 mg P L-1) have lower Kf values than soils incubated with different concentrations of silicon alone. Pi2 concentration (10 mg L-1) had, as expected, lower value of Kf than Pi1 (7 mg L-1) rate possibly again attributed to competition between silicate and phosphate on adsorption sites which should decrease silicon adsorption on the soil and increased silicon desorption from the soil. These results are in a good agreement with those of Hu, et al. [13] and Cartes, et al. [14] who reported that Kf values decreased with increasing P concentrations.
It may be worth to mention that despite of similarity in the general trends of obtained results of P1 concentration (50 mg P L-1), (Table 3), applied + initial available Si concentration in soil (B) had, as expected, higher values of Kf than applied Si separately (A) under soil incubated with both P concentration (Pi1 and Pi2 soils). Values of Kf under P2 concentration (100 mg P L-1) with applied + initial available Si concentration (B) have opposite trends to values of Kf under P1 concentration with applied Si concentration separately (A) under soil incubated with both applied P concentrations (Pi1 and Pi2 soils).
Date in (Table 3) also show that Intensity adsorption values (1/n) gave almost a similar trend to 1/n values in (Table 2). In spite of that, values of 1/n in soils incubated with Si and P concentration (7 and 10 mg P L-1) were higher than that of 1/n values in soils incubated with Si only. Values of 1/n were higher in soil incubated with 10 mg P L-1 than values of 1/n in soil incubated with 7 mg P L-1. These results are similar to those of [14] who showed that 1/n increased with increasing of P concentration indicating that the affinity for Si diminishes as P sorption progresses. Previously, [23] reported that the rate of P adsorption increased with the increase in the concentration of P. More previously [13] pointed out that supplying P to the soil decreased the amount of adsorption for Si because of competition between Si and P and increased Si desorption from the soil. It may be worth to mention that despite of similarity in the general trends of obtained results of P1 concentration (50 mg P L-1), (Table 3), applied + initial available Si concentration in soil (B) had, as expected, lower value of 1/n than applied Si separately (A).Values of 1/n under P2 concentration (100 mg P L-1) with applied + initial available Si concentration have opposite trends to values of 1/n under P1 concentration with applied Si concentration separately.
Finally, it can be concluded that:
• In general, increased applied Si concentration increased amount of adsorbed Si on soil.
• Si adsorption on soil decreased in the soil which incubated with high Si concentration compared to soil incubated with low Si concentration.
• Application of P to the soil decreased the amount of adsorbed Si on all incubated soil.
References
- McKeague JA, Cline MG (1963) Silica in soil solutions. I. The form and concentration of dissolved silica in aqueous extracts of some soils. Can J Soil Sci 43: 70-82.
- McKeague JA, Cline MG (1963) Silica in soil solutions. II. The adsorption of monosilicic acid by soil and by other substances. Can J Soil Sci 43: 83-96.
- Ma JF, Takahashi E (1991) Effect of silicate on phosphate availability for rice in a phosphorus-deficient soil. Plant Soil 133: 151-155.
- Huang L, Li H, Zhang X, et al. (2006) Silicate adsorption in paddy soils of guangdong province, China. Pedosphere 16: 654-659.
- Yu QY, XL Li (1999) Study on adsorption and desorption of silicon in soils. J Anhui Agrotechnical Teachers College 13: 1-6.
- Iler RK (1979) The Chemistry of Silica: Solubility, polymerization, Colloid and surface properties and biochemistry of silica. John Wiley & Sons 1-896.
- Dietzel M (2000) Dissolution of silicates and the stability of polysilicic acid. Geochim Cosmochim Acta 64: 3275-3281.
- Ma JF, Y Miyake, Takahashi E (2001) Silicon as a bene?cial element for crop plants. In: Datnoff LE, Snyder GH, Korndorfer GH (edn), Silicon in Agric. Elsevier BV 8: 17-39.
- Hingston FJ, Atkinson RJ, Posner AM, et al. (1967) The specific adsorption of anions. Nature 215: 1459-1461.
- Namasivayam C, Prathap K (2007) Adsorptive removal of silica onto ‘waste' Fe (III)/Cr (III) hydroxide: Kinetics and isotherms. Colloids Surfaces 295: 55-60.
- Lee YB, Kim PJ (2007) Reduction of phosphate adsorption by ion competition with silicate in soil. Korean J of Environ Agric 26: 286-296.
- Ma JF, Takahashi E (1990) Effect of silicic acid on rice in a phosphorus-deficient soil. Plant Soil 126: 121-125.
- Hu KW, Yan L, Guan L, et al. (2003) Effect of supply phosphorous on adsorption and desorption action of silicon in paddy soil. Plant Nutri Fert Sci 9: 299-302.
- Cartes P, Cea M, Jara A et al. (2015) Description of mutual interactions between silicon and phosphorus in Andisols by mathematical and mechanistic models. Chemosphere 131: 164-170.
- Szulc W, Rutkowska B, Hoch M, et al. (2015) Exchangeable silicon content of soil in a long-term fertilization experiment. Plant Soil Environ 61: 458-461.
- Page AL, Miller RH, Keeney DR (1982) Methods of soil Analysis. (Part 2) Chemical and Microbiological Properties, (2nd end), Am Soc Agron, Madison, Wisconsin, USA, 149-622.
- Morsy YA Heba, El Leboudi AE, El Etr MT Waffa, et al. (2018) Silicon behavior in soils contained different silicon and phosphorus concentrations using adsorption models. Arab Univ J Agric Sci 26: 1557-1571.
- Bangroo SA, Mushtaq AW, A Tahir, et al. (2012) Potassium adsorption characteristics of soils under long term maize-legume cropping sequence. African J Agric Res 7: 6502-6507.
- Isa MH, Lang LS, Asaari FAH, et al. (2007) Low-cost removal of disperse dyes from aqueous solution using palm ash. Dyes and Pigments 74: 446-453.
- Moreira CS, Alleoni LRF (2010) Adsorption of Cd, Cu, Ni and Zn in tropical soils under competitive and non-competitive systems. Sci Agric (Piracicaba, Braz.) 67: 301-307.
- Alovisi AMT, Neto AEF, Serra AP, et al. (2016) Phosphorus and silicon fertilizer rates effects on dynamics of soil phosphorus fractions in oxisol under common bean cultivation. African J of Agric Res 11: 2697-2707.
- Dandanmozd F, Hosseinpur AR (2010) Thermodynamic parameters of zinc sorption in some calcareous soils. J Am Sci 6: 298-304.
- Khan QU, Khan MJ, Rehman S (2010) Comparison of different models for phosphate adsorption in salt inherent soil series of Dera Ismail Khan. Soil Environ 29: 11-14.
- Kafkafi U, Bar-Yosef B (1969) The effect of pH on the adsorption and desorption of silica and phosphate on and from kaolinite. Proc. In: Clay Conf, (3rd edn), Tokyo, Japan, 1: 691-696.
- Kafkafi U, M Giskin, Hagin J (1970) Phosphate and silica adsorption and desorption from soils. Isr J Chem 8: 373-381.
- Obihara CH, Russell EW (1972) Specific adsorption of silicate and phosphate by soils. European J of Soil Sci 23: 105-117.
Corresponding Author
Adel El Sayed El Laboudy, Soils Department, Faculty of Agriculture, Ain Shams University, Cairo, Egypt.
Copyright
© 2022 EL Leboudi AE. This is an open-access article distributed under the terms of the Creative Commons Attribution License, which permits unrestricted use, distribution, and reproduction in any medium, provided the original author and source are credited.

