Influence of Soil Particle Size Distribution on Groundwater Quality around Industrial Areas of Oshodi-Lagos Nigeria
Abstract
Around industrial areas of Oshodi are differences in groundwater quality based on physical assessment. These industries claimed that their activities have no impact on the qualities of these ground waters. Hence the influence of particle size distribution on groundwater quality was evaluated. The combined techniques of geotechnical and physicochemical were used in the analysis of; twenty-eight groundwater and soil samples in the study area, as well as fourteen groundwater and soil samples from the control site. Geotechnical result showed that particle sizes of soil from the control were well graded unlike those from the study sites. The mean concentration of physicochemical parameters and heavy metals such as; total organic carbon, Zn, Cu, Cd, Fe, Pb, Ni and Cr in soil were higher in the control than that in-study samples. But the soil pH had mean value of 5.849 for the study sample and 5.445 for the control. All the physicochemical results from the soil samples meet up the standard set by Department of Petroleum Resources in Nigeria for metal concentration in the soil. The ecological risk of soil was very low. In contrast, the mean concentrations of the physicochemical parameters and heavy metals including; total dissolved solid TDS, biochemical oxygen demand BOD, Zn, Cu, Cd, Pb, Mn, Fe, Cr and Ni were higher in groundwater samples from the study area than in control except for the groundwater pH (5.57) which was lower than in control (5.89). Parameters like salinity, TDS, BOD, Zn and Cu were within the standard limit for drinking water in all the groundwater. The result showed that groundwater from well graded soil is of good quality where as those from poorly graded soil are of poor quality irrespective of the industrial activities.
Keywords
Groundwater vulnerability, Particle size analysis, Industrial effluent, Soil contamination
Introduction
Soils have the ability to filter out waste contaminant/pollutants before it gets to the water table. This varies with different sizes, shapes and arrangements of the soil particles, as evidenced in the use of selected sand and other materials in water filtration plant [1]. Soils, particularly those with clay particles, may selectively attract, absorb, and bind toxins and other materials that would otherwise contaminate the environment. Soils may also contain organisms that break down certain contaminants into less harmful materials. This oversight, which can result in possible groundwater pollution, is especially significant in land application of wastewater. Soil, as a filter of toxic chemicals, may adsorb and retain heavy metals from industrial affluent but when the capacity of is reduced due to continuous loading of pollutants, these harmful substance can be release into the major food chain route as well as groundwater [2-4].
In the same manner Nguelu, et al. [5] proved that groundwater contamination by sorbing pollutants results from the size of soil particles which facilitate their transport. Permeability is an important property that is controlled by physical properties of both the soil and the movement of groundwater [6]. Physical properties of soil that control permeability are the grain sizes and the interconnectivity between soil particles. The factors which influence the interconnectivity between the soil particles include; particle shape, density (degree of compaction) and particle size distribution. There are indices used in characterizing particle size distribution of a soil. Commonly used indices include coefficient of uniformity (Cu), coefficient of curvature (Cc), Sorting Coefficient or (So), particle sizes - D10, D25, D30, D50, D60 and D75 in mm and 10%, 25%, 30%, 60% and 75% by weight of soil, passing the respective sieve sizes [7,8]. D10 = grain size corresponding to 10% by weight passing, also referred to as the effective size (mm).
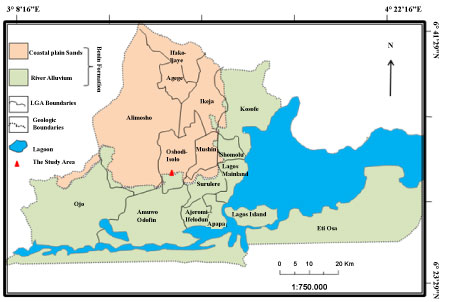
Owing to the shallow nature of the groundwater and the constant dislodging of industrial effluent, the study is aimed at determining the influence of particle size distribution of the soil on groundwater quality around some of these industrial areas of Oshodi (Figure 1) majorly food and wine producing sites. This was done using Geotechnical technique of sieve analysis to determine the particle size distribution of the soil samples as well as the gradation. Physicochemical parameters such as heavy metals (Manganese (Mn), Nickel (Ni), Copper (Cu), Iron (Fe), Cadmium (Cd), Lead (Pb), Chromium (Cr) and (Zinc) Zn), salinity, turbidity, pH, total dissolved solid (TDS), total suspended solid (TSS), biochemical oxygen demand (BOD) and total organic carbon (TOC) were analysed in both water and soil samples. The results from these parameters were compared to those of [9] WHO, Nigerian Federal Environmental Protection Agency [10] standard and also the findings of other researchers like [11,12] Muller, Håkanson, etc. for better understanding of the health risk of humans who rely solely on groundwater in these area.
Materials and Methods
The study area Oshodi occupies 41.98 Km2 of the Lagos landmass (Figure 1). Lithologically, Oshodi is underlain by two different lithologicunit; the coastal plain sand and the alluvial river sand. Both sands are part of Dahomey Basin [13]. Coastal plain sand is the aquifer in the study area though very shallow in general [13].
Sample collection
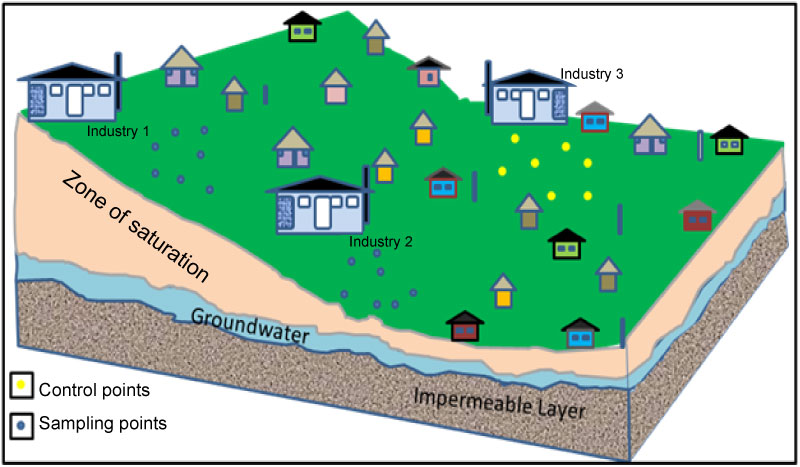
A total of forty-two soil and groundwater samples including the control were collected using systematic method of sampling within three industrial locations in Oshodi at the depth of 1.5 m for soil and 3.0 m for the groundwater. An industrial site with better groundwater quality was used as control (Figure 2). Both soil and groundwater samples were preserved in a refrigerator before transferred to the laboratory for analysis.
Geotechnical analysis
A geotechnical technique of sieving was performed on both soil samples with reference to British Standard Part 2 [14]. Sieve analyses were conducted by using a mesh wire woven sieve size of 4.75 mm at the top and 0.075 mm at the bottom. Soil samples were oven dried at 105 ℃ for 24 hours. 500 g of soil samples were washed through the sieve size of 0.075 mm and then dry again. The mechanical shaker was set to operate for 10 to 15 minutes. The soils retained on top of each sieve were weighed using the balance readable to 0.01 g.
Physicochemical analysis of the soil and water sample
5 g of each of the samples were digested with aqua-regia (3 parts conc. HCl + 1 part conc. HNO3). The clear digest was diluted into a flask with distilled water. The sample solutions were analyzed for Mn, Ni, Cu, Fe, Cd, Pb, Cr and Zn using atomic absorption spectrophotometer (AAS) analyst 200 Perkin Elmer [15].
The turbidity of the water samples was measured using HACH DR 2000 direct spectrophotometer method 8237. Salinity (%) of the water samples was determined using a portable salinity meter. The pH of the samples was estimated using Testr-2 pH meter. TSS in the water samples was measured using JARCH DR 2000 direct reading spectrophotometer, method 8006. The TSS of the samples was estimated against deionized water as blank at a wavelength of 810 nm. TDS was measured using portable combine Electrical conductivity/TDS/Temperature meter (HM Digital COM-100). The BOD was determined using a method proposed by Winkler [16] and modified by Strickland and Parsons [17]. TOC in the soil samples were determined by using Walkey [18] black method.
Result and Discussion
Soil particle size distribution
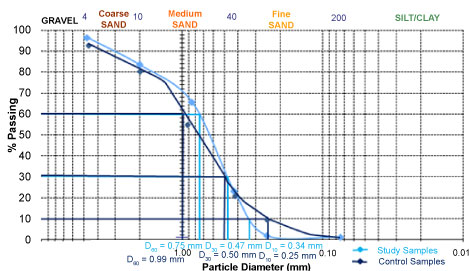
Table 1 is summary of the mean result from sieve analysis carried out on soil samples and the control. This result is used to plot particle size distributions curves for the soil samples and the control (Figure 3). Sieve size of 4.75 mm and above is for gravel, 0.0075-4.75 mm is for sand fraction, while from 0.0075 below is for fines. Based on the sieve size, the soil samples have 3.6% of gravel, 94.6% of sand and 0.8% of fines. Whereas the control showed 5.2% of gravel, 88.5% of sand and 9.5% of fines (Table 1). The control has more of fines the soil sample.
From the plot of percentage passing against particle diameter (Figure 3), the soil sample showed the following indices value: D60 = 0.75 mm, D30 = 0.47 mm and D10 = 0.34 mm. While in control the indices value is as follows: D60 = 0.99 mm, D30 = 0.50 mm and D10 = 0.25 mm.
Cu is an important factor that represents the degree of sorting or gradation of a soil and indicates slope of particle size distribution curve. Cc is another factor representing the grain size distribution that takes into account three points on the grain size distribution curve, reducing the possibility of considering a gap-graded soil as well-graded. Unified Soil Classification System (USCS), adopted by Casagrande [7] calculates Cu, Cc and or So as follows;
Cu = D60/D10, Cc == (D30)2/ D60 x D10, or So = (D75/D25)1/2
Cu < 4 indicates a well-graded soil
Cu < 2 indicates a uniform soil
Cc between 1 and 3 indicates a well-graded soil
Cc < 0.1 indicates a possible gap-graded soil
Equations relating permeability to grain size have a long history beginning with Hazen [19], who developed the well-known empirical equation.
K = C (D10)2
Where:
k = coefficient of permeability (cm/sec)
C = constant (1.2)
The main soil has higher K value (0.139) than the control. According to Bell [20], the higher the K value the more permeable the soil. Fractional difference in fines from the main soil (0.8%) and the Control (9.5%) caused difference in permeability value, 0.139 and 0.075 respectively. These values concurred to the finding of Holtz, et al. [21]. Thus the higher the percentage of fines the lower the permeability value, irrespective of the coarser particles. Particle size distributions observed in both soils summarized in Table 2, have shown how important grain size can be as regards to soil permeability and groundwater flow. The control as calculated from Table 2, So = 1.8, Cu = 4.00, and Cc = 1.00 indicated that the soil is well graded. However the main soil showed; So = 1.8, Cu = 2.20, and Cc = 0.8, suggesting that the soil is poorly graded [7]. In a well graded soil, smaller grains tend to fill the voids between larger grains. Soil particle sizes were well represented in the control than in the soil from the study area.
Soil quality
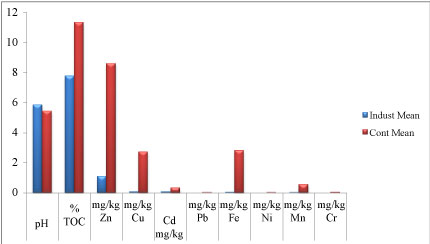
Physicochemical characteristics of the soils: The mean concentrations of all the physicochemical parameters were higher in the control than in study area except for the soil pH (Table 3 and Figure 4). The even distribution soil particle sizes might be the reason for higher concentration of these physiochemical parameters in control than the study soil. Physicochemical qualities tested include;
Soil pH: The mean value was 5.849 with the range of 4.40 to 6.82 and in control, the mean was 5.445 and it ranged from 5.06 to 6.62 mg/kg. Although Soils from the study area were more acidic than in control, there is no DPR [22] permissible limit for pH concentration in the soil.
TOC: This varied from 1.96 to 21.01% and in control, 2.00 to 20.18%. Among all the physicochemical parameters tested in both samples the concentration of TOC is the highest (Figure 4). The mean organic content of the soil in the study area was 7.779% and it was lower than in control (11.367%). Higher TOC content in the control might the reason for higher percentage of fines as observed from the sieve result.
Zinc: Zn averaged 1.095 mg/kg with a range of 0.31 to 1.98 mg/kg. While in control, the average is 8.594 mg/kg and it ranged from 1.84 to 20.41 mg/kg.
Copper: Cu averaged 0.068 mg/kg, and varied from 0.011 to 0.15 mg/kg while the difference of 0.04 to 7.81 mg/kg is for the control with the average of 2.709 mg/kg.
Cadmium: The mean value of Cd is 0.073 mg/kg, and varied from 0.001 to 1.02 mg/kg in control, the mean value 0.332 mg/kg with the range of 0.001 to 1.16 mg/kg.
Iron: Here, the mean value is 0.036 mg/kg with the range of 0.01 to 0.08 mg/kg while in control the mean value is 2.829 mg/kg and the range is 0.02 to 9.11 mg/kg.
Manganese: Mn had an average value of 0.021 mg/kg and varied from 0.004 to 0.05 mg/kg) while in control, the average value is 0.531 mg/kg and it varied from 0.008 to 1.28 mg/Kg.
Lead (Pb), nickel (Ni) and Chromium (Cr): Were completely absent in the samples from the study area but present in control, Pb varied from 0.001 to 0.054 mg/Kg with average of 0.012 mg/kg, Ni; 0.002 to 0.01 and average value of 0.004 mg/kg and Cr; 0.006 to 0.25 mg/Kg with the average value of 0.041 mg/kg.
The physicochemical concentrations of these parameters in the soil samples (Table 3) when compared with the allowable concentration stipulated by department of petroleum resources [22], it was discovered that the concentration of all the elements in both soils meet up the standard.
Ecological risk factor
An ecological risk factor (Eri) for a given contaminant was calculated as suggested by Håkanson [12] Eri=Tri⋅Cif
Where Tri is the toxic-response factor for a given substance, and Cif is the contamination factor. The Tri values of heavy metals by Håkanson [12] are given in Table 4. The following terminologies are used to describe the risk factor: Eri < 40, low potential ecological risk; 40 ≤ Eri < 80, moderate potential ecological risk; 80 ≤ Eri < 160, considerable potential ecological risk; 160 ≤ Eri < 320, high potential ecological risk; and Eri ≥ 320, very high ecological risk.
Where Cif is calculated as follows.
Cif = -Ci0-1/ Cin
Where -Ci0-1 is the mean content of the substance i from the sample sites, and Cin is the geochemical reference level for the substance.
DPR standard for element concentration in the soil was used as background value (Table 3). Based on Håkanson [12] classification, all the heavy metals calculated for ecological risk factor were potentially very low even though those in control were a bit higher than in study area (Table 4). These results have proved that the more well graded the soil particle sizes the more contaminants accumulate and the higher the ecological risk factor [8,23]. The more percentage of fines in the soil, the more soil nutrients are retained provided there is no hydraulic loading Huddleson [24]. Controls samples which were found to be well graded (Table 2) than the soil in the study area happened to be more contaminated because of the even distribution of particle sizes. The ecological risk factor in Cd was the highest among others (Table 4).
Groundwater quality
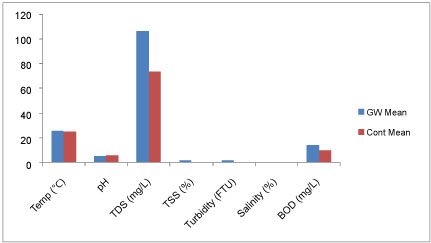
Physicochemical characteristics of groundwater: Unlike what was observed in the soils qualities, the mean concentrations of all the physicochemical parameters were higher in the study area than in control except for the groundwater pH (5.57) which was lower than in control (5.89). These elements seemed to have leached down, possibly due to uneven distribution of the soil particle sizes (i.e. poor gradation of the soil), hence, higher concentrations of these elements in groundwater in the study area than in control [24,25]. The physicochemical parameters tested in groundwater have been summarized in Table 5.
The mean temperature (26.0 ℃) and salinity (0.04%) values for the groundwater samples and the control were the same (Table 5 and Figure 5), suggesting that temperature and salinity quality of groundwater in the study area were not impacted by industrial effluents based on differences in soil particle sizes. According to WHO and NFEPA standard for drinking water quality, salinity is within the permissible limit of 6.0% also within the freshwater range for groundwater [26], but temperature has no permissible limit.
The average value of pH in the study area was 5.57 and varied from 5.10 to 6.67 while in control it averaged 5.89 and varied from 5.10 to 6.68. Three out of fourteen samples felled within WHO/NFEPA limit of 6.5-9.2. In control, three of seven samples fall within WHO/NFEPA. Hence groundwater pH in these areas naturally is a bit acidic.
The concentration of TDS was the highest (Figure 5) among all the physicochemical elements tested in the groundwater samples with the average concentration value of 106.8 mg/l and varied from 18.8 to 255 mg/l. while in control it averaged 74.1 mg/l and varied from 37.1 to 140.0. Both water samples fall within NFEPA limit of 500 mg/l for drinking quality water. However, higher concentration of TDS in the study samples suggests that uneven distribution of soil particles seem to increase the impact of industrial effluent on the groundwater.
The groundwater samples tested for TSS range from 1.0 to 8.0 mg/l and 0.5 to 1.0 mg/l for the control. Though, there is no limit for TSS concentration in water, but comparing the result from two samples, soil particle sizes appeared to have influenced TSS concentration in groundwater.
Turbid concentration was not recorded in six of the fourteen samples from the study area and also in four of the seven samples from the control. Values recorded from the samples ranged from 2.1 to 8.5(FTU) and 2.0 to 2.2 (FTU) for the control. Two samples (8.5 and 5.2 FTU) from the study area fall out of NFEPA limit of 5(FTU) for drinking water while in control, the samples were within the acceptable limit.
Mean concentration of BOD in groundwater samples was 14.7 mg/l and ranged from 9.0 to 35.0 mg/l while in control the mean was 10.4 and varied from 9.0 to 12.0 mg/l. Both fall within the non-polluted water ranges [27].
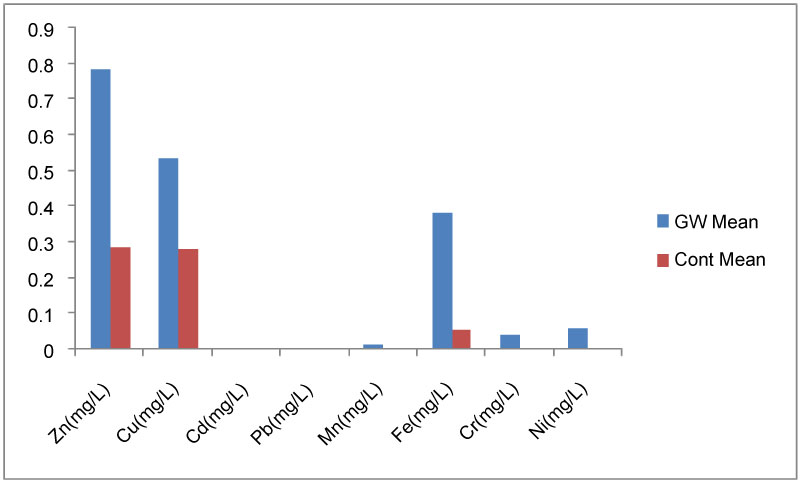
Heavy metals characteristics of the groundwater samples: Result of heavy metals concentration in groundwater samples are shown in Table 6. Unlike the trend observed in soil, the concentrations of heavy metals were higher in groundwater samples from the study area than in control. Owning to the fact that soil particles in the study areas are unevenly distributed, evidence from poor gradation of the soil (Table 2) which caused the soil to be more permeable. The groundwater in the study areas is more vulnerable to influx of contaminants from industrial activities.
Zinc (Zn): The concentration of Zn was the highest among all the heavy metals tested in study area (Figure 6), with the mean concentration of 0.782 mg/l and the range of 0.217 to 1.660 mg/l. While in control, the mean value was 0.284 mg/l and ranged from 0.051 to 0.534 mg/l. Concentration of Zn in all the water samples falls within WHO/NFEPA limit of 3.0 ppm.
Copper (Cu): Cu was the second in concentration after Zn (Figure 6). Presence of copper recorded in thirteen of fourteen water samples were in the range of 0.043 to 2.261 mg/L, with the average of 0.534. In control, it ranged from 0.059 to 0.572 mg/L, and averaged, 0.277 mg/l. The concentration of Cu in all the water samples falls within the WHO/ NFEPA limit of 1.5 mg/l except only one (Table 6). Intentionally high uptakes of Cu in water may cause liver and kidney damage and even lead to death [28].
Cadmium (Cd) and lead (Pb): These elements occurred only in two groundwater samples but absent in the rest including the control samples (Table 6). Cd ranged from 0.003 to 0.005 mg/l while Pb ranged from 0.002 to 0.021 mg/l. One (0.005 mg/l) of the samples ranked higher than WHO/NEFPA limit of 0.003 mg/l for Cd. While in Pb, the two samples did not meet WHO/NFEPA limit of 0.001 mg/l (Table 6). Cd replaces Zn biochemically in the body and causes high blood pressure, liver and kidney damage, and anemia. Pb affects the chemistry of red blood cell, delays normal physical and mental development in babies and young children [29]. From the result analyzed here, industrial effluents could not be the possible source of Cd and Pb in groundwater, but its presence in the soil can introduce these elements into the groundwater by way of leaching since the soil is highly permeable.
Manganese (Mn): The concentration of Mn present in three of the fourteen water samples ranged from 0.003 to 0.130 mg/l, while in control none was found. These values except one (0.130 mg/l) fall within WHO/NFEPA limit of 0.005 mg/l for drinking water. Presence of Mn in these samples might have resulted from anthropogenic activities around the area which possibly leached into the water table due to high permeability of the soil and industrial hydraulic pressure. Increased in concentration of Mn in drinking water over the years has been associated with toxicity to nervous system, producing a syndrome that resembles Parkinsonism [30]. It can also impact colour, odour and taste to water [31].
Iron (Fe): The third in concentration among all the heavy metals in groundwater samples is Fe (Figure 6). It had an average value of 0.383 mg/l and varied from 0.039 to 1.742 mg/l while in control, it averaged 0.053 mg/l with the variation of 0.045 to 0.065 mg/l. Four out of fourteen water samples analyzed in the study area fall out of WHO/NFEPA standard of 0.3 mg/l for quantity of Fe in drinking water. High Fe content in groundwater samples might be the reason behind the characteristic smelly/rusty colour of some of the groundwater in the study area.
Chromium (Cr) and nickel (Ni): Were present in four and three of the groundwater samples respectively. But they were absent in the control. Concentration value of Cr in the water samples ranged from 0.002 to 0.320 mg/l. Two out of the four water samples fall out of the WHO/NFEPA limit (0.05 mg/l) of Cr in drinking water. Excessive intake of chromate can results in acute effects such as gastrointestinal disorders, hemorrhagic diathesis, and convulsions. Death may occur following cardiovascular shock [32]. Ni ranged from 0.001 to 0.730 mg/l. Here only one out of three water samples meets the WHO/NFEPA limit of 0.02 ppm. Drinking water with excess Ni is likely to cause nausea, vomiting, diarrhoea, giddiness, lassitude, headache, and shortness of breath. Poor drinking water generally has been the major source of morbidity and mortality [33].
Conclusion and Recommendation
Influence of particle size distribution on groundwater quality around industrial area of Oshodi-Lagos Nigeria has been evaluated using combined techniques of geotechnical and physicochemical analysis. Results from the above techniques showed that;
• Particle sizes of soil were unevenly distributed in the study area, hence poor gradation of the soil and increase in permeability. In control, soil particle sizes were well represented than in the study area.
• The mean concentrations of all the physicochemical parameters were higher in the control than in study area except for the soil pH (i.e. 5.849 mean value for the study area and 5.445 for the control). All the physicochemical results from the soil samples meet up the DPR standard for metal concentration in the soil. The ecological risk factor was potentially very low. The more well graded the soil particle sizes the more contaminants accumulate.
• Unlike what was observed in the soils qualities, the mean concentrations of all the physicochemical parameters and heavy metals were higher in groundwater samples in the study area than in control except for the groundwater pH (5.57) which was lower than in control (5.89). Possibly, this is due to uneven distribution (poor gradation) of soil particle sizes in the study soil. Hence this defect causes more influx of these parameters into groundwater in the study area unlike in control.
• Parameters like salinity, TDS, BOD, Zn and Cu were within the WHO/NFEPA permissible for drinking water while some like; Turbidity, pH, Cd, Pb, Mn, Fe, Cr and Ni were not within the limit.
Acknowledgement
The authors acknowledge the contributions of the Environmental/Engineering Geological group, University of Nigeria Nsukka towards the success of this work. The authors are also grateful for the support received from staff and postgraduate students at the Department of Geology, University of Nigeria Nsukka.
References
- Oldecop LA, Rodari GS, Munoz JJ (2017) Atmosphere interaction and capillary barrier in filtere tailings. Geotechnical and Geological Engineering 35: 1803-1817.
- Brandy NC, Weil RR (1996) The nature and properties of soils. (11th edn), Upper Saddle River, Prentice Hall, NewJersy.
- Khan S, Cao Q, Zhang YM, et al. (2008) Health risks of heavy metals in contaminated soils and food crops irrigated with wastewater in Being, China. Environmental Pollution 152: 686-692.
- Ebrahim JE, Salih AA, Abahussain A (2016) Effect of long-term irrigation using treated wastewater on heavy metal contents of soils grown to Medicago sativa in the Kingdom of Bahrain. International Journal of Advance Agricultural Research 4: 20-29.
- Ngueleu KS, Grathwohl P, Cirpka AO (2013) Particle-facilitated transport of lindane in water saturated tropical lateritic porous media. J Environ Qual 43: 1392-1403.
- DeGroot DJ, Ostendorf DW, Judge AI (2012) In situ measurement of hydraulic conductivity of saturated soils. Geotechnical Engineering Journal of the SEAGS & AGSSEA 43: 63-72.
- Casagrande A (1948) Classification and identification of soils. Trans Amer Soc Civil Eng 113: 901-930.
- Onur EM (2014) Predicting the permeability of sandy soils from grain size distributions.
- World Health Organization (2011) Guidelines for drinking water quality. (3rd edn), WHO press, Geneva, 171.
- Nigeria Federal Environmental Protection Agency (NFEPA) (1997) Coastal profile of Nigeria. Centre for Environment and Development in Africa, Abuja.
- Muller G (1969) Index of geoaccumulation in sediments of the Rhine river. Geo Journal 2: 108-118.
- Hakanson L (1980) An ecological risk index for aquatic pollution control: A sedimentological approach. Water Research 14: 975-1001.
- Ukah BU, O Igwe and P Ameh (2018) Impact of industrial wastewater on the physicochemical and microbiological characteristics of groundwater in Ajao-Estate Lagos, Nigeria. Environmental Monitoring and Assessment.
- British Standard (1990) Methods of test for soils for civil engineering purpose. British Standards Institution, London.
- Alloway BJ (1996) Heavy metal in Soil. Halsted Press, John Wiley and Sons Inc, London, 280-339.
- Winkler LW (1888) Die bestimmung des in wassergelösten sauerstoffen. Berichte der Deutschen Chemischen Gesellschaft 21: 2843-2855.
- Strickland JDH, Parsons TR (1968) Determination of dissolved oxygen. In: A Practical Handbook of Seawater Analysis. Fisheries Res Board of Canada, Bullet, 167: 71-75.
- Walkley A (1974) A critical examination of a rapid method for determining organic carbon in soils: Effect of variations in digestion conditions and of organic soil constituents. Amer J Soil Sc Soc 63: 251-263.
- Hazan A (1892) Annual report: Some physical properties of sands and gravels: Mass. State Board of Health, 539-556.
- Bell FG (2007) Engineering geology. (2nd Edn), Elsevier, London, 207-248.
- Holtz RD, Kovacks WD, Sheahan TC (2011) An introduction to geotechnical engineering. Upper Saddle River, Prentice-Hall, New Jersey.
- Department of Petroleum Resources (DPR) (2002) Environmental guidelines and standards for the petroleum industry in Nigeria. Ministry of Petroleum and Natural Resources, Abuja, Nigeria.
- Daniel PP (2004) How does soil texture affects infiltration. California State Science Fair.
- Huddleson JH (1996) How soil properties affect groundwater vulnerability to pesticide contamination. Extension soil science specialist, Oregon State University Press, Oregon.
- RadwanAM, Baligh FA (1999) Industrial liquid waste and integrity of calcerious sand from AinHelwan, Cairo. Geotech Dev Afr 1: 263-271.
- Davis SN, DeWiest RJM (1966) Hydrogeology. John Wiley & Sons, New York, 465.
- Chapman D, Kimstach V (1992) The selection of water quality in water quality assessments. Chapman and Hall Ltd: London, 51-119.
- Hamdan AMA, Rady ARA (2013) Vulnerability of the groundwater in the quaternary aquifer at El Shalal-Kema area, Aswan, Egypt. Arabian Journal of Geosciences 6: 337-358.
- Al-Othman AM, Al-Othman ZA, El-Desoky GE, et al. (2013) Lead in drinking water and human blood in Riyadh City, Saudi Arabia. Arabian Journal of Geosciences 6: 3103-3109.
- Gupta SK, Murthy RC, Chandra SV (1980) Neuromelanin in manganese-exposed primates. Toxico Lett 6: 17-20.
- Washington State Department of Health (WSDH) (2011) Colour, taste odour problems in drinking water.
- Janus JA, Krajnc EI (1990) Integrated criteria document chromium: Effects. Appendix: Bilthoven, National Institute of Public Health and Environmental Protection, Netherlands.
- Wang QR, Cui YS, Liu XM, et al. (2011) Soil contamination and plant uptake of heavy metals at polluted sites in China. J Environ Sci Health A Tox Hazard Subst Environ Eng 38: 823-838.
Corresponding Author
Bernadette U Ukah, Department of Geology, Environmental Monitoring Unit, University of Nigeria, Nsukka, Nigeria, Tel: +234-7038479934.
Copyright
© 2019 Ukah BU, et al. This is an open-access article distributed under the terms of the Creative Commons Attribution License, which permits unrestricted use, distribution, and reproduction in any medium, provided the original author and source are credited.