Evaluation of the Plant's Role in Greenhouse Gas Emissions in Furrow-irrigated Rice
Abstract
The role of rice ( Oryza sativa ) plants themselves at facilitating methane (CH 4 ) emissions from flood-irrigation has been well-established. However, as alternate water management schemes, such as furrow-irrigation, grow in use, the role of rice plants facilitating CH 4 and nitrous oxide (N 2 O) emissions needs to be evaluated. The objective of this study was to characterize the effect of rice plants (i.e., with plants and bare soil) on CH 4 , N 2 O, and carbon dioxide (CO 2 ) fluxes, season-long emissions, and global warming potential (GWP) estimates in furrow-irrigated rice on a silt-loam soil (Typic Albaqualfs) in eastern Arkansas during 2019. Carbon dioxide and CH 4 fluxes were generally greater ( P < 0.05) from the with-plants than the bare-soil treatment over time, while, averaged over time, N 2 O flux from bare soil (0.15 mg m -2 hr -1 ) was 1.7 times greater ( P < 0.05) than with plants (0.085 mg m -2 hr -1 ). Season-long CO 2 and CH 4 emissions were at least 3.2 times greater ( P < 0.05) from the with-plants treatment. Three-gas (i.e., CH 4 , N 2 O, and CO 2 ) GWP estimates were approximately 13,000 kg CO 2 eq. ha -1 season -1 greater ( P < 0.05) from the with-plants than the bare-soil treatment, but two-gas (i.e., only CH 4 and N 2 O) GWP estimates were unaffected ( P > 0.05) by treatment. Results of this study indicate that, at least in the up-slope position, CH 4 and N 2 O emissions measured in the with-plant area atop beds are reasonably representative of both the with-plant, top-of-bed area and the furrow area of a furrow-irrigated rice field with few to no plants present.
Keywords
Methane, Nitrous oxide, Carbon dioxide, Global warming potential, Rice production, Arkansas
Introduction
Agriculture, forestry, and other associated land uses account for an estimated 24% of global greenhouse gas (GHG) emissions, where ~16% of global GHG are methane (CH 4 ) [25]. It has also been estimated that rice ( Oryza sativa ) cultivation specifically accounts for a significant portion (~11%) of global annual CH 4 emissions, which has led to rice being globally identified as a major GHG-producing crop [1]. In the United States (US), Arkansas is the leading rice-producing state, where ~8.3 Mg grain ha -1 were produced in 2022, which represented 50.1% of the total US rice production [2].
Rice is typically grown using flood-irrigation, which consists of installing levees to retain water then permanently flooding the field 28 to 34 days after planting, or once the rice plants reach the 4- to 5-leaf stage [3]. Flood-irrigation is used to create a layer of stagnant surface water that helps to reduce weeds and disease, thus increasing profitability [4]. However, flood-irrigation uses large quantities of water, which contributes to depleted aquifers in the Lower Mississippi River Valley and creates an anaerobic soil environment that leads to abundant CH 4 emissions [5,6]. Alternative water management schemes (i.e., furrow-irrigation or alternate wet and dry) have been shown to minimize GHG emissions, namely CH 4 , and reduce rice’s global warming potential (GWP) [6-8].
Furrow-irrigation consists of creating raised beds along a gently sloping landscape, allowing irrigation water to flow by gravity in furrows between raised beds from the up- to the downslope position, which wets the raised beds, thus watering the rice plants [4]. In Arkansas, furrow-irrigation accounts for ~10.5% of planted-rice area and, as recent trends have shown, furrow-irrigation is expected to continue to expand in use due to documented water conservation without a significant effect on yield [4]. However, in contrast to flood-irrigation, furrow-irrigation reportedly creates variable field conditions of oxidation-reduction (redox) potential and soil moisture, which can minimize CH 4 emissions, but potentially increase nitrous oxide (N 2 O) emissions, for which each molecule of N 2 O has a nearly 10-fold greater GWP than CH 4 [6,9,10].
An increase in N 2 O emissions in furrow-irrigated rice is influenced primarily by soil moisture content, which impacts oxygen (O 2 ) availability and microbial processes [11,12]. Elevated, but not saturated, soil moisture contents (i.e., > 60% water-filled pore space), similar to soil moisture contents in furrow-irrigated rice fields, create an O 2 -limited environment that is ideal for denitrifying bacteria, which are the primary source of N 2 O production in soil [13]. However, in anaerobic environments (i.e., flooded-soil conditions), the relatively quick development of reducing conditions causes denitrification to nearly cease and methanogenic microorganisms begin decomposing soil organic matter to produce and release CH 4 [14,15].
It has been demonstrated that, under flood-irrigation, the rice plant itself acts as a conduit to facilitate gas transfer between the soil and the atmosphere through aerenchyma tissue [16], providing a means for O 2 to be transported into the soil to the rhizosphere and for CH 4 trapped in the soil below the flood water to be released to the atmosphere. In Arkansas, Rogers, et al. [17] quantified season-long CH 4 emissions from flood-irrigated rice on a silt loam, specifically evaluating the effects of optimally fertilized rice and non-fertilized bare soil. Results showed that the fertilized, with-plants treatment emitted four times more CH 4 than the unfertilized, bare-soil treatment [17]. Similarly, Brye, et al. [18] evaluated the effects of soil texture (i.e., silt loam and clay) and plant presence on CH 4 fluxes and emissions in flood-irrigated rice in Arkansas. Results showed that CH 4 emissions between flooding and harvest were 6.1 and 20.9 times greater when rice plants were present in the silt-loam and clay soils, respectively [18].
Despite the reported substantial CH 4 emissions reduction from bare soil (i.e., without plants present) compared to plants being present in flood-irrigated rice, coupled with the expanding use of furrow-irrigated rice production, the potential role of the rice plant itself at facilitating gas exchange between the soil and atmosphere under furrow-irrigation, where there is no flood, warrants evaluation. Therefore, the objective of this study was to quantify the effect of the presence of rice plants (i.e., with and without plants) on GHG (i.e., CO 2 , CH 4 , and N 2 O) fluxes, season-long emissions, and GWP estimates at an up-slope site position under no-tillage (NT) in furrow-irrigated rice on a silt-loam soil in eastern Arkansas. It was hypothesized that the presence of rice plants will increase CO 2 , CH 4 , and N 2 O fluxes, season-long emissions, and GWP estimates compared to bare soil without plants.
The GHG flux and emissions data constituting the with-plants treatment in this study were previously reported as part of two larger-scale field studies [7,19]. However, paired with the previously reported with-plants data from only the up-slope position until NT management, the combined dataset with bare-soil results represents a new dataset, where new statistical analyses address a different objective than what has previously been evaluated.
Materials and Methods
The current study was conducted in the same production-scale, furrow-irrigated rice field and at the same time as several other field studies [6,7,9,19]. The other field studies evaluated multiple aspects of furrow-irrigated rice, such as the effects of site position and tillage treatment effect on near-surface soil property variations (i.e., oxidation-reduction potential, soil temperature, and soil moisture), rice agronomic response, GHG fluxes over time, and season-long GHG emissions [6,7,9,19].
Site Description, Treatments, and Experimental Design
Similar to Della Lunga, et al. [6,7,9] and Slayden, et al. [19], the current study was conducted at the Rice Research and Extension Center (34.46°N, -91.46°W), near Stuttgart, AR in Arkansas County, between May and September 2019. The specific study site was in the up-slope region of a 16-ha, production-scale, furrow-irrigated rice field, 91-m north of the south end of the field, which was the field’s highest point of elevation. The soil throughout the study area is mapped as a poorly drained Dewitt silt loam (fine, smectitic, thermic Typic Albaqualfs) [20]. The specific study area was conducted in a strip of NT (i.e., stale seedbed) soil management that was 6-m wide and extended the ~ 140m of the up-slope study area with a 2% slope. The 30-yr (1991-2020) annual average air temperature in the region is 17.3 °C [21]. The 30-yr (1991-2020) annual mean precipitation is 128.8 cm [22].
This study was established as a completely random design. Two experimental treatments were evaluated, a vegetated soil surface and bare soil. Each treatment was spatially replicated three times.
Field Management
As described in more detail by Della Lunga, et al. [6,7], the hybrid cultivar ‘214-Gemini’ (Rice Tec Inc., Alvin, TX) was planted on 30 April, 2019 with a 19-cm row spacing at a rate of 21 kg seed ha -1 . The previous years’ raised beds had been maintained and were treated with a NT furrow-runner implement (Perkins Sales Inc., Bernie, MO) to ensure the furrow was open for unobstructed water flow during irrigation. On 16 May, 2019, at approximately the 2- to 3-leaf stage, the study received 101 kg P ha -1 as triple superphosphate, 67 kg K ha -1 as muriate of potash, 11 kg Zn ha -1 as Zinc 20, and 23 kg N ha -1 and 27 kg S ha -1 as ammonium sulfate. On 3 June, 2019, at approximately the 3- to 4-leaf stage, the study received 168 kg N ha -1 of urease-inhibitor-coated urea (46% N). All fertilizers were mechanically broadcast-amended to the soil surface.
Immediately after rice planting, six, 30-cm diameter by 30-cm tall, polyvinyl chloride (PVC) base collars for gas sampling, with a beveled bottom and four, 12.5-mm-diameter holes drilled 12 cm up from the beveled end to allow free movement of water, were installed by pounding the collar into the ground with a mallet atop raised beds in the study area. Three base collars were installed in the to-be vegetated area atop alternating raised beds to constitute the with-plants treatment, while three additional base collars were installed atop the raised beds between where the with-plants collars were installed to constitute the bare-soil treatments. Thus, all six base collars were in a 6-m-long row, perpendicular to the predominant field slope, with base collars representing the two treatments for gas sampling on alternating raised beds in the six total raised beds that comprised the strip of NT field management. Once emerged, rice plants were manually removed from the bare-soil collars and were maintained plant-free for the remainder of the growing season.
The study area was furrow-irrigated approximately weekly throughout the growing season, but more frequently if needed, from 13 June, 2019 to 4 September, 2019 using a 30-cm-diameter lay-flat polypipe that was placed parallel to the study site at the south end of the field, where a tail-water pump at the north/down-slope end of the field returned surface water back to the upper crown of the field [23]. Weeds were managed as needed with various herbicide applications, where additional details regarding weed management throughout the growing season were reported in Slayden, et al. [19].
Greenhouse Gas Measurements
Similar to Della Lunga, et al. [6,7] gas sampling occurred 16 times throughout the growing season, approximately weekly, from three weeks after rice planting to harvest [i.e., 21, 28, 35, 42, 49, 56, 63, 70, 77, 84, 91, 98, 105, 112, 118, and 125 days after plating (DAP)]. Immediately prior to gas sampling from single base collar, the four, 12.5-mm-diameter holes were plugged with 1.3-cm diameter rubber stoppers (part #73828A-RB, Voigt Global, Lawrence, KS) and a PVC cap (i.e., 10-cm tall by 30-cm diameter) was placed atop the base collar and sealed with a rubber flap to create a closed chamber. On the underside of the cap, a small fan was mounted that was powered with a 9-V battery to circulate the air inside the enclosed headspace. On the side of the cap, a 15-cm-long piece of copper refrigerator tubing was installed to provide pressure equilibration with the outside, ambient air. On the top of the cap, two septa were installed, one to serve as the gas extraction point and one to serve as a thermometer insertion point to monitor the air temperature inside the closed chamber during gas sampling. When necessary, chamber extensions were mounted on top of the base collars prior sampling to accommodate the growth of the plants during the growing season. Caps and extensions were covered in reflective aluminum tape to reduce temperature variations inside the closed chambers during sampling. Gas samples were collected three times over a 1-hour period, at the 0-, 30-, and 60-minute marks, using a 25-mL syringe. Collected gas samples were transferred from the syringe to pre-capped (20-mm headspace crimp cap; part #5183-4479, Agilent Technologies, Santa Clara, CA), pre-evacuated 10-mL glass vials (part #5182-0838, Agilent Technologies, Santa Clara, CA).
Within generally 48 hours after collection, gas samples were analyzed on a Shimadzu GC-2014 ATFSPL 115-V gas chromatograph (GC; Shimadzu North America/Shimadzu Scientific Instruments Inc., Columbia, MD). For CH 4 and CO 2 concentration measurements, a flame ionization detector was used, while an electron capture detector was used to quantify N 2 O concentrations. Helium was the carrier gas used for sample analyses. Gas fluxes from a given chamber on a given sample date were calculated as the linear slope among the three gas sample concentrations from the 0-, 30-, and 60-minute marks during which the chamber was sealed with the cap.
Similar to Della Lunga, et al. [7] and Slayden, et al. [19], season-long emissions were estimated on a chamber-by-chamber basis using linear interpolation between individual flux measurements on consecutive sample dates. Global warming potentials were calculated on a chamber-by-chamber basis using conversion factors of 34 and 298 for CH 4 and N 2 O, respectively, from the Intergovernmental Panel on Climate Change (IPCC) 5 th GHG emissions assessment [1] and conversion factors of 28 and 265 for CH 4 and N 2 O, respectively, from the IPCC 6 th assessment [24] to obtain CO 2 equivalents [7]. A conversion factor of 1 was assigned to CO 2 under both assessments. Two sets of GWPs were calculated based on both the 5 th and 6 th assessments: i) CH 4 and N 2 O only, and ii) CH 4 , N 2 O, and CO 2 . Global warming potentials were calculated using conversion factors from IPCC’s 5 th and 6 th assessments to facilitate comparison to past reports that used conversion factors from IPCC’s 5 th or 6 th assessments. Flux and emissions data from the three replicate base collars for the with-plants treatments were taken from Della Lunga, et al. [6,7].
Statistical Analyses
Based on a completely random design for the field treatment, a two-factor analysis of variance (ANOVA) was conducted using PROC GLIMMIX in SAS (version 9.4, SAS Institute, Inc., Cary, NC) to evaluate the effect of field treatment (i.e., with plants and bare soil), time (i.e., sample date), and their interaction on CO 2 , CH 4 , and N 2 O fluxes. A one-factor ANOVA was conducted in SAS to evaluate the effect of field treatment (i.e., with plants and bare soil) on season-long CO 2 , CH 4 , and N 2 O emissions and the four GWP-related parameters. All data were analyzed using a gamma distribution. Significance was judged at P < 0.05 and, when appropriate, means were separated by least significant difference at the 0.05 level.
Results and Discussion
Gas fluxes
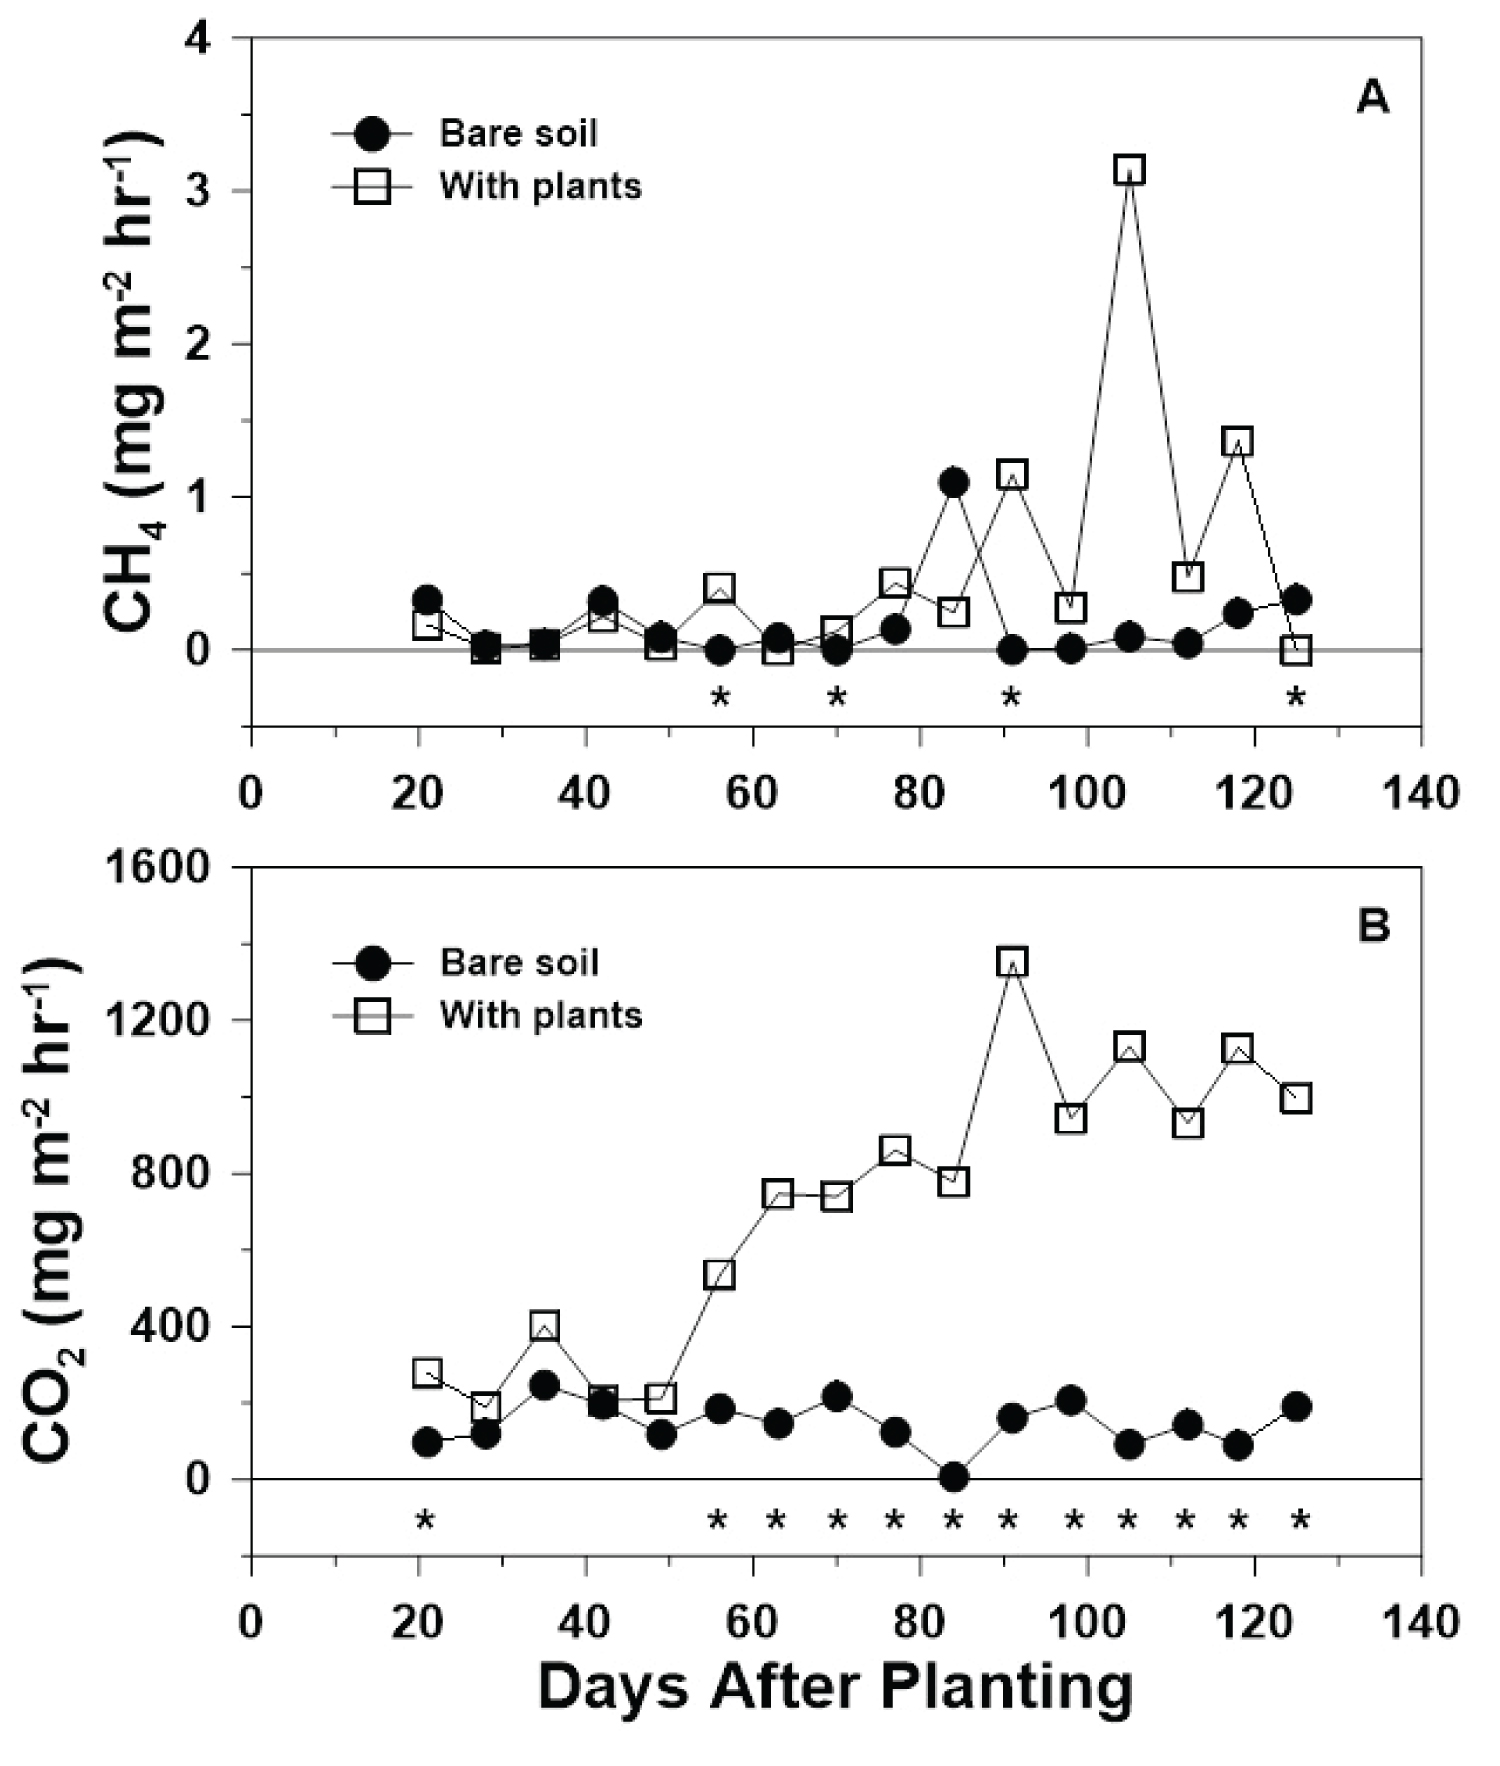
Methane fluxes in both treatments started relatively low at the beginning of the growing season (0.33 and 0.16 mg m -2 hr -1 for the bare-soil and with-plants treatment at 21 DAP, respectively), but the bare-soil CH 4 fluxes remained below 0.32 mg m -2 hr -1 and relatively constant until a numeric flux spike at 84 DAP, followed by a numeric decrease and plateau for the remainder of the growing season (Figure 1A). In contrast, the with-plants treatment slowly increased throughout the growing season to a peak at 91 DAP, then to a greater peak numeric flux at 105 DAP, followed by a general numeric decrease to the end of the growing season (Figure 1A). Methane fluxes from the bare-soil treatment ranged from 0 mg m -2 hr -1 at 56 and 70 DAP to 1.02 mg m -2 hr -1 at 84 DAP, while CH 4 fluxes from the with-plants treatment ranged from 0 mg m -2 hr -1 at 125 DAP to 3.14 mg m -2 hr -1 at 105 DAP (Figure 1A).
Methane fluxes differed ( P < 0.01) between the bare-soil and the with-plants treatments over time throughout the 2019 growing season (Table 1). For the bare-soil treatment, seven sample dates (i.e., 28, 35, 56, 70, 91, 98, and 112 DAP) had CH 4 fluxes that were greater ( P < 0.05) than a flux of zero, while, for the with-plants treatment, five sample dates (i.e., 28, 35, 49, 56, and 125 DAP) had CH 4 fluxes that were greater than a flux of zero. Methane fluxes differed between treatments on four of the 16 sample dates (i.e., 56, 70, 91, and 125 DAP; Figure 1A). Methane fluxes did not differ between treatments until the sixth sample date (i.e., 56 DAP), then did not differ again until two weeks later (i.e., 70 DAP), which was followed by three sample dates until differing again (i.e., 91 DAP), and then a final five weeks where no difference was observed until the last sample date (i.e., 125 DAP; Figure 1A).
The role of plants in the release of CH 4 was highlighted by the days during which significant difference between treatments was reported and were most concentrated in the second half of the growing season, starting at 56 DAP when, during tiller growth, the aerenchyma tissue gets fully developed [3]. Methane fluxes from the with-plants treatment were indeed larger than from the bare-soil treatment on three of the four sample dates where a significant difference between treatments occurred, which was likely due to enhanced CH 4 transport from the soil to the atmosphere through the aerenchyma tissue of the rice plants themselves [16,17] along with direct diffusion since there was no overlying layer of flood water to travel through under the furrow-irrigated conditions.
Other studies have evaluated CH 4 fluxes in furrow-irrigated rice. Similar to the results of this study, Della Lunga, et al. [6] evaluated relationships between greenhouse gas fluxes (i.e., CH 4 , N 2 O, and CO 2 ), GWP, soil properties, and environmental factors in furrow-irrigated rice on the same field as the current study over the 2018 and 2019 growing seasons. Results showed that CH 4 fluxes were < 2 mg m -2 hr -1 during the first half of the 2018 growing season and CH 4 fluxes were > 2 mg m -2 hr -1 around the end of the growing season [6]. However, in contrast to the results of this study, during the 2018 growing season, the CH 4 flux maximum was observed 10 days later and the CH 4 flux minimum was observed about 40 days earlier for the up-slope, NT treatment with-plants [6]. Timing differences were likely due to variability in irrigation application and rainfall [6]. Furthermore, similar to the results of the current study, Della Lunga, et al. [7] reported that CH 4 fluxes differed over time during both the 2018 and 2019 growing seasons. In contrast to the current study, Hang, et al. [25] evaluated the effects of direct seeding and water management schemes (i.e., traditional flood, furrow, and drip irrigation) on rice yield and CH 4 and N 2 O emissions on a poorly drained soil in Yinchuan City, Ningxia Province, China. Results showed that CH 4 flux maximum of approximately 6 mg m -2 hr -1 and generally greater CH 4 fluxes from the furrow-irrigated treatment throughout the 120-day study period than from the with-plants treatment of the current study [25]. Differences in CH 4 fluxes from the current study and the furrow-irrigated treatment in Hang, et al. [25] were likely due to differing soil water contents, which could be due to the lowland site-position used in Hang, et al. [25] or rainfall differences. Furthermore, Karki, et al. [26] quantified grain yield and CH 4 and N 2 O fluxes from furrow-irrigated rice on a silty-clay soil in northeast Arkansas and reported generally lower CH 4 fluxes than the current study.
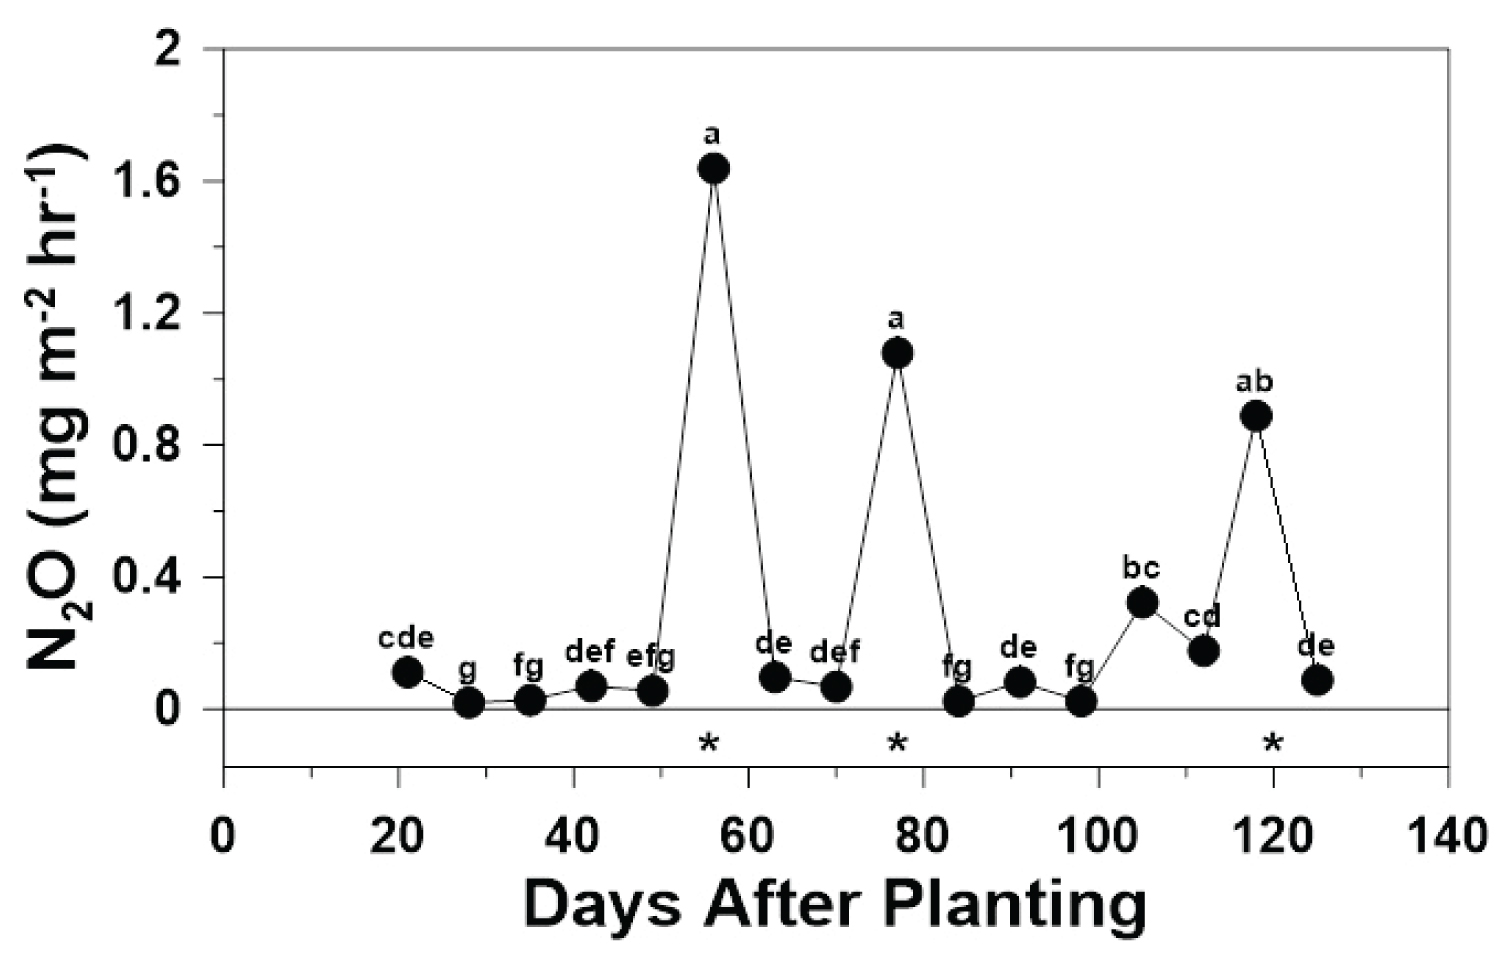
N 2 O: Nitrous oxide fluxes were relatively low and steady throughout the 2019 growing season, but three distinct numeric peak N 2 O fluxes were observed at 56, 77, and 118 DAP (Figure 2). Nitrous oxide fluxes from the bare-soil treatment ranged from 0.02 mg m -2 hr -1 at 35 DAP to 1.9 mg m -2 hr -1 at 56 DAP, while N 2 O fluxes from the with-plants treatment ranged from 0.01 mg m -2 hr -1 at 28 DAP to 1.4 mg m -2 hr -1 at 56 DAP. However, in contrast to CH 4 , N 2 O fluxes were greater ( P < 0.05) than a flux of zero on only three of the sixteen sample dates (i.e., 56, 77, and 118 DAP; Figure 2).
In contrast to CH 4 , N 2 O fluxes differed over time ( P < 0.01) and differed between treatments ( P = 0.01) throughout the 2019 growing season (Table 1). Averaged across treatment, N 2 O fluxes were numerically largest at 56 DAP and did not differ from N 2 O fluxes at 77 and 118 DAP, which were at least 2.8 times greater than all other N 2 O fluxes (Figure 2). However, of the three numeric peaks, only the N 2 O flux at 118 DAP did not differ from the N 2 O flux at 105 DAP (Figure 2). Furthermore, N 2 O fluxes were numerically smallest at 28 DAP, which did not differ from 35, 49, 84, and 98 DAP (Figure 2). In contrast to CH 4 , the lack of difference between treatments over time was likely because N 2 O emissions do not occur predominantly through the plants themselves, but rather through simple diffusion from the soil to the atmosphere. The fluctuating, moist to wet, yet aerobic, soil conditions created by furrow-irrigation [9] are an ideal environment for the coupled nitrification-denitrification processes to produce N 2 O as a by-product of incomplete denitrification, which converts NO 3 - to N 2 O gas [13]. The peak N 2 O fluxes reported in this study coincided with spikes in volumetric soil water contents in the NT/up-slope portion of the larger field, highlighting the fundamental role of environmental parameters at regulating gaseous-N losses [7,9].
Averaged across time, the whole-season mean N 2 O flux from the bare-soil (0.15 mg m -2 hr -1 ) was 1.7 times greater than the with-plants (0.085 mg m -2 hr -1 ) treatment. It is likely that N 2 O flux from the bare-soil treatment was greater than from the with-plants treatment because the absence of plants in the bare-soil treatment allowed all applied N to be used as denitrification substrate by microbes, thus causing a greater N 2 O flux. However, with plants present, the majority of applied N was likely assimilated by the plants, making much of the applied N unavailable for microbes to carry out denitrification, leading to a lower N 2 O flux.
Nitrous oxide fluxes during the 2018 growing season under NT at the up-slope position with plants ranged from < 0.01 mg m -2 hr -1 at 108 DAP to 6 mg m -2 hr -1 at 33 DAP [6,19], which was about three times greater than the N 2 O flux maximum reported in the current study, but similar to the N 2 O flux minimum recorded for the current study. In addition, similar to the results of the current study, Slayden, et al. [19] reported that N 2 O fluxes differed over time during both the 2018 and 2019 growing seasons. Hang, et al. [19] reported generally greater N 2 O fluxes throughout their study period than in the current study, but the N 2 O flux maximum from the current study was approximately eight times greater. The difference in flux maxima may be explained by differences in fertilizer-N applications between the two studies [6,25] where the largest N application in Hang, et al. [25] was 96 kg ha -1 as urea, which was 1.75 times less than the largest N application in the current study. In addition, Karki, et al. [26] reported a peak N 2 O flux one week after the second fertilizer-N application of approximately 2.2 mg m -2 hr -1 , which was similar to the peak N 2 O flux measured in the current study.
CO 2 : As expected, CO 2 fluxes in both treatments started relatively low at the beginning of the growing season (97 and 277 mg m -2 hr -1 for the bare-soil and with-plants treatment at 21 DAP, respectively), but the bare-soil CO 2 fluxes remained steady for the remainder of the growing season (Figure 1B). In contrast, the with-plants treatment generally increased throughout the growing season to a peak numeric flux at 91 DAP, followed by a numeric decrease and plateau at approximately 100 DAP to the end of the season (Figure 1B). Carbon dioxide fluxes from the bare-soil treatment ranged from 7 mg m -2 hr -1 at 84 DAP to 247 mg m -2 hr -1 at 35 DAP, while CO 2 fluxes from the with-plants treatment ranged from 188 mg m -2 hr -1 at 28 DAP to 1355 mg m -2 hr -1 at 91 DAP (Figure 1B).
Similar to CH 4 , but in contrast to N 2 O, CO 2 fluxes differed ( P < 0.01) between the bare-soil and with-plants treatments over time throughout the 2019 growing season (Table 1). For both treatments, all CO 2 flux means over time were greater ( P < 0.05) than a flux of zero. Additionally, CO 2 fluxes differed between treatments on 12 of the 16 sample dates (i.e., 21, 56, 63, 70, 77, 84, 91, 98, 105, 112, 118, and 125 DAP), where the CO 2 flux from the with-plants was greater than the bare-soil treatment on all 12 dates (Figure 1B). Carbon dioxide fluxes differed between treatments on the first sample date of the 2019 growing season (i.e., 21 DAP), were then similar between treatments for the next four sample dates, then differed between treatments on all sample dates from 56 DAP to the end of the growing season (i.e., 125 DAP; Figure 1B).
Similar to CH 4 , differences in CO 2 fluxes between the bare-soil and with-plants treatment were due to plant presence/absence, where the with-plants treatment had a greater CO 2 flux because of the root respiration contribution to the total CO 2 flux. Furthermore, the contribution of root respiration to the total CO 2 flux also explains why CO 2 fluxes from the with-plants treatment were greatest towards the end of the growing season. The steep initial increase in CO 2 fluxes followed by fluxes leveling off some matches the rate of metabolic processes rice plants go through, where the rate is greater during the vegetative phase (i.e., first half of the growing season) and lower during the reproductive phase (i.e., second half of the growing season) [3].
Della Lunga, et al. [6] reported that CO 2 fluxes for the 2018 growing season ranged from 58.7 mg m -2 hr -1 at 27 DAP to 1101 mg m -2 hr -1 at 89 DAP under NT in the up-slope position, which was similar to the timing of the CO 2 flux maximum and minimum (i.e., 28 and 91 DAP, respectively), but was smaller than the minimum and maximum CO 2 flux values (i.e., 188 and 1355 mg m -2 hr -1 , respectively) from the current study. In addition, similar to the results of the current study, Della Lunga, et al. [7] reported that CO 2 fluxes differed over time during both the 2018 and 2019 growing seasons. Furthermore, Xu, et al. [27] evaluated water management strategies (i.e., continuous flooding, flooded and wet intermittent irrigation, and flooded and dry intermittent irrigation) and cultivar effects on GHG emissions from a silty clay loam in Huqiao, Hubei Province, China. Results showed an average CO 2 flux between two cultivars of 509 mg m -2 hr -1 from the flooded and wet intermittent irrigation treatment throughout the 117-day field study, which fell within the CO 2 flux range reported in the with-plants treatment in the current study (Figure 1B) [27].
Season-Long Gas Emissions
Season-long CH 4 and CO 2 emissions differed ( P < 0.05), while season-long N 2 O emissions did not differ ( P > 0.05) between treatments (Table 2). Season-long CH 4 emissions were 3.2 times greater from the with-plants than from the bare-soil treatment (Table 2). Similar to CH 4 , season-long CO 2 emissions were 4.9 times greater from the with-plants than from the bare-soil treatment (Table 2). In contrast, season-long N 2 O emissions were unaffected by treatment and averaged 8.4 kg ha -1 season -1 (Table 2).
seasons season
Similar to CH 4 fluxes, season-long CH 4 emissions were clearly related to CH 4 transport differences between treatments, where the aerenchyma cells in the plants themselves provide the conduit for CH 4 release from the soil and O 2 transport to the roots. Della Lunga, et al. [6] reported that season-long CH 4 emissions from the 2018 growing season at the up-slope position under NT management ranged from 6 to 13.3 kg ha -1 , which was similar to season-long CH 4 emissions from the with-plants treatment in the current study (13.2 kg ha -1 season -1 ; Table 2). Furthermore, similar to the results of the current study, Della Lunga, et al. [7], which evaluated season-long GHG emissions and GWP between conventional-tillage and NT treatments on the same field as the current study, reported that season-long CH 4 emissions between tillage treatments averaged approximately 10 kg ha -1 season -1 . Rogers, et al. [17], who quantified CH 4 fluxes and season-long emissions in eastern Arkansas from a fertilized, bare-soil treatment and an optimally fertilized, with-plants treatment on a silt-loam soil in flood-irrigated rice, reported that season-long CH 4 emissions from the fertilized, with-plants treatment were 4.1 times greater than from the fertilized, bare-soil treatment. In addition, Karki, et al. [26] reported season-long CH 4 emissions of approximately 1.7 kg ha -1 season -1 , which was approximately eight times lower than reported for the current study, likely due to major differences in soil texture. Karki, et al. [26] was conducted on a silty-clay soil, whereas the current study was conducted on a silt-loam soil, and soil surface texture has been shown to have a substantial effect on GHG fluxes and emissions, where clayey soils consistently have lower GHG fluxes and season-long emissions than more loamy soils [18].
Similar to CO 2 fluxes, season-long CO 2 differences were likely due to differences in root respiration between treatments. Xu, et al. [27] reported that season-long CO 2 emissions between two cultivar treatments in flood- and wet-intermittent irrigation ranged from 12,137 to 15,467 kg ha -1 season -1 , which was similar to the season-long CO 2 emissions reported from the with-plants treatment in the current study (Table 2). Furthermore, similar to the results of the current study, Della Lunga, et al. [7] reported season-long CO 2 emissions in the up-slope position during the 2018 growing season as ~15,000 kg ha -1 season -1 . Although the CO 2 emissions in the current study do not represent net ecosystem exchange (NEE) [28], the magnitude of the CO 2 efflux suggests that soil respiration could represent a greater loss of C in rice fields than previously considered [29,30]. The vented, non-flow-through, closed, dark-chamber approach is considered a reliable method to measure CO 2 emissions, although a method bias needs to be considered [30]. Considering that grain is harvested and removed from rice fields and that crop residues are often burned before the beginning of the next growing season, soil respiration obtained with the closed, static-chamber method during the growing season should represent a process that is included in the C budget, independent from photosynthetic CO 2 uptake.
In contrast to N 2 O fluxes, season-long N 2 O emissions did not differ between treatments, which could be explained by soil redox potential behavior and that rice plants do not primarily facilitate N 2 O release from the soil to the atmosphere. Della Lunga, et al. [9] evaluated soil redox potential, soil water content, soil temperature, and other properties throughout the 2018 and 2019 growing seasons on the same field as the current study and reported that, during the 2019 growing season in the up-slope-NT combination, soil redox potential at the 7.5-cm soil depth from 21 to 97 DAP ranged from 105 to -19 mV and, at 102 DAP, anaerobic conditions were present and were maintained until 122 DAP. Thus, soil redox potential was low enough that CH 4 and N 2 O could be produced at times, but, because rice plants do not facilitate a large proportion of N 2 O release from the soil, it is reasonable that season-long N 2 O emissions were unaffected by the presence or absence of plants, while season-long CH 4 emissions were greatly affected by the presence or absence of plants. Furthermore, Slayden, et al. [19] evaluated site position and tillage treatment effects on season-long N 2 O emissions and fluxes on the same field as the current study during the 2018 and 2019 growing seasons and reported season-long N 2 O emissions, averaged across site position, during the 2018 growing season were 15.9 kg ha -1 season -1 with plants present, which was nearly two times greater than the season-long N 2 O emissions reported in the current study. This result may have been related to lower rainfall during the 2018 growing season, which may have created more optimal conditions for incomplete denitrification and N 2 O production. In addition, Karki, et al. [26] reported season-long N 2 O emissions of 11.6 kg ha -1 season -1 with plants present, which were similar to season-long N 2 O emissions reported from the both the with-plants and bare-soil treatment in the current study. The magnitude of N 2 O emissions across multiple years of furrow-irrigated rice production suggests that the amount of substrate alone available for nitrification-denitrification does not constitute a reliable indication of potential gaseous-N emissions unless certain environmental properties, such as soil moisture, create favorable conditions for denitrification to even occur [7,9,19].
Global Warming Potential
Global warming potential combines the effects of all GHGs considered into a single metric. In this study, GWP was estimated with two (CH 4 and N 2 O) and with all three gases (CH 4 , N 2 O, and CO 2 ) using conversion factors from both the 5 th [1] and 6 th [24] IPCC GHG emissions assessments.
In this study, GWP estimates for just CH 4 and N 2 O from both the IPCC’s 5 th and 6 th assessments were unaffected ( P > 0.05) by treatment, while GWP estimates for CH 4 , N 2 O, and CO 2 combined from both the IPCC’s 5 th and 6 th assessments differed ( P < 0.05) between treatments (Table 2). Averaged across treatments, the GWP for CH 4 and N 2 O combined was 2,810 and 2,479 kg CO 2 eq. ha -1 season -1 from the IPCC’s 5 th and 6 th assessments, respectively (Table 2). However, accounting for CH 4 , N 2 O, and CO 2 , the GWP estimate based on the 5 th assessment was 2.8 times greater from the with-plants than from the bare-soil treatment and was three times greater from the with-plants than from the bare-soil treatment based on the 6 th assessment (Table 2). These results demonstrate the substantial impact of the season-long CO 2 emissions difference between bare soil and when plants are present to contribute to soil respiration (Table 2).
The lack of a treatment difference for estimated GWP when CO 2 is not accounted for (i.e., CH 4 and N 2 O only) may have been a result of a combination of factors. The bare-soil treatment produced numerically, though not significantly, greater N 2 O emissions than the with-plants treatment (Table 2), which may have been related to microbes utilizing a portion of the fertilizer-applied N for partial denitrification. In addition, rice plants in the with-plants treatment likely assimilated some, if not all, of the fertilizer-N additions, to reduce the amount of N substrate available for nitrification-denitrification processes, as evidenced by the numerically, though not significantly, lower N 2 O emissions from the with-plants than the bare-soil treatment (Table 2). Furthermore, the with-plants treatment had greater CH 4 emissions than the bare-soil treatment (Table 2). The combined result of these factors left both two-gas GWP estimates unaffected by treatment, while both three-gas GWP estimates differed between treatments due to root plus microbe respiration in the with-plants treatment, where the bare-soil treatment had CO 2 emissions only from microbial respiration.
Similar to the current study, Della Lunga, et al. [7] reported three-gas (i.e., CH 4 , N 2 O, and CO 2 ) GWP estimates at the up-slope position of ~20,000 kg CO 2 equivalents (eq.) ha -1 season -1 during the 2018 growing season. Furthermore, similar to the two-gas GWP estimate average between treatments in the current study, Karki, et al. [26] reported a two-gas (i.e., CH 4 and N 2 O) GWP estimate of 3,122 kg CO 2 eq. ha -1 season -1 from the up-slope position of a furrow-irrigated rice field on a silt-clay soil in northeast Arkansas. In addition, in a study that evaluated effects of water management practice (i.e., intermittent-flood and traditional flooding) and cultivar on N 2 O emissions and GWP from a DeWitt silt-loam soil at the RREC near Stuttgart, AR, Rector, et al. reported a CH 4 plus N 2 O GWP estimate of 2,046 kg CO 2 eq. ha -1 season -1 and 4,836 kg CO 2 eq. ha -1 season -1 for a hybrid and pure-line cultivar, respectively, from an intermittent-flood treatment. Global warming potential results of Rector, et al. [31] were within to above the range of the two-gas GWP estimates reported in this study and highlighted the importance of rice cultivar on GWP via cultivar effects on CH 4 emissions [32].
Implications
Due to the complexities in GHG fluxes, season-long emissions, and GWP estimates, mechanisms of GHG emissions in furrow-irrigated rice fields appear to be driven by multiple different pathways (i.e., transport through plant tissue for CH 4 , diffusion from incomplete bacteria-mediated denitrification for N 2 O, and diffusion from root respiration for CO 2 ). However, the lack of difference in two-gas GWP estimates (i.e., CH 4 + N 2 O) between the bare-soil and with-plants treatment indicates that CH 4 and N 2 O measurements from the tops of beds are representative of the entire field area, not just the partial field area occupied by the tops of raised beds. Consequently, results of this field study suggest that it is not necessary to report differential CH 4 and N 2 O fluxes, season-long emissions, and/or GWP estimates for furrows compared to atop beds in a furrow-irrigated rice production system where rice planting is concentrated on top of raised beds, at least in the up-slope position. Furthermore, studies that evaluate GHG emissions in furrow-irrigated rice systems may be able to reasonably assume that CH 4 and N 2 O measurements from the tops of beds apply to the entire up-slope field area. However, a major difference with three-gas GWP estimates (i.e., CH 4 + N 2 O + CO 2 ) still exists between bare-soil and with-plants areas due to large differences in CO 2 emissions from root respiration. Notably, as this study evaluated a bare-soil treatment from the top of raised beds, further research should evaluate GHG emissions from the tops of beds and specifically the within-furrow area of not only furrow-irrigated rice systems, but also other upland cropping systems that use raised beds with furrow-irrigation, as soil moisture contents, redox potentials, and soil temperatures within the furrows may differ from atop raised beds, which may affect GHG emissions differently than demonstrated in the current study.
Results of this study also support that the use of the dark, closed-chamber method, with plants present inside the collars, represents a valid approach to obtain a more detailed and complete C budget. Closed-chamber methods, where the chamber remains dark with minimal temperature variations throughout the typical 1-hr measurement period, minimizes potential photosynthetic CO 2 uptake and minimizes disruptions to other plant and soil biotic and abiotic processes that respond to increasing temperatures. In contrast, closed-chamber methods that are clear allow for light penetration, continued photosynthetic CO 2 uptake, and increased temperature that can alter metabolic processes rates during the measurement period. Consequently, studies like the current can supplement datasets that can be used to obtain reliable estimates of gaseous-C losses from the soil to the atmosphere.
Furthermore, results of this study suggest that the use of off-season vegetation, such as cover crops as an erosion-control, climate-smart agricultural conservation practice, between growing seasons in furrow-irrigated production systems may need careful management attention and further research. It is possible that increased GWPs may occur due to the extended presence of growing cover-crop plants. However, leaving a field fallow, without establishing a cover crop, may not reduce potential soil erosion compared to the presence of a cover crop.
Conclusions
This study quantified CO 2 , CH 4 , and N 2 O fluxes, season-long emissions, and GWP estimates between a with-plants and bare-soil treatment at an up-slope position under NT in a furrow-irrigated rice field on a silt-loam soil in eastern Arkansas. Similar to that hypothesized, the with-plants treatment frequently had greater CO 2 and CH 4 fluxes over time, greater season-long emissions, and greater three-gas (i.e., CH 4 + N 2 O + CO 2 ) GWP estimates than the bare-soil treatment. However, in contrast to that hypothesized, N 2 O fluxes were not greater from the bare-soil treatment and season-long N 2 O emissions were unaffected by treatment. In addition, two-gas GWP estimates (i.e., CH 4 + N 2 O) did not differ between the bare-soil and with-plants treatments. Thus, results of this study indicate that, at least in the up-slope position, CH 4 and N 2 O emissions measured in the with-plant area atop beds are reasonably representative of both the with-plant, top-of-bed area and the furrow area of a furrow-irrigated rice field with few to no plants present.
References
- Intergovernmental Panel on Climate Change (2014) Climate Change 2014. Working Group III Contribution to the Fifth Assessment Report of the Intergovernmental Panel on Climate Change.
- Norman RJ, Slaton NA, Roberts T, et al. (2013) Chapter 9: Soil Fertility, In: Hardke, JT (Ed.) Rice Production Handbook. University of Arkansas, Division of Agriculture, Cooperative Extension Service, Misc. Pub. 192, Fayetteville, Arkansas, 69-101.
- Hardke JT (2020) Arkansas Furrow-Irrigated Rice Production Handbook. University of Arkansas, Division of Agriculture, Cooperative Extension Service, Little Rock, AR.
- Hardke JT, Mazzanti R (2023) 2023 Arkansas rice quick facts. The University of Arkansas Division of Agriculture, Cooperative Extension Service, Little Rock, AR.
- Reba ML, Massey JH (2020) Surface irrigation in the Lower Mississippi River Basin: Trends and innovations. American Society of Agricultural and Biological Engineers Journal 63: 1305-1314.
- Della Lunga D, Brye KR, Slayden JM, et al. (2021) Relationships among soil factors and greenhouse gas emissions from furrow-irrigated rice in the mid-southern, USA. Geoderma Regional 24: e00365.
- Della Lunga D, Brye KR, Slayden JM, et al. (2023) Evaluation of site position and tillage effects on global warming potential from furrow-irrigated rice in the mid-southern USA. Geoderma Regional 32: e00625.
- Peyron M, Bertora C, Pelissetti S, et al. (2016) Greenhouse gas emissions as affected by different water management practices in temperate rice paddies. Agriculture, Ecosystems & Environment 232: 17-28.
- Della Lunga D, Brye KR, Slayden JM, et al. (2020) Soil, moisture, temperature, and oxidation-reduction potential fluctuations across a furrow-irrigated rice field on a silt-loam soil. Journal of Rice Research and Developments 3: 103-113.
- Environmental Protection Agency (EPA) (2023) Understanding global warming potentials.
- Linn DM, Doran JW (1984) Influence of oxygen on production and consumption of nitric oxide in soil. Biology and Fertility of Soils 11: 38-42.
- Bateman EJ, Baggs EM (2005) Contributions of nitrification and denitrification to N 2 O emissions from soils at different water-filled pore space. Biology and Fertility of Soils 41: 379-388.
- Bollmann A, Conrad R (2004) Influence of O 2 availability on NO and N 2 O release by nitrification and denitrification in soils. Global Change Biology 4: 387-396.
- Lelieveld J, Crutzen PJ, Bruhl C (1993) Climate effects of atmospheric methane. Chemosphere 26: 739-768.
- Levy PE, Burden A, Cooper MDA, et al. (2013) Methane emissions from soils: synthesis and analysis of a large UK data set. Global Change Biology 18: 1657-1669.
- Neue H (1993) Methane emissions from rice fields: Wetland rice fields may make a major contribution to global warming. Bioscience 43: 466-474.
- Rogers CW, Brye KR, Norman RJ, et al. (2013) Methane emissions from drill-seeded, delayed-flood rice production on a silt-loam soil in Arkansas. Journal of Environmental Quality 42: 1059-1069.
- Brye KR, Rogers CW, Smartt AD, et al. (2013) Soil texture effects on methane emissions from direct-seeded, delayed-flood rice production in Arkansas. Soil Science 178: 519-529.
- Slayden JM, Brye KR, Della Lunga D, et al. (2022) Site position and tillage treatment effects on nitrous oxide emissions from furrow-irrigated rice on a silt-loam alfisol in the mid-south, USA. Geoderma Regional 28: e00491.
- United States Department of Agriculture (USDA), Natural Resources Conservation Service (NRCS) (2019) Web Soil Survey.
- National Oceanic and Atmospheric Administration (NOAA), National Centers for Environmental Information (NCEI) (2020) U.S. climate normals quick access.
- Southern Region Climate Center (SRCC) (2023) Climate normals.
- Kandpal V (2018) Evaluation of a solar powered flow tail water recovery system for furrow irrigation. MS thesis. University of Arkansas, Fayetteville, AR.
- Intergovernmental Panel on Climate Change (2021) Climate Change 2021 The Physical Science Basis. Contribution of Working Group I to the Sixth Assessment Report of the Intergovernmental Panel on Climate Change.
- Hang X, Danso F, Luo J, et al. (2022) Effects of water-saving irrigation on direct-seeding rice yield and greenhouse gas emissions in north China. Agriculture 12: 937.
- Karki S, Adviento-Borbe MAA, Massey JH, et al. (2021) Assessing seasonal methane and nitrous oxide emissions from furrow-irrigated rice with cover crops. Agriculture 11: 261.
- Xu Y, Ge J, Tian S, et al. (2015) Effects of water-saving irrigation practices and drought resistant rice variety on greenhouse gas emissions from a no-till paddy in the central lowlands of China. Science of the Total Environment 505: 1043-1052.
- Qi YC, Guo SF, Dong YS, et al. (2014) Advances in research on the effects of irrigation on the greenhouse gases emission and soil carbon sequestration in agro-ecosystem. Scientia Agricultura Sinica 47: 1764-1773.
- Rajasekar P, Selvi JAV (2022) Sensing and Analysis of greenhouse gas emissions from rice field to the near field atmosphere. Sensors 22: article number 4141.
- Hall MKD, Winters AJ, Rogers GS (2014) Variations in the diurnal flux of greenhouse gases from soil and optimizing the sampling protocol for closed static chamber. Communications in Soil Science and Plant Analysis 45: 2970-2978.
- Rector C, Brye KR, Humphres J, et al. (2018) N 2 O emissions and global warming potential as affected by water management and rice cultivar on an Alfisol in Arkansas, USA. Geoderma Regional 14: e00170.
- Smartt AD, Brye KR, Rogers CW, et al. (2016) Previous crop and cultivar effects on methane emissions from drill-seeded, delayed-flood rice grown on a clay soil. Applied and Environmental Soil Science 2016: 1-13.
Corresponding Author
Diego Della Lunga, Research Assistant, Department of Crop, Soil, and Environmental Sciences, University of Arkansas, 115 Plant Sciences Building, Fayetteville, AR 72701, USA.
Copyright
© 2023 Brye JB, et al. This is an open-access article distributed under the terms of the Creative Commons Attribution License, which permits unrestricted use, distribution, and reproduction in any medium, provided the original author and source are credited.