Effects of Biochar Concentrations and Fertilizer Types on Drip-Irrigated Upland Rice Performance
Abstract
The study investigated performance effects of biochar concentrations and fertilizer types on drip irrigated upland rice for two seasons. A Randomized Complete Block Design (RCBD) comprising of four levels of biochar application (0 t/ha, 5 t/ha, 10 t/ha and 15 t/ha) and four fertilizer types (Liquid Organic Fertilizer, NPK 15:15:15, poultry manure, and control) with drip irrigation system and thrice replicated was conducted. Agronomic parameters such as plant height, stem girth width, leaf area, number of leaves, yield and others were measured. Treatments NPKB15, PMB15 and LOFB15, in that order, performed better than F0B15 and F0B0 in all the agronomic parameters in the two seasons. These parameters also performed well according to the biochar concentrations - B15, B10, B5 and B0 in that order. Highest average yield of paddy and processed rice of 6.31 t/ha and 6.20 t/ha in season 1 and 6.36 t/ha and 6.21 t/ha in season 2 respectively were recorded in NPKB15 while liquid organic fertilizer recorded highest average rice yield of 3.51 t/ha and 2.54 t/ha in season 1 and 4.55 t/ha and 4.08 t/ha in season 2 respectively in LOFB15. Lowest values were recorded in Zero Fertilizer (control) in all parameters. There was at least 50% increase in paddy and processed rice yields in all the treatments when compared to the control F0B0. NPK fertilizer at biochar concentration of 15 t/ha, which gave the best result. in rice agronomic and yield responses is recommended as the best treatment for rice production.
Keywords
Desirability, Soil Improvement, Field capacity, Rice yield, Food security
Introduction
Rice (Oryza sativa L.) constitutes one of the most important staple foods of over half of the world's population and globally, it ranks third after wheat and maize in terms of production but first in terms of global consumption [1]. It is a globally important cereal crop and the primary source of food for more than 3 billion people living mostly in Asia and Africa. It is grown under wide range of latitudes and altitudes and can anchor the food security of the world [2]. Asia is the world's biggest rice producer accounting for 90% production and consumption. Different yields have been achieved in different ecological zones especially in Africa and West Africa sub region with an all-time highest yield of 9.1 t/ha achieved in Egypt in 2001 chiefly due to profitable management of soil and water resources [3]. Rice production in Africa increased from 8.6 million tonnes of paddy in 1980 to 18.6 million tonnes in 2005. Despite such dramatic growth, demand continues to exceed supply and most countries in the region relies on imported rice. While per capita rice consumption in some Asian nations is declining, it is growing rapidly in most countries in Sub-Saharan Africa [4].
Declining soil quality and nutrient losses have been the foremost bane to increased rice production and food security in Sub-Saharan Africa (SSA) [5]. These problems were further compounded by pressure on farmers to increase rice yield due to geometric population growth, climate change and the need to practice climate smart agriculture that provides beneficial ecosystem services in addition to food security [6]. Ray, et al. [7]; identified water scarcity and poor soil fertility as two critical factors affecting crop production. Here in Nigeria, sustainable productivity of rice is limited by environmental and socio-economic constraints such as soil acidity, low soil fertility, and limited access to fertilization. Therefore, there is increasing demand for researchers to evolve strategies that will improve the physical and chemical properties of the soil in areas of low soil fertility, improve water retention in the soil as well as improve water use efficiency by the plants to increase yield [7]. One widely agreed management option with this three-pronged issue, is the amendment of the soil with biochar [8-10]. Sohi, et al. [11] stated that biochar is pyrolysed biomass, produced for the purpose of amending agricultural soils. With the introduction of new technology which combined fertilizer application with irrigation (fertigation), the process of growth and development of crops have been simplified as ambiguities associated with poor irrigation and fertilizer application have been eliminated [12].
Biochar is a carbon rich charcoal that is formed by the pyrolysis (thermal decomposition) of organic biomass or agricultural residues which is used as soil amendment [13]. It is composed of Carbon (C), Hydrogen (H), Oxygen (O), Nitrogen (N), Sulphur (S) and ash in different proportions. It is mainly used to improve soil nutrient content and to sequester carbon from the environment [14]. Biochar contains stable carbon, large specific surface area, and negative surface charge [15], which bestows on it, its beneficial soil amendment role in improving soil properties [13], improving soil water and nutrient retention, carbon sequestration, greenhouse gas emission reduction and enhancing crop yield [16]. Studies conducted by Gaskin, et al. [17] found that two years of biochar application increased soil organic carbon (SOC) and total nitrogen content (TN) without affecting soil available phosphorus (P). Major, et al. [18], reported that the amendment of a soil low in fertility with wood biochar at 20 t/ha increased the concentration of nitrate (NO3-N) in the soil solution. Liao, et al. [19], also reported that a one-time application of 4.5 t/ha biochar significantly increased cotton yields by 24-37%, in a one-year field study. Zhang, et al. [20] observed that biochar application enhanced rice yields by 10% in the first crop cycle and by 10 - 29% in the second crop cycle. Most of these studies were conducted with the application of biochar singly without complementary organic or inorganic fertilization.
Progressively, studies have observed significant improvement in soil properties and crop yield when biochar and inorganic or organic fertilizer were co-applied. Gathorne-Hardy, et al. [21] observed a significant interaction effect on barley yield when biochar was co-applied with nitrogen fertilizer. Lusiba, et al. [22], reported a significant interaction between eucalyptus biochar and phosphorus fertilizer on select soil physical and chemical properties and chickpea yield. Liu, et al. [23] also reported a positive interactive effect of combined application of compost and biochar on Dystric Cambisol Soil Organic Carbon (SOC) content, nutrient content and physical properties under field conditions. Other studies also suggest that the combined application of biochar with organic fertilizer could lead to enhanced soil fertility, improved plant growth and carbon storage potential [24,25]. However, biochar amendment effects on soil properties could be dependent on soil texture and mineralogy [16] due to soil heterogeneity.
In Nigeria, a large proportion of upland soils are highly weathered, characterized by low activity clays with unevenly charged surface i.e., kaolinite and oxides and hydroxides of Fe and Al [26] and belonging to the order Ultisols, Oxisols and Alfisols. Studies conducted by Hossain, et al., [27]; Major, et al. [28] and Chan, et al. [29] have shown that when these types of soils are amended with biochar, there is a significant improvement in soil chemical properties, reduction in aluminum (Al3+) toxicity and soil acidity. Furthermore, Yeboah, et al. [30] reported that application of wood biochar increased total N and P uptake in corn plants grown in a sandy loam soil, while uptake was decreased in a silt loam soil in the savanna region of Northern Ghana. Butnan, et al. [16] stated that biochar can help retain water and nutrients in the soil for the plants to take up as they grow. Butnan, et al. [16] further stated that biochar is hygroscopic, thus it is a desirable soil material in many locations due to its ability to attract and retain water.
In terms of water management and irrigation specifically, drip irrigation with its ability of small and frequent water applications has created interest in view of decreased water requirements and potential increased crop productivity. Edoga and Edoga [31] reported that with drip irrigation, the soil is maintained continuously in a condition which is highly favourable to the crop growth. As the applications are located close to the plant root zone, the losses caused by drainage or by wetting inter-rows and ridges are minimized.
The possibility of combining these strategies namely biochar treatment, fertilizer application and irrigation motivate this study. The objective is to by experimental set-up, investigate the performance and impact of combined biochar, fertilizer and drip irrigation treatments on upland rice productivity and yield. The study attempts to fill a gap by exploring the potential for improving rice crop agronomic properties while efficiently optimizing biochar concentration, fertilizer use and irrigation technique. The results provide scalable solutions for small-scale or large-scale and subsistent or commercial rice farming capable of significantly boosting rice production and increasing supply.
Materials and Methods
Field preparation and cultivation
The study was conducted at the teaching and research farm of the department of Agricultural and Environmental Engineering, Federal University of Technology, Akure, Nigeria. Akure is located on latitudes 7° 14'N and 7° 17'N and within longitude 5° 08'E and 5° 13'E. The soil of the study area is sandy clay loam according to the USDA soil textural classification [32], moisture holding capacity has been described as moderately good [32] and the area is about 651 m above sea level [32]. The fieldwork was conducted for about 25 weeks each between October 2018 - April 2019 and October 2019 - April 2020 designated as Season 1 and Season 2 respectively.
For Season 1, the field was manually slashed on Day 1 and ploughed on Day 9 using a tractor driven mounted disc plough. This was followed by extensive harrowing procedures on Day 16 to improve desired soil configuration for rice planting. The actual laying of the drip irrigation system (reservoirs, mains, laterals, and drip lines) was carried out between Day 22 and Day 27. Soil initial moisture content was raised to field capacity using the installed drip system prior to actual planting and was also used for establishing irrigation scheduling. Season 2 followed a similar procedure, with the exception of tractor-driven farm operations due to the wire mesh perimeter fencing and the overhead bird-protection netting installed during Season 1. It should also be noted that biochar was not re-applied in Season 2.
Experimental design and treatments description
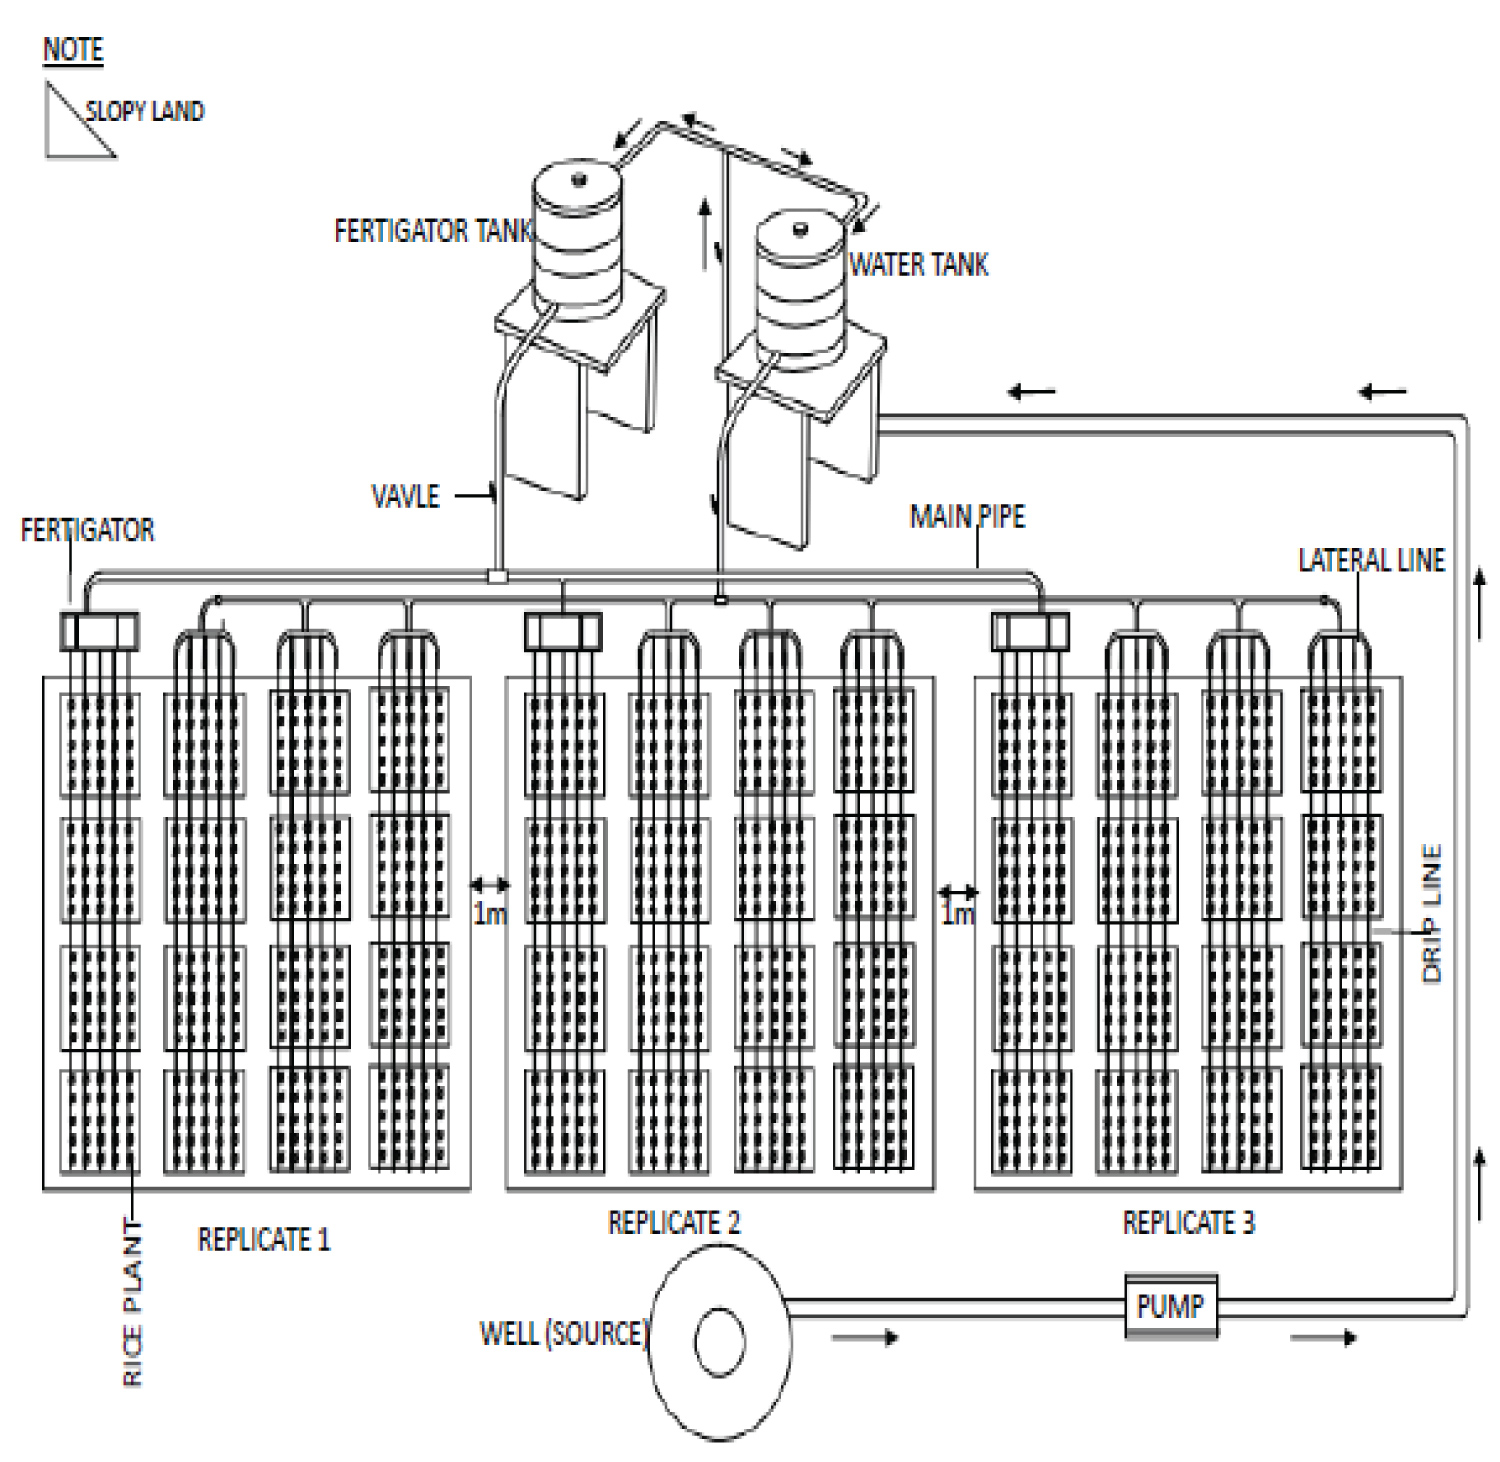
The design was laid out in a Randomized Complete Block Design (RCBD) of four fertilizer types with four levels of biochar application in three replicates (4 × 4 × 3) resulting in a total of 48 experimental plots as illustrated in Figure 1. Each plot measured 1 m2 summing to 48 m2 with 1 m alleyways in-between the plots and between the plots and fence over a total field dimension of 225 m2. Each plot contained 25 stands of upland rice New Rice for Africa (NERICA 2) variety per m2 at 20 cm × 20 cm spacing.
The fertilizer application for the four treatments used in the study and are described as follows: Plot A: Soluble Fertilizer- Applied through a fertigator (HI 5000 Mini-fertigator Hanna Instrument). The fertilizer is mixed with irrigation water and applied at a rate of 2500 ml per hectare before been delivered through the drip irrigation system. The fertigator model used in the study also has the advantage of been able to measure the electrical conductivity of the resulting mixture.
Plot B: Solid Fertilizer - The common NPK fertilizer was used, specifically the 15:15:15 mix which was applied via ring method around the root zone of the rice stand at a rate of 60 kg per hectare.
Plot C: Poultry Manure - Poultry manure initially cured for 7 days was applied uniformly around the root zone via broadcasting method at the rate of 5 tonnes per hectare.
Plot D: Control Treatment - This plot was managed without any fertilizer application.
The solid fertilizer and manure were applied twice, before planting and at rice tillering/booting stage (approximately 9 Weeks after Planting - WAP). The soluble fertilizer was applied at 3WAP.
The biochar was derived from rice straw pyrolysed at 400 °C with heating rate of 2.08 °C/min using a pyrolyser (oven) for a residence time of 55 minutes using a fixed bed batch type pyrolysis system. This is comparable with the procedure adopted by Yakout [33]; Jiang, et al. [34]; Kamara, et al. [35] and Weixiang, et al. [36] for biochar production with rice straw biomass. For repeatability, some physico-chemical properties of the biochar were determined in the laboratory following standard protocol. The physical properties determined were bulk and particle densities. The biochar bulk density was determined using the standard described by ASTM E873-82 [37]. The chemical properties analyzed included Nitrogen (N), Phosphorus (P), Potassium (K), Sodium (Na) contents; Organic Carbon; Cation Exchange Capacity (CEC); and pH. They were determined following standard laboratory protocol as described in Yakout [33]; Jiang, et al. [34]; Kamara, et al. [35] and Weixiang, et al. [36] while the pH was measured as described by Naeem, et al. [38]. The four concentrations of biochar applied were: 0, 5, 10, and 15 tonnes per hectare. The application rates were comparable with that of Ndor, et al. [39] and Major, et al. [28] who reported that the rates are appropriate and effective for increased cereals production.
Some of the design considerations for the drip irrigation system are stated for clarity. The slope of the field was about 2% as estimated by Akinbile, et al. [1]. The soil type was also verified as sandy clay loam through standard laboratory tests. The root depth of the upland rice planted (NERICA 2) was taken as 10 cm, and plant spacing of 20 cm by 20 cm [40]. Each stand had one rice plant each, and irrigation was performed between 4:30 pm & 6:00 pm on every irrigation day. Ceramic tip tensiometers were installed at depths of 10 cm and 20 cm in the control treatment (Plot D) for scheduling irrigation. Irrigation is performed whenever soil moisture content has reached approximately 50% Maximum Allowable Deficiency (MAD) in the control plot. The reading of the tensiometer at about 50% MAD was determined from the gravimetric moisture content of soil samples during the field trial test. The moisture content at 50% MAD was estimated based on Eqn (1) below where FC is Field Capacity and WP is Wilting Point.
The field capacity at soil tension of 10 kPa and tensiometer reading limit at 80 kPa were determined following the method of Marcos, et al. [41], while the wilting point was fixed based on previous work at the experimental site [42].
A summary of the 16 treatments, and their designations are shown in Table 1 below. See Supplementary Figure S1 for additional details.
Field operations and performance measurement
After all the land preparation activities and treatment specifications were conducted, seedbeds 1.0 m long by 1.0 m wide were formed. The biochar was incorporated and mixed evenly into the topsoil (about top 15 cm) at the specified rates manually before planting in each of the seasons. Actual upland rice (New Rice for Africa - NERICA 2 variety) was manually planted 2 seeds per hole on 5/3/19 and thinned to one plant per stand by 3 WAP. The final plant population (after thinning) was modelled following the recommendations of IITA [40] study of 250,000 rice stands per hectare obtainable via a plant spacing of 20 cm by 20 cm. the referenced study reported more effective and significantly higher grain yield at this plant spacing compared to that of 15 cm × 15 cm and 10 cm × 10 cm. A perimeter fencing on the field provided protection against rodent attack while nets above the field protected the rice plants against weaver birds' invasion during milking stage.
Agronomic data was collected directly on the field using randomly selected rice stands as observation plants. One rice stand per treatment was used, hence 16 stands in three replicates totaling some of the existing equipment and the mode of collection was manual. Specific rice stands were selected for the observations. That is, one rice stand per treatment was selected, making a total of 16 rice stands for the 16 treatments in 3 replicates, which is 48 rice stands. The measurements were taken on a weekly basis. Agronomic response parameters measured were number of leaves, number of tillers, number of panicles, panicle length, plant height, stem girth and leave area. All the agronomic parameters were measured using the same rice plant, leaf, panicle or tiller, as the case may be, selected from each treatment and replicate. Agronomic measurements started at 3 WAP (Supplementary File).
At maturity, the rice plants were manually harvested and separated according to the treatments at 16 WAP for both season 1 and season 2. Thereafter, the biomass and grain yields were determined at 15% moisture content (dry basis).
Statistical and comparative analyses
Data obtained from the two seasons were analyzed using graphical and inherent analysis tools to get the effects of fertilizer types and biochar concentrations on the growth and yield parameters of Rice. Statistical Package for Social Sciences (SPSS) v16 was used to perform Duncan Multiple Regression Test (DMRT), while Tukeys Test Analysis and Analysis of variance (ANOVA) were performed using Minitab v18 to establish the significant effects treatment combinations (treatment type i.e., fertilizer type and treatment level i.e., biochar concentrations) on the responses (growth parameters and yield). Design Expert v12 was used for the optimization of the different yields of Rice (with biomass, without biomass, paddy and grain yields).
Results and Discussion
Physical and chemical properties of biochar
The biochar produced from rice straw was analysed to determine its physical and chemical properties as presented in Table 2. The biochar bulk and particle densities were 0.54 g/cm3 and 0.54 g/cm3 respectively. The chemical analysis carried out showed that the pH value of the biochar was 7.62, Nitrogen was 0.94%, phosphorus was 22.62 mg/kg and the organic carbon content was 65.22%. The potassium and calcium contents were 28.81 cmol/kg and 8.90 cmol/kg respectively, while sodium content was 3.67 cmol/kg. The yield of the biochar was 36.8% of the original mass of the rice straw used, with ash content of 35.7%. These values compare favourably with those of Yakout [33]; Jiang, et al. [34]; Kamara, et al. [35] and Weixiang, et al. [36] in related studies involving rice straw derived biochar. The result obtained showed that the biochar was alkaline in nature, rich in nitrogen, potassium and sodium, with high organic carbon content and Cation Exchange Capacity. Hence, very suitable to be applied to the soil according to the International Biochar Initiative recommendations [43]. The outcome of the analysis of the biochar agreed with scholarly findings that biochar contains stable carbon, large specific surface area, and negative surface charge [15], which bestows on it, its beneficial soil amendment role in improving soil properties [13,44,45], improving soil water and nutrient retention, carbon sequestration, greenhouse gas emission reduction and enhancing crop yield [16,24].
Agronomic responses in rice growth parameters
In the overall results of the effect of the treatments on the growth parameters of rice (Table 3, Table 4, Table 5, Table 6 and Table 7), it was observed that NPK fertilizer, Poultry manure and Liquid organic fertilizer treatments performed better than the Zero fertilizer treatment in agronomic parameters in the two seasons. This result indicated that rice agronomic parameters, such as the number of leaves, the number of tillers, the number of panicles, which are very good indicators to yield of rice improved with fertilizer and biochar combined application. Results also showed that all the agronomic parameters increased with increase in the biochar level within each fertilizer type. Further findings in the agronomic performance of rice showed that there was consistency in the number of leaves, number of tillers and number of panicles within seasons 1 and 2, an indication that biochar and the fertilizer type's effects on rice development were reliable. There was significant (p < 0.05) increase in agronomic parameters from season 1 to season 2 irrespective of the fertilizer type. This could be attributed to the biochar applied to the soil. Panicle length increased by 5.5% in season 2. Plant height increased by 2.2% in season 2. Stem girth increased by 5% in season 2, while leaf area increased by 2.4% in season 2. There were no panicles that developed until week 10, that is, between 1 and 9 WAP. In the overall agronomic performance, treatments with NPK fertilizer recorded the highest performance, followed by poultry manure, liquid organic fertilizer and zero fertilizer application, in that order. The results obtained from this study agreed with the findings by Schulz and Glaser [24] and Schulz and Glaser [25] that the combined application of fertilizers with biochar could lead to enhanced soil fertility, improved plant growth and carbon storage potential.
The mean number of leaves for all the fertilizers and biochar concentrations are different in the two seasons. The highest number of leaves was observed at 15 t/ha biochar concentration for the four fertilizer types in the two seasons (see Supplementary Figure S2, Supplementary Figure S3, Supplementary Figure S4, Supplementary Figure S5, Supplementary Figure S6, Supplementary Figure S7, Supplementary Figure S8, Supplementary Figure S9). Analysis of Variance (ANOVA) tests carried out on the effect of biochar concentrations for all the fertilizer treatments showed that NPK and PM have significant effect on the number of leaves with the same p-values of 0.000 and 0.000 (p < 0.05) in the two seasons, while LOF and F0 have no significant effect on the numbers of leaves of the rice plant with p-values of 0.843 and 0.431 in season 1 and 0.917 and 0.052 (p < 0.05) in season 2 (Supplementary Table S1). The results of the also showed that 15 t/ha biochar concentration has more effect on the numbers of leaves compared to other biochar concentrations in season 1, while 15 t/ha and 10 t/ha biochar concentrations have more effect on the number of leaves compared to others in season 2.
The results of the Duncan Multiple Range Test (DMRT) for the growth parameters examined in the study for season 1 and season 2 are presented in the subsequent sub-sections.
Number of leaves, number of tillers and number of panicles: Table 3 shows the results for number of leaves, number of tillers and number of panicles for the treatment combinations investigated.
It was observed that the treatment type and treatments levels had significant effect on the number of leaves. The NPK, PM and LOF fertilizer types resulted in increased number of leaves compared to the F0 treatment. NPKB15 treatment recorded the highest number of leaves both for treatment type and treatment level with 47.00 ± 0.55 and 47.20 ± 0.37 in season 1 and season 2 respectively. The NPK treatments had the most leaves on average irrespective of biochar levels, perhaps due to the additional Nitrogen. Nitrogen is largely responsible for leaves development and can increase photosynthetic abilities of plants [46,47]. Although higher in number (almost two times) than the zero-fertilizer treatment i.e., FO. The LOF treatment also had a similar range for number of leaves at the different biochar levels. PM treatment increased number of leaves significantly with biochar application, but no significant increase observed with increasing biochar levels.
It was observed that NPK, LOF and PM treatment types had significant effect on number of tillers, while only NPK and PM responded significantly to biochar treatment levels. NPKB10 and NPKB15 treatment combinations had more effect on numbers of tillers compared to others. LOF and F0 at all biochar levels had a similar range of numbers of tillers, while number of tillers in the PM treatment increased from around 6.40 (no biochar) to about 8.60 (with biochar at any level. This result is in agreement with the submission Kamara, et al., [35] that application of rice straw to soil showed significant (p < 0.05) difference in tiller numbers from the untreated soil. Rice biomass and paddy yield is dependent on the number of tillers thus the more the number of tillers, the more the rice yield.
Treatment type and level had significant effect on number of panicles in both season 1 and season 2. Compared to the FO treatment, number of panicles was highest in the NPK treatments followed by the LOF treatment and finally the PM treatment with average values of 13, 11 and 7 respectively. LOF was not responsive to biochar treatment levels as the range for number of panicles remained relatively unchanged for all four biochar levels. NPK treatments showed increasing number of panicles with increasing biochar application from 11.80 ± 0.85(11.60 ± 0.24) at the 0t/ha level to about 15.80 ± 0.20(15.80 ± 0.20) at the 15t/ha level for season 1(2). The increase in number of panicles for the PM treatment was responsive only to the presence of biochar, but insignificant at higher or lower application levels.
Panicle length, plant height, and stem girth: Tables 4 shows the maximum average panicle length, plant height and stem girth for all treatments considered. All treatment types showed increasing panicle length with increasing treatment levels of biochar application. Panicle length increased most significantly between 0t/ha level and 5t/ha level, with significant but lesser magnitudes of increase observed from the 5t/ha level to the 10t/ha level and finally the 15t/ha level. The maximum panicle length recorded was in the PMB15 treatment combination at 42.76 ± 0.13(43.00 ± 0.00) for season 1(2), while FOB0 had the least length at 26.18 ± 0.27(26.84 ± 0.16) for season 1(2). These results tend to suggest that biochar application favored panicle length and photosynthesis by extension, with the PM treatment amplifying that increasing panicle length effect.
Similar to the observations for panicle length, increasing levels of biochar applications resulted in taller rice plants. Between the 0t/ha level and the 5t/ha level, PM and FO treatments showed the highest magnitude of significant increase while LOF and NPK trailed. The NPK and LOF treatments jointly performed best out of all treatments and recorded the maximum plant height of about 135cm. The 15t/ha biochar treatment level resulted in the tallest rice plants irrespective of treatment type. These results agree with Kamara, et al. [35] submission that rice plants grown on soils treated with rice straw biochar were significantly (p < 0.05) taller than those grown on soils without biochar treatment. Plant height has effect on rice yield. Good plant height favours photosynthesis and weed control, while poor plant height reduces photosynthesis ability and weed control.
The control treatment (F0) had the least stem girth for all biochar levels compared to the LOF, NPK and PM treatments. All treatments showed increasing stem girths with increasing biochar levels, with the NPK treatment performing best followed by the PM and LOF treatments in that order. The differences in stem girth measurements were statistically insignificant at the 15t/ha treatment level however for all treatments. The average stem girth increased from about 2.87 to 4.42 in plants without fertilizer (F0), 3.79 to 4.83 in the liquid fertilizer treatments, 3.97 to 5.30 in the plants with poultry manure treatment, and 4.36 to 5.61 in the NPK fertilizer treatment from 0t/ha level to 15t/ha level respectively.
Leaf area: The treatment types with the largest leaf area to the least leaf area were NPK, PMB, LOF and F0B as detailed in Table 5. For the 0t/ha level, leaf area increased from about 68 in F0B to 72 in LOF, 97 in PMB and 113 in NPK. The marginal increases were least in the F0B treatment, and between 0t/ha and 5t/ha suggesting that perhaps a threshold value of 5t/ha was reached before significant amplification of the treatment levels and treatment types effect on leaf area. It is worth to note here that larger leaf area implies more sunlight absorption and by extension food production.
Yield responses in rice performance
The highest yield in season 1 was 6.31 t/ha and 6.20 t/ha recorded in NPKB15 while the least yield was 1.14 t/ha and 1.01 t/ha recorded in F0B0 for paddy and grain (processed) respectively. FOB15 yield was 2.50 t/ha and 2.03 t/ha in the same season 1 for the paddy and grain yield likewise. This represents more than two and half times to three times increase between treatments F0B15 and NPKB15 for paddy rice and grain (processed) rice yields respectively, and more than five and half times to six times increase between F0B0 and NPKB15. In season 2, the highest average yield of paddy and grain (processed) rice was 6.36 t/ha and 6.21 t/ha respectively recorded in NPKB15 as against 3.36 t/ha and 3.26 t/ha respectively recorded in F0B15, while the least yield was of 2.90 t/ha and 2.15 t/ha respectively was recorded in F0B0. This also represents more than one and half times increase each between treatments F0B15 and NPKB15 for paddy rice and grain (processed) rice yields respectively and more than two times to two and half times increase between F0B0 and NPKB15.
All three treatment types (fertilizers) did better than the control (zero fertilizer), indicating that yield increased with fertilizer applications. Also, yield increased with increase in the biochar concentrations within each fertilizer type. This agrees with Major, et al. [48] position that when several rates of biochar (concentration levels) are used, the plots with the higher biochar application rate show better results. There was consistency in the yield of rice in the two seasons, a further indication that biochar and the fertilizer type's interactive effects on rice development were positive and reliable. Paddy rice and processed rice yields increased by more than 50.0% in the two crop cycles attributed to biochar application when compared to production practices without biochar but with fertilizer application. This agrees with Zhang et al., [20] who observed that biochar application enhanced rice yields by at least 10% in the first crop cycle and by 10 - 29% in the second crop cycle.
The higher rice yields in this study especially in the NPKB10 and NPKB15, and the PMB10 and PMB15 treatment combinations of fertilizer and biochar when compared to yields of less than 1.0 t/ha (1.5 t/ha) recorded with traditional (NERICA) varieties planted without any fertilizer application [40,49] prove that fertilizer and biochar combined applications were very effective in enhancing yield as submitted by Schulz and Glaser, [24] and Zhang et al. [20]. The increase in rice yield obtained from this study also agreed with IITA [40] remarks that the potential yield of NERICA 2 is up to 4000 kg/ha (4 t/ha) and could be up to 6000 kg/ha (6 t/ha) under good soil management practices and favourable climatic conditions.
Grain yield (with biomass), paddy rice yield, biomass yield, and rice grain yield for each treatment combination: Table 6 shows the effects the various fertilizer treatment and biochar concentration levels on the four different yield parameters namely grain yield - with biomass, paddy rice yield - without the biomass, biomass yield, and rice grain yield. It was observed that the treatments had significant effect on the different yields in the two seasons. Yields generally increased as biochar concentrations increased, while yields were usually higher in season two than in season one.
For grain yield with biomass, the highest value was observed at LOFB15 in the two seasons with mean values of 4.26 t/ha and 4.66 t/ha respectively. For paddy rice yield - without the biomass, the highest value was observed at LOFB15 for both seasons with mean values of 3.51 t/ha and 4.55 t/ha respectively. For biomass yield, the highest was observed at LOFB15 for both seasons with mean values of 2.21 t/ha and 3.43 t/ha, respectively. For rice grain yield, the highest value was observed at LOFB15 for both seasons with mean values of 2.54 t/ha and 4.08 t/ha respectively.
In the NPK 15:15:15 combined with biochar treatment, treatment level had significant effect on the yields for the two seasons. For grain yield with biomass, the highest value was observed at NPKB15 in the two seasons with means of 6.74 t/ha and 6.95 t/ha respectively. For paddy rice yield - without the biomass, the highest value was observed at NPKB15 for both seasons with mean values of 6.31 t/ha and 6.36 t/ha respectively. For biomass yield, the highest was observed at NPKB15 for both seasons with mean values of 5.88 t/ha and 5.96 t/ha, respectively. For rice grain yield, the highest value was observed at NPKB15 for both seasons with mean values of 6.20 t/ha and 6.21 t/ha respectively.
There were significant effects of Poultry Manure (PM) combined with biochar treatment levels on rice yield parameters. Grain yield with biomass highest value was observed at PMB15 in the two seasons with mean values of 6.62 t/ha and 6.26 t/ha respectively. For paddy rice yield - without the biomass, the highest value was observed at PMB15 for both seasons with mean values of 5.74 t/ha and 6.00 t/ha respectively. Biomass (rice grain) yield highest value was observed at PMB15 for season 1 and season 2 with mean values of 4.18(4.69) t/ha and 4.52(5.07) t/ha respectively.
Even when no fertilizer was applied, there were significant differences in mean values of yield parameters. For grain yield - with biomass, the highest value was observed at FOB15 with mean values of 2.96 t/ha and 3.87 t/ha for seasons 1 and 2 respectively. For paddy rice yield - without the biomass, the highest value was observed at FOB15 for both seasons with mean value of 2.50 t/ha (3.36 t/ha) for season 1(2). For biomass yield, the highest was observed at FOB15 for seasons 1 and 2 with mean values of 1.55 t/ha and 2.77 t/ha respectively while rice grain yield highest value was observed at FOB15 for both seasons with mean values of 2.03 t/ha (season 1) and 3.26 t/ha (season 2).
Modelling and optimization of the yield response parameters
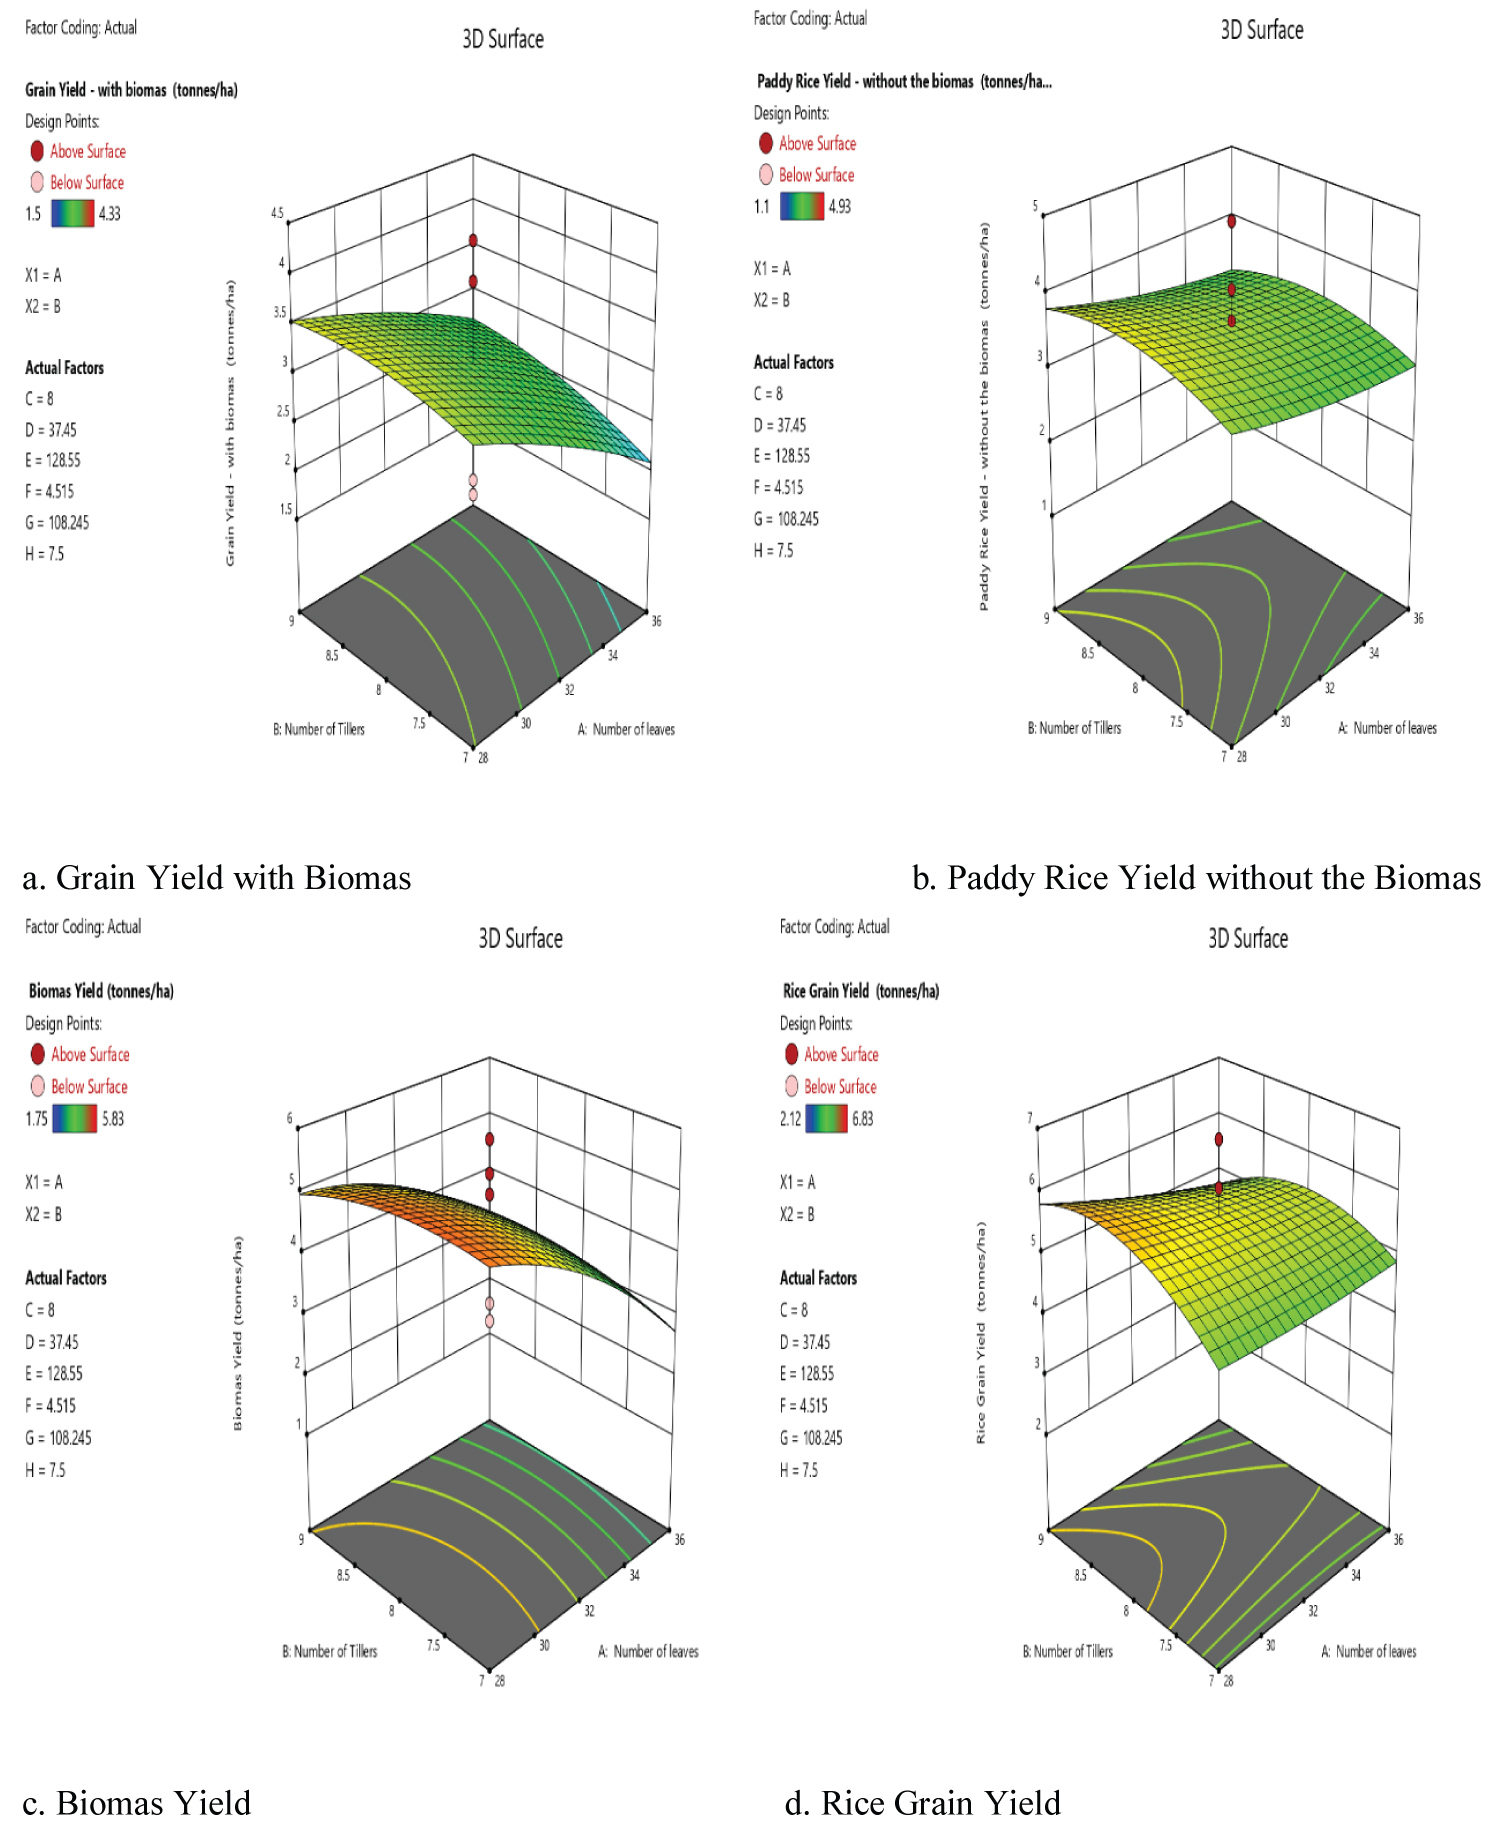
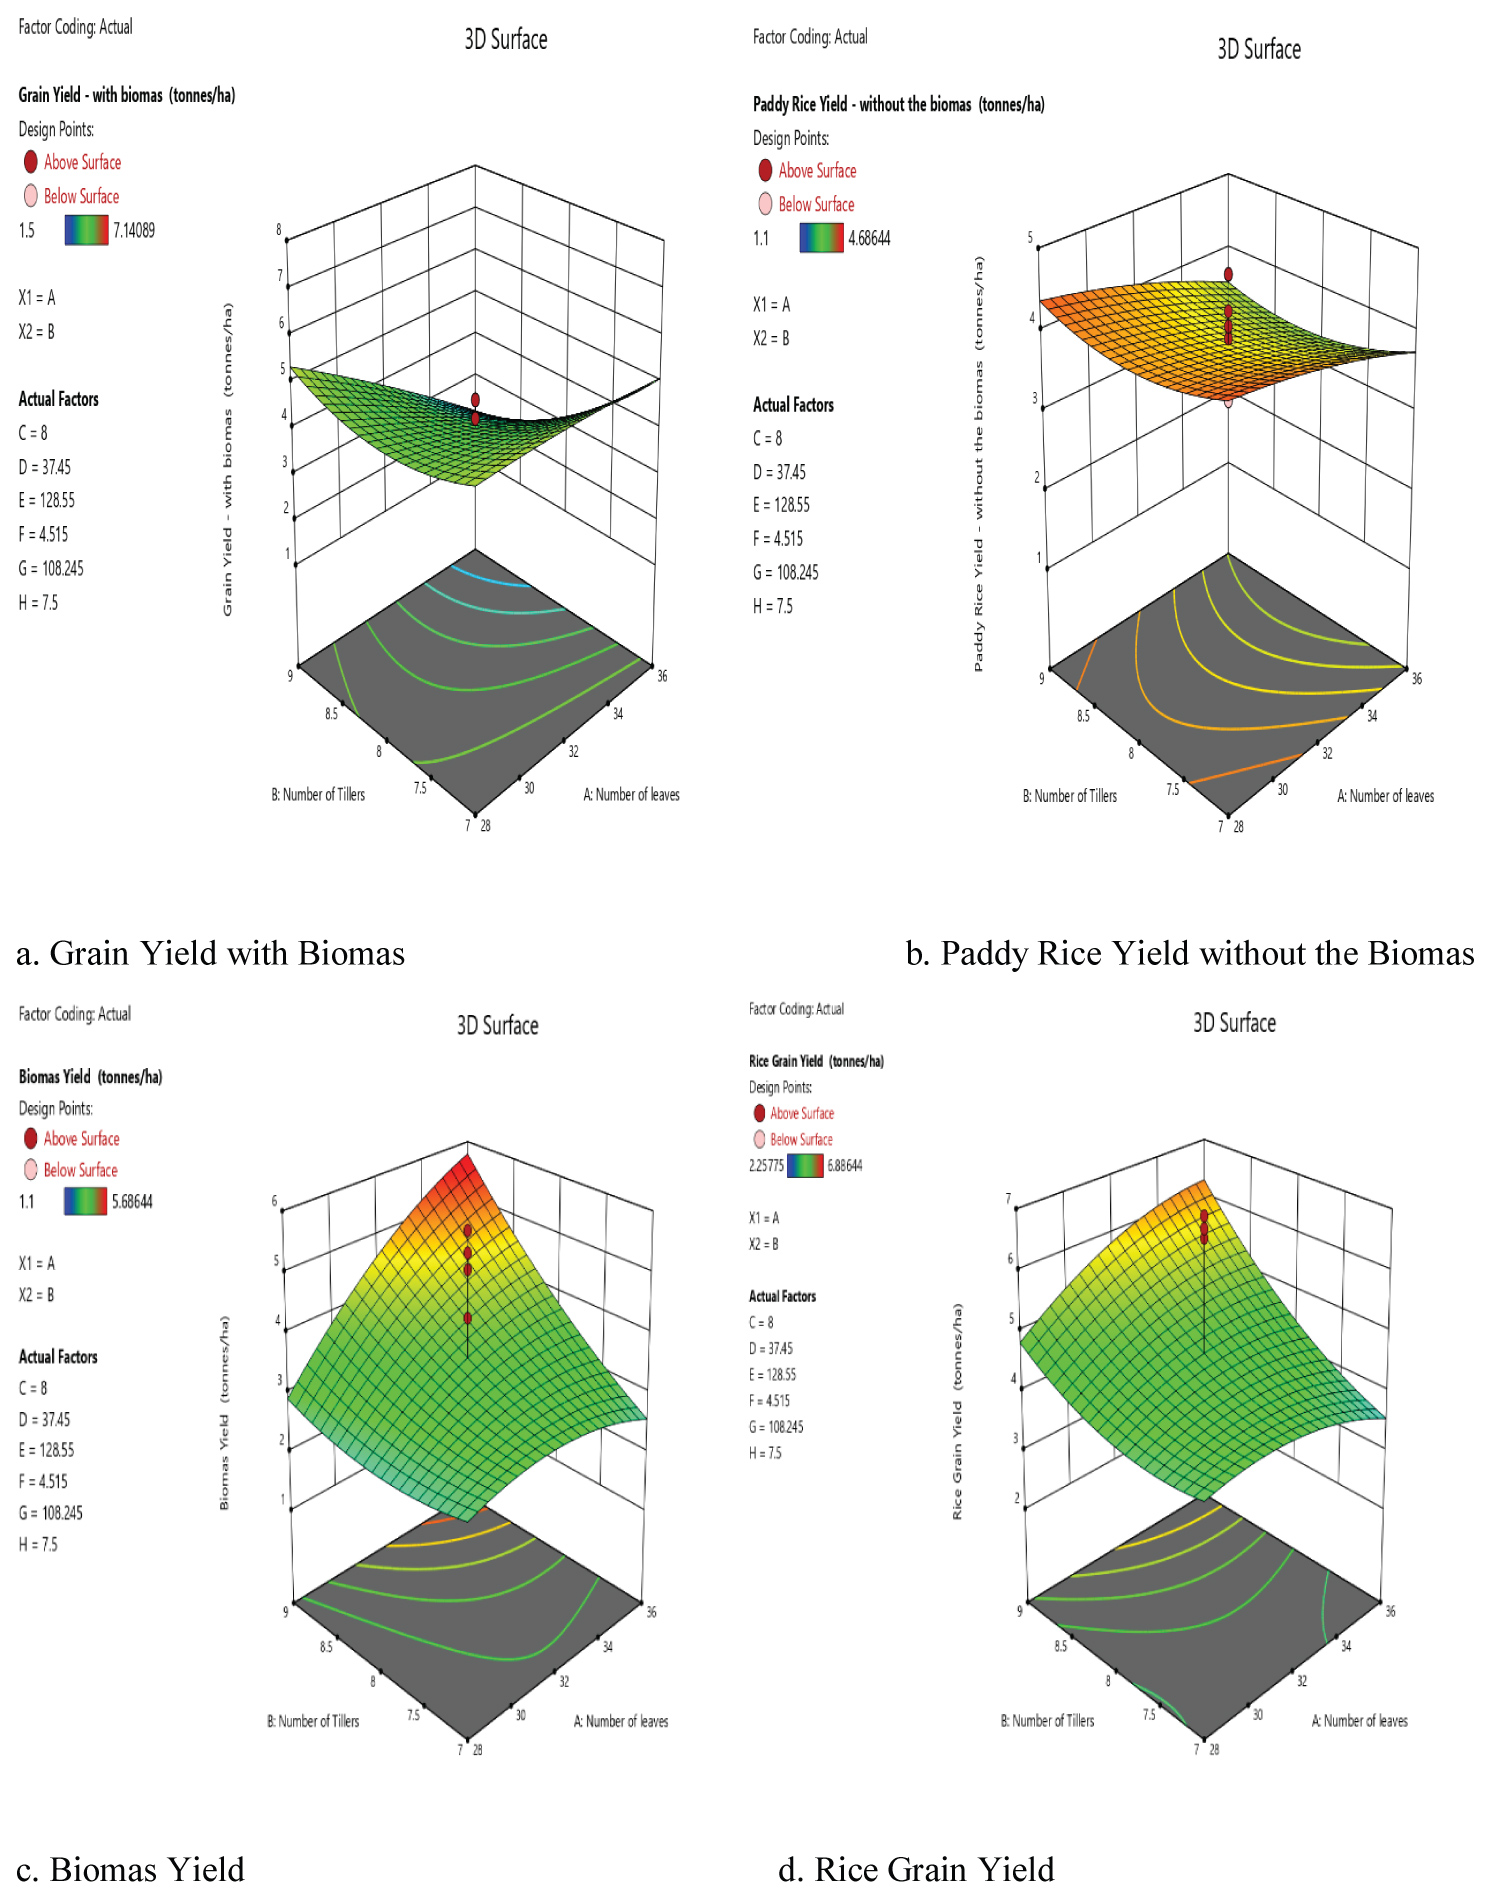
Figure 2 and Figure 3 shows the (3D) results of the modelling and optimization of the yield response parameters using the surface response methodology on Design Expert. Since the 15t/ha biochar level performed best, the modelling and optimization is majorly limited to the NPKB15 treatment combination. The dependent variables were grain yield - with biomass, paddy rice yield - without the biomass, biomass yield, and rice grain yield. The independent variables were biochar level and fertilizer types, while the process variables were number of leaves, number of tillers, number of panicles, panicle length, plant height, stem girth and leaf area. The possible interactions were number of leaves and number of tillers for the yield parameters as shown in Figure 2 and Figure 3 for season 1 and season 2 respectively. The figures show that the slope for number of leaves was greater than that of the other process variables. Similarly, the number of tillers was also a significant process variable. All the yield parameters (dependent variables) increased with increase in both number of tillers and number of leaves, and vice versa for season 1 and season 2.
Expanding the optimization to all treatment types at the 15t/ha biochar application level, the desirability factor was used to identify and summarize the optimized response parameters (i.e., process variables) as seen in Table 7.
Conclusions
The possibility of significantly increasing rice yield via a combination of soil conditioning, water management and soil fertility suggests viable and scalable ways of boosting rice supply not only in sub-Saharan Africa but also globally should be explored. To do this, a study was conducted to determine the effects of biochar concentrations treatment levels and fertilizer treatment types on New Rica for Africa (NERICA 2) variety of upland rice development under drip irrigation system. The treatment types included liquid fertilizer - LOF, organic fertilizer - NPK, poultry manure - PM and zero fertilizer - FO, while the biochar concentration treatment levels included 0 t/ha - B0, 5 t/ha - B5, 10t/ha - B10 and 15 t/ha - B15.
The results showed that biochar level at 15t/ha viz-a-viz NPKB15, PMB15, LOFB15 and F0B15 in that order performed best compared to the other treatments levels in agronomic parameters (plant height, stem girth, number of leaves, leaf area, etc.). Panicle length showed the maximum values for PMB15 although all treatments showed the most significant increase between 0t/ha and 5t/ha. Stem girth and leaf area values both showed lesser marginal increases between 0 t/ha and 5 t/ha biochar concentration relative to the other concentrations, indicative perhaps of a better performance above a threshold concentration of 5 t/ha for those indices.
For the yield parameters especially the average yield for paddy and grain (processed rice), the control treatment that had zero fertilizer applied had the least yield of 2.50 t/ha and 2.03 t/ha (3.36 t/ha and 3.26 t/ha) in season 1(2) for the 15 t/ha level i.e., FOB15. It increased to 3.51 t/ha and 2.54 t/ha in season 1, and 4.55 t/ha and 4.08 t/ha in season 2 respectively in LOFB15; and to 5.74 t/ha and 4.69 t/ha in season 1, and 6.00 t/ha and 5.07 t/ha in season 2 respectively in PMB15. As with the agronomic parameters too, NPKB15 had the highest average yield of 6.31 t/ha and 6.20 t/ha in season 1 and 6.36 t/ha and 6.21 t/ha in season 2 for paddy and grain (processed rice) respectively. Yield generally increased with increasing biochar concentration treatment levels, and fertilizer application similarly boosted yield significantly.
The optimization results showed that the possible interactions were number of leaves and number of tillers. Yields increased with increase in number of tillers and number of leaves and vice-versa in both experimental seasons.
The results of the study clearly show that fertilizer and biochar treatment combinations were very effective in enhancing rice yields and offer different routes to achieving the desired outcomes. While there may be some other variations that can further optimize yield such as adjusting crop spacing, plant variety and or water efficiency, the approach recommended in this study showed the best performance in an array of available research studies. The repeatability of the studies makes it very easy to adopt by subsistent and or commercial farmers.
Acknowledgments
The author (s) are grateful to the department of Agricultural & Environmental Engineering, Federal University of Technology, Akure, Nigeria for the use of the experimental farm for the research study and to others (individuals and organizations) who contributed in no small measures to see to the success of the work, including the anonymous reviewers and family members, for a job well-done.
References
- Akinbile CO, Abd-El-Latiff KM, Yusoff MS, et al. (2011) Rice production and water use efficiency for self-sufficiency in Malaysia: A Review, Trends Appl Sci Res 6: 1127-1140
- Akinbile CO, Sangodoyin AY (2012) Response of upland rice agronomic parameters to variable water supply. Int J Agric & Biol Eng 4: 50-58.
- Uduma BU, Adeoye S, Agbonlahor M (2016) Irrigation potentials and rice self-sufficiency in Nigeria: A review. Afr J Agric Res 11: 298-309.
- Mohapatra S (2006) Putting rice on the African agenda. Int Rice Res Notes 5: 50.
- Oladele S, Awodun M (2014) Response of lowland rice to biofertilizers inoculation and their effects on growth and yield in Southwestern Nigeria. Journal of Agriculture and Environmental. Science 3: 371-
- Awodun MA, Oladele SO, Adeyemo A (2017) Efficient nutrient use and plant probiotic microbe interaction. Probiotics in agroecosystem.
- Ray DK, Mueller ND, West PC, et al. (2013) Yield trends are insufficient to double global crop production by 2050. PLoS One 8.
- Faloye OT, Alatise MO, Ajayi AE, et al. (2019) Effects of biochar and inorganic fertilizer applications on growth, yield and water use effciency of maize under deficit irrigation. Agric Water Manag 165-178.
- Faloye OT, Alatise MO, Ajayi AE, et al. (2017) Synergistic effects of biochar and inorganic fertilizer on maize (Zea Mays) yield in an alfisol under drip irrigation. Soil Tillage Res 174: 214-
- Lehmann J, Joseph S (2009) Biochar for environmental management: An introduction. In: Lehmann Joseph S, Biochar for environmental management: Science and technology. Earthscan, London, 1-
- Sohi S, Krull E, Lopez-Capel E, et al. (2010) A review of biochar and its use and function in soil. Advances in Agronomy 105: 47-
- Liang X, Gao Y, Zhang X, et al. (2014) Effect of optimal daily fertigation on migration of water and salt in soil, root growth and fruit yield of cucumber (Cucumis sativus L.) in Solar-Greenhouse. PLoS ONE 9.
- Ali M, Kim PJ, Inubushi K (2015) Mitigating yield-scaled greenhouse gas emissions through combined application of soil amendments: A comparative study between temperate and subtropical rice paddy soils. Science of Total Environment 529: 140-
- Lehmann J (2007) Bio-energy in the Black. Front Ecology of Environment 5: 381-387.
- Mukherjee A, Zimmerman AR, Harris WG (2011) Surface chemistry variations among a series of laboratory- produced biochars. Geoderma 163: 247-
- Butnan S, Deenik JL, Toomsan B, et al. (2015) Biochar characteristics and application rates affecting corn growth and properties of soils contrasting in texture and mineralogy. Geoderma 237-238: 105-
- Gaskin JW, Speir RA, Harris K, et al. (2010) Effect of peanut hull and pine chip biochar on soil nutrients, corn nutrient status and yield. Journal of Agronomy 102: 623-
- Major J, Rondon M, Molina D, et al. (2012) Nutrient leaching in a Colombian savanna oxisol amended with biochar. J Environ Qual 41: 1076-
- Liao N, Hou ZA, Li Q, et al. (2015) Increased effect of biochar on cotton yield and nitrogen use efficiency under different nitrogen application levels. Journal of Plant Nutrition Fertility 21: 782-
- Zhang AF, Bian RJ, Pan GX, et al. (2012) Effects of biochar amendment on soil quality, crop yield and greenhouse gas emission in a chinese rice paddy: A field study of two consecutive rice growing cycles. Field Crop Research 127: 153-
- Gathorne-Hardy A, Knight J, Woods J (2009) Biochar as a soil amendment positively interacts with nitrogen fertilizer to improve barley yields in the UK. IOP Conference Series: Earth and Environmental Science. 6. IOP Publishing, London, 37-52.
- Lusiba S, Odhiambo J, Ogola J (2016) Effect of biochar and phosphorus fertilizer application on soil fertility: Soil physical and chemical properties. Arch Agron Soil Sci 63: 473-490.
- Liu J, Schulz H, Brandl S, et al. (2012) Short-term effect of biochar and compost on soil fertility and water status of a dystric cambisol in NE Germany under a field conditions. J Soil Sci Plant Nutr 175: 698-
- Schulz H, Dunst G, Glaser B (2013) Positive effects of composted biochar on plant growth and soil fertility. Agron. Sustain. Dev 33: 817-
- Schulz H, Glaser B (2012) Effects of biochar compared to organic and inorganic fertilizers on soil quality and plant growth in a greenhouse experiment. J Soil Sci Plant Nutr 175: 410-
- Naidu R, Kookana RS, Sumner ME, et al. (1997) Cadmium sorption and transport in variable charge soils: A Review. Journal of Quality Environment 26: 602-
- Hossain MK, Strezov V, Chan KY, et al. (2010) Agronomic properties of wastewater sludge biochar and bioavailability of metals in production of cherry tomato (Lycopersicon esculentum). Chemosphere 78: 1167-
- Major J, Lehmann J, Rondon M, et al. (2010) Fate of soil-applied black carbon: Downward migration, leaching and soil respiration. Glob Chang Biol 16: 1366-1379.
- Chan KY, Van Zwieten L, Meszaros I, et al. (2007) Agronomic values of greenwaste biochar as a soil amendment. Australian Journal of Soil Research 45: 629-
- Yeboah E, Ofori P, Quansah GW, et al. (2009) Improving soil productivity through biochar amendments to soils. Afr J Environ Sci Tech 3: 34-
- Edoga RN, Edoga MO (2006) Design of drip irrigation set for small vegetable gardens. notulae botanicae horticultura Agrobotanici Cluj-Napoca 34: 1842-4309.
- Akinbile CO, Eze RC, Yusuf H, et al. (2019) Effect of some selected soil properties, moisture content, yield and consumptive water use on two cassava (TMS 0581 and TME 419) varieties. Journal of Agricultural Engineering 166-172.
- Yakout SM (2017) Physicochemical characteristics of biochar produced from rice straw at different pyrolysis temperature for soil amendment and removal of organics. National Academy of Sciences, India 87:207-214.
- Jiang J, Peng YB, Yuan M, et al. (2015) Rice straw derived biochar properties and functions as cu (ii) and cyromazine sorbents as influenced by pyrolysis temperature. Pedosphere 25: 781-789.
- Kamara, AK, Hawanatu K, Mohamed S (2015) Effect of rice straw biochar on soil quality and the early growth and biomass yield of two rice varieties. Journal of Agricultural Sciences 6: 798-806.
- Weixiang W, Min Y, Qibo F, et al. (2012). Chemical characterization of rice straw derived biochar for soil amendment. Biomass and Bioenergy Journal 47: 268-276.
- ASTM E873-82 (2013). Standard test method for bulk density of densified particulate biomass fuels. ASTM International, West Conshohocker, PA.
- Naeem MA, Khalid M, Arshad M, et al. (2014) Yield and nutrient composition of biochar produced from different feedstocks at varying pyrolytic temperatures. Pak J Agri Sci 51: 75-82.
- Ndor E, Dauda SN, Azagakui ED (2015) Response of maize varieties (Zea mays) to biochar amended soil in Lafia, Nigeria. American Journal Exp Agric 5: 525-
- IITA (International Institute of Tropical Agriculture) (2014) Rice Production Manual.
- Marcos BC, Sidney RV, Adre LOV, et al. (2009) Topography and spatial variability of soil physical properties. Sci Agric (Piracicaba, Braz.) 66: 338-
- Fasinmirin JT, Reichert JM, Ajayi AE (2014) Leaf chlorophyll and biomass yield of green house tomato (Lycopersicon Esculentum Mill) under different urea application rates. Proceedings of the 2014 International Conference of the Nigerian Institution of Agricultural Engineers. Federal University of Technology, Akure, Nigeria, 154-
- Major J (2015) Guidelines on practical aspects of biochar application to field soil in various soil management systems, IBI.
- Paz-Ferreiro J, Gasco G, Gutierrez B, et al. (2012) Soil biochemical activities and the geometric mean of enzyme activities after application of sewage sludge and sewage sludge biochar to soil. Biol Fertil Soils 48: 511-
- Vaccari F, Baronti S, Lugato E, et al. (2011) Biochar as a strategy to sequester carbon and increase yield in durum wheat. Eur J Agron 34: 231-
- Okonwu K, Mensah SI (2012) Effects of NPK (15:15:15) fertilizer on some growth indices of pumpkin. Asian J Agric Res 6: 137-143.
- Abd El-Aziz, Nahed G (2007) Stimulatory effect of NPK fertilizer and benzyladenine on growth and chemical constituents of Codiaeum variegatum plant. American-Eurasian J Agric & Environ.Sci 2: 711-719.
- Major J, Rondon M, Molina D, et al. (2010) Maize Yield and Nutrition after 4 years of Biochar Application to a Colombian Savanna Oxisol. Plant and Soil 333: 117-128.
- WARDA (Africa Rice Center) (2007). The New Rice for Africa (NERICA) - a Compendium.
Corresponding Author
Christopher O AKINBILE, Department of Agricultural and Environmental Engineering, Federal University of Technology, Akure, Nigeria
Copyright
© 2022 EZE RC, et al. This is an open-access article distributed under the terms of the Creative Commons Attribution License, which permits unrestricted use, distribution, and reproduction in any medium, provided the original author and source are credited.