Methane and Nitrous Oxide Emission from Louisiana Rice Fields under Three Water Management Practices
Abstract
A two-year experiment was conducted in 2013 and 2014 to evaluate the effect of water management practices on methane (CH4) and nitrous oxide (N2O) emission, and grain yield from Louisiana rice fields. Three water management practices, including delayed flooding (DF), straighthead (SH), and intermittent flooding (IF), were evaluated. Seasonal cumulative CH4 emissions were lowest in IF treatment in both 2013 (125 kg CH4 ha-1) and 2014 (271 kg CH4 ha-1), followed by SH treatment 209, and 287 kg CH4 ha-1 in 2013 and 2014, respectively. The highest CH4 emission was observed in DF treatment for both years 239, and 295 kg CH4 ha-1 in 2013 and 2014. Mean daily CH4 emissions ranged from 1.49 to 2.84 kg CH4 ha-1 d-1 in 2013 and 2.91 to 3.18 kg CH4 ha-1 d-1 in 2014. CH4 emissions of the IF treatment were reduced by 39% (2013) and 8% (2014) as compared to the DF treatment. Seasonal cumulative N2O emissions were 141 to 152 (g N2O ha-1) in 2013, and 161 to 177 (g N2O ha-1) in 2014. Mean daily N2O emissions ranged from 1.68 to 1.81 g N2O ha-1 d-1 in 2013, and 1.92 to 2.11 g N2O ha-1 d-1 in 2014. Mid-season field drying did not impact N2O emissions. The contribution of CH4 to Global Warming Potential (GWP) was significantly higher than N2O. IF water management practice showed a potential to reduce methane emissions without significance yield loss compared to the DF water management practice.
Keywords
Rice, Methane, Nitrous Oxide, Drill-Seeded, Delayed Flooding, Intermittent Flooding
Introduction
Rice (Oryza sativa) is a staple crop for almost half of the global population and the world's third-most important crop, behind only wheat and corn. Approximately 90% of the world's rice is grown in flooded or anaerobic soil [1]. Anaerobic soil conditions lead to increased CH4 emissions compared with crops grown in upland, aerobic systems [2,3]. CH4 generated in anaerobic soils by the microbial decomposition of organic matter is a process, which typically begins in rice fields two weeks after flooding [4]. Therefore, if water management practices are altered, there presumably will be corresponding changes in methane emissions. Several studies have shown that alternative water management practices involving mid-season drainage can help mitigate methane emissions from rice fields [5-7]. Jiao, et al. [8] also reported that intermittent irrigation practices decreased seasonal CH4 emissions by 24% compared to a conventional water regime. Temporary aeration involved in these alternative practices resulting in reduced CH4 emission rates is due to an increase in soil redox potential, which decreases CH4 production and increases CH4 oxidation rates [9].
Alternate wetting and drying or intermittent flooding has been practiced in many rice growing areas. Alternate wetting and drying (AWD) water management practice would be the most promising mitigation option for CH4 methane emissions from irrigated rice farming as compared to continuous flooding. This practice requires delicate implementation because water stress at any growth stage could also reduce rice grain yield [10] reported that rice grain yield was reduced by 5-38% under mild water stress while it was reduced by 25-67% under severe water stress. However, various studies have shown the potential to reduce water use by keeping the field dry during midseason without yield reduction [8,11,12]. Besides reducing water use, drying the field can also significantly reduce CH4 emission [6,13,14]. Rice plant is most sensitive to water stress during the reproductive stage, when lack of water at flowering stage causes a high percentage of grain yield reduction [15-17].
In aerobic soil conditions under AWD, the higher emissions of N2O as a by-product of nitrification were observed [18]. The majority of N2O emissions in rice systems occur during the field drainage periods when soils change from anaerobic to aerobic conditions may range from 10-75% of the total seasonal N2O emissions [19]. Management practices play significant role on flux rates of N2O from paddies [20]. While CH4 emissions is reduced through intermittent flooding, it is likely that N2O emissions could be increased due to different mechanisms controlling the production of these two major greenhouse gases [18,21]. It is difficult to minimize both gases simultaneously [3].
Louisiana rice production is the third largest producer in the U.S. with approximately 185,000 ha. Various water management practices are used for the production in this area (i.e. continuous flooding, delayed flooding, straighthead, intermittent flooding (or alternate wetting and drying elsewhere), and furrow irrigation). However, only three water management practices were included in this study, delayed flooding, straighthead, and intermittent flooding. In delayed flooding, a permanent flood is applied four to five weeks after seeding. The straighthead management is so-named because this water management practice is recommended to combat the physiological disorder that occurs in rice [22]. In the straighthead management, rice fields are drained two weeks after the establishment of the permanent flood, dried for a few days, and then reflooded [22]. In the intermittent flooding, the initial flood is established, but water in the field is allowed to recede naturally due to the other processes (i.e. evapotranspiration, seepage). Once drained, the soil cracks and the field are reflooded. This cycle is repeated throughout the growing season until the pre-harvest drainage. Fields under any of the water management practices are drained approximately two weeks before rice is harvested [23].
The objective of this study was to evaluate CH4 and N2O emissions, global warming potential (GWP), and grain yield from three water management practices; delayed flooding (dominant water management practice in South Louisiana), straighthead, and intermittent flooding on rice grown in South Louisiana.
Materials and Methods
Site description
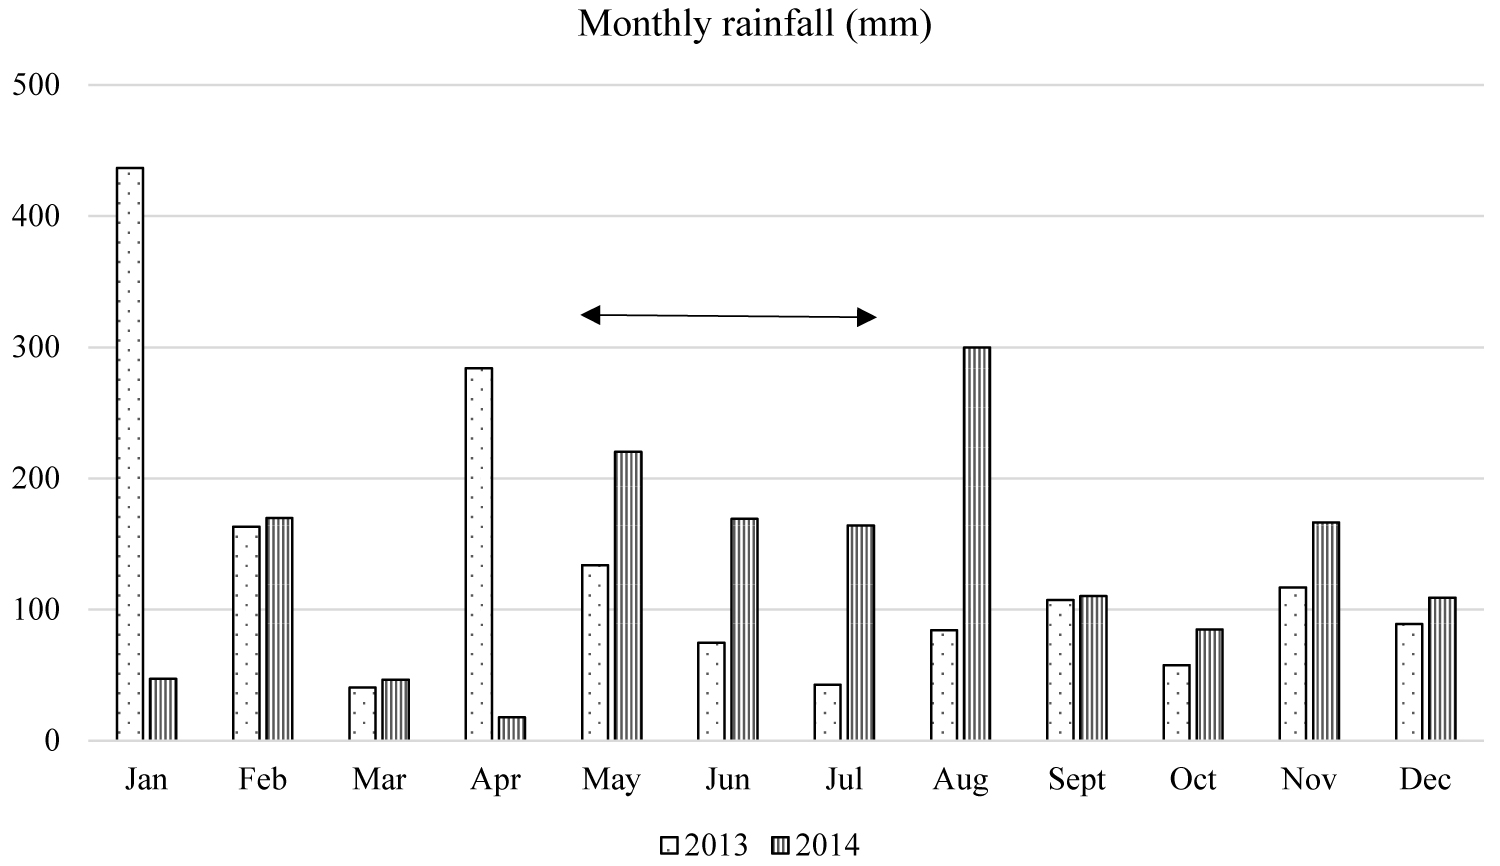
Field experiments were conducted at the LSU Agricultural Center H. Rouse Caffey Rice Research Station near Crowley, Louisiana. The study area has been managed in a rice-fallow system from March to August for cropping season of 2013 (30° 14'17.44" N, 92° 21'8.14" W) and 2014 (30° 14'47.55" N, 92° 20'59.16" W). The soil at study site was a Crowley silt loam (Typic Albaqualfs) [24]. The slope across the study area was approximately 0.1%. A composite soil sample was collected for nutrient analysis before planting in both 2013 and 2014 (Table 1). Monthly rainfall data was collected from a weather station at the H. Rouse Caffey Rice Research Station during the study (Figure 1).
Experimental design and agronomic management
The experimental plots were arranged in a split-plot experimental design with four replications for grain yield evaluation. The treatments were three water management practices as main-plot and three rice varieties as sub-plot. The three water management practices were delayed flooding (DF), straighthead management (SH), and intermittent flooding (IF). In the DF water management, permanent flood initiated at 4-5 weeks after planting and maintained water throughout the season. Soil moisture probes that connected to soil moisture monitor (Watermark, model 900M, IRROMETER, CA, USA) were installed at 10 cm depth in all three water management plots. In the SH water management, a short period of drain after permanent flood was initiated. In the IF water management treatment, multiple short periods of drains were applied (three times for both years). Re-flooding of each drain was performed when the soil moisture monitor reached -20 kPa in the SH and IF water managements. From our calibration using gravimetric method, soil moisture content at -20 kPa in the SH and IF for both years range from 19.6-27.9% (w/w). Permanent flood was drained before harvesting in all water management treatments.
Three rice varieties were CL151, Cheniere, and Jupiter in 2013, and CLXL729, Cheniere, and Jupiter in 2014. These varieties are all recommended in Louisiana due to their high yield potentials and disease resistance [25]. Plot size was 1.42 m × 4.88 m and included seven rows of rice 20.3 cm apart. Seeding rate for non-hybrid varieties was 355 seeds m-2 and 151 seeds m-2 for hybrid variety (CLXL729).
In 2013, the rice was drill-seeded on March 15 with emergence occurring on March 28 (13 DAP (days after planting)). Phosphorus (P) and potassium (K) fertilizers were applied to the plots at planting at a rate of 75 kg ha-1. Nitrogen (N) in form of urea was applied at a rate of 135 kg ha-1 one day before permanent flood established on May 17 (63 DAP), almost five weeks after planting. All water management treatments, the last drained was on July 29 (136 DAP), prior to harvesting on August 8 (146 DAP), with 73 days under flooded conditions for the delayed flooding management practice. In the SH treatment, the short period of drained was on June 1 (78 DAP) and a permanent flood was re-established on June 5 (82 DAP), with 69 days under flooded conditions. In the IF treatment, three re-flooding events took place when the soil moisture content reached -20 kPa on June 21 (98 DAP), July 5 (112 DAP), and July 22 (129). The total number of flooding days was 61. Grain yield was measured at 12% moisture content and calculated in kilograms per hectare (kg ha-1).
In 2014, the rice was drill-seeded on March 13 and emergence occurred on March 30 (17 DAP). All fertilizer management practices were the same as the 2013 trial as described above. A permanent flood was established on May 9 (57 DAP) and drained for harvesting on July 31 (140 DAP). In the SH treatment, the short period of drained was on May 23 (71 DAP) and the permanent flood was re-established on May 27 (75). In the IF treatment, three re-flooding events took place when the soil moisture content reached -20 kPa on May 23 (71 DAP), June 9 (88 DAP), and June 23 (102 DAP). Number of flooding days for DF, SH, and IF were 83, 79 and 71 respectively. Rice was harvested on August 14 (154 DAP). Grain yields were measured from the whole plot at 12% moisture content and calculated in kilograms per hectare (kg ha-1).
Gas sample collection and analyses
CH4 and N2O flux by a diffusion chamber was measured using a completely random design in which each water management practice constituted a treatment with three replications. To represent emission data from outstanding rice cultivars in Louisiana, each replication corresponded with a different cultivar: a medium-grain (Jupiter) and two long-grains (CL151 and Cheniere) cultivars. Weekly headspace emissions measurements for CH4 and N2O were conducted using the static closed chamber method [24,26,27]. However, if the scheduled date has a severe weather condition, then the sampling will be done immediately when weather permits. As an increased of hybrid rice acreage in south Louisiana, a hybrid rice cultivar CLXL729 was selected to replace CL151 in 2014 in order to measure methane and nitrous oxide emissions from the outstanding rice varieties in the region. The diffusion chambers were composed of a base and a removable top, each constructed of clear plexiglass measuring 30 cm × 30 cm × 30 cm. Three chamber bases were installed in each water treatment and were left in the place over the entire growing season. Additional bases were stacked on top as needed to accommodate the growth of the rice crop. Gas sampling occurred from 10:00 am to 12:00 pm and sampling techniques were identical for each replication within each treatment. During flux measurements, the trough of each sampling base was filled with water to seal the diffusion chamber. A rubber septum on top of each chamber served as the gas sampling port and a thermometer (on top of each chamber) was used to measure air temperature. Additionally, air samples outside the chambers in each water management treatment were taken for background concentration comparison.
The headspace gas was mixed each time before collecting a sample. A 15 mL gas sample was withdrawn from the septum at the top of the chamber using a 20 mL gas-tight syringe at 30-minute intervals, beginning at 0 minutes when the top chamber was installed, 30-, and 60-minute marks. Once the sample was collected, it was immediately injected into a pre-evacuated, 10-mL glass vial sealed with crimp-top butyl stopper. Floodwater heights and air temperature inside the chamber were recorded for calculating methane and nitrous oxide flux.
The gas samples were analyzed for CH4 and N2O using the Varian CP- 3800 GC. The gas-tight syringe was used to withdraw 2.5 mL gas sample from each sample's vacutainer and injected into the stainless-steel GC column. The data recorded from the GC results was converted from parts per million by volume (ppmv) to mass per unit volume (mg m-3) under the assumption of a standard atmospheric pressure of 1 atm using the formula:
where M is the molecular weight of the gas (16.04 g mol-1 for CH4 and 44.01 g mol-1 for N2O), R is the gas constant (0.08206 L atm K-1 mol-1) and T is the temperature at sampling time in degrees Kelvin (K).
These converted values were then used to calculate the CH4 and N2O flux per unit area. Methane and N2O fluxes were computed using the formula:
Where F is the CH4 or N2O flux rate in mg m-2 d-1, ΔC is the change in concentration of the gas with the corresponding change in time (Δt), V is the chamber volume, A is the enclosed surface area, and T is the final temperature in degrees Kelvin (K). The seasonal or yearly cumulative emission was calculated from daily emissions assuming the flux changes between two consecutive sampling days are linear [28].
Global warming potential (GWP) of CH4 and N2O was calculated in mass of CO2 equivalents (kg CO2 eq ha-1) over a 100-year time horizon. The radioactive potentials relative to CO2 of 28 and 265 were used for CH4 and N2O, respectively (IPCC, 2013). Yield-scaled GWP (GWPγ) expressed as GWP per unit mass of rice grain yield (kg CO2 eq Mg grain-1) was calculated by the ratio of GWP (Mg CO2 eq ha-1) and grain yield (Mg ha-1).
Statistical analysis
Grain yield and flux data were entered into SAS 9.4 statistical software using PROC GLM to perform an analysis of variance (ANOVA) to determine significant differences among treatments. Mean separation of significant effects was determined using LSD at P < 0.05.
Results and Discussion
Effect of water management on methane and nitrous oxide flux
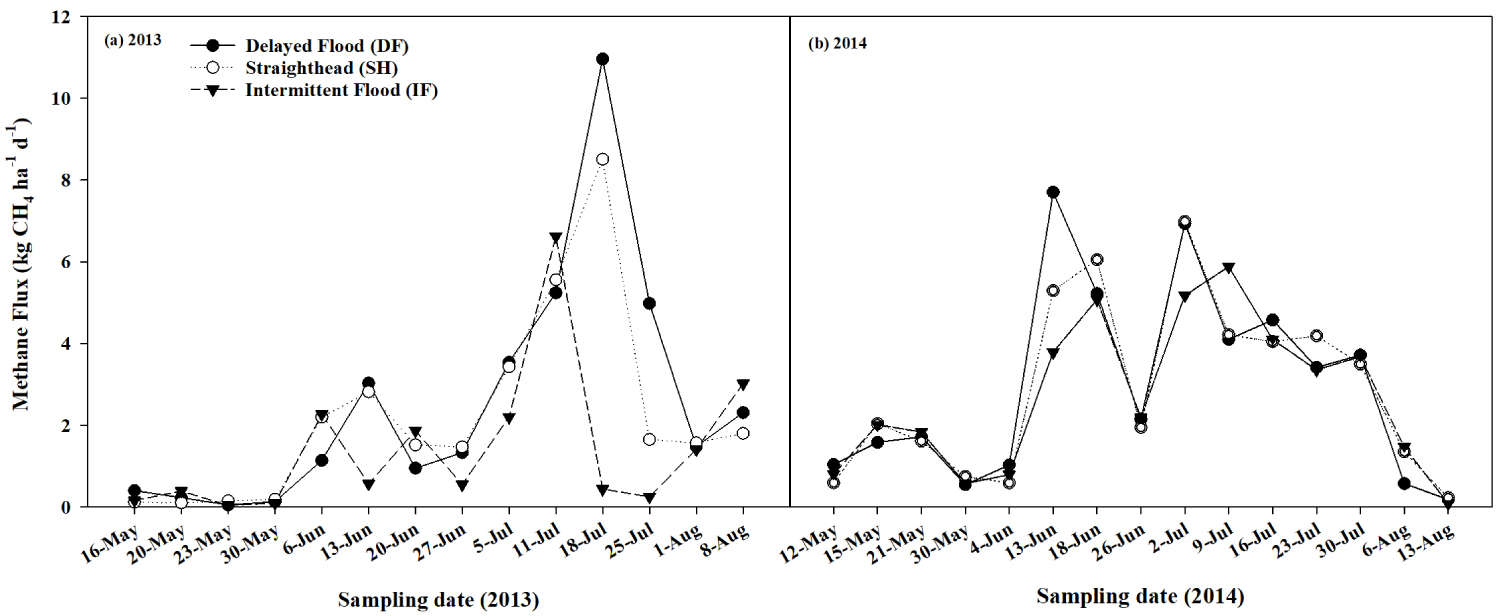
In 2013, methane emissions were highly variable, ranging from 0.04-10.96 kg CH4 ha-1 d-1. CH4 emissions were low for the first three sampling dates in all water management treatments (Figure 2a). Generally, an initial increase in a flux rate began four weeks after the first flood (May 17 (63 DAP)), which took place from June 6 (83 DAP). A decreasing trend was then observed on June 27 (104 DAP), when a second, larger increase in the flux for all treatments began. The maximum peak of the DF (10.96 kg CH4 ha-1 d-1) and SH (8.51 kg CH4 ha-1 d-1) treatments was recorded on July 18 (125 DAP) but it was observed on July 11 (118 DAP) for IF treatment (6.62 kg CH4 ha-1 d-1). The flux rate generally decreased in all treatments after July 18 (125 DAP) until the main crop harvest on August 8 (146 DAP).
In 2014 (Figure 2b), the highest methane emission was 7.70 kg CH4 ha-1 d-1 in the DF treatment and the lowest was 0.08 kg CH4 ha-1 d1 in the IF treatment. There was only one significant difference (P = 0.047) of methane flux from the sampling on June 13 (92 DAP) were 7.70 (a), 5.29 (ab), and 3.79 (b) kg CH4 ha-1 d-1 from the DF, SH, and IF treatments, respectively.
Daily CH4 emissions were not statistically different in both 2013 (P = 0.087) and 2014 (P = 0.517). The lowest was in the IF treatment for both 2013 and 2014 (Table 2). The lowest mean emissions per day was 1.49 kg CH4 ha-1 d-1 in the IF treatment in 2013 and 2.91 kg CH4 ha-1 d-1 and the highest mean was 2.84 and 3.18 kg CH4 ha-1 d-1 in the DF treatment in 2013 and 2014, respectively. In 2013, CH4 cumulative emission in the DF treatment (239 kg CH4 ha-1 yr-1), the SH treatment (209 kg CH4 ha-1 yr-1), and the IF treatment (125 kg CH4 ha-1 yr-1). In 2014, cumulative methane emissions were 295, 287, and 271 kg CH4 ha-1 yr1 for the DF, SH, and IF treatments, respectively. The cumulative CH4 emissions for 2013 were statistically different in IF treatments as compared to both DF and SH treatments (P = 0.018) but there were not statistically different in 2014 (P = 0.712). In addition, there was not significant different of methane emissions between DF and SH in both year trials. A short drying period (4 days) in the SH treatment did not affect CH4 emission as compared to the DF treatment.
Alternative water management practices have been shown to substantially influence CH4 emissions [29,30]. Alternate wetting and drying of rice fields by draining and re-flooding one or more times during the growing season, has been promoted as a management practice to reduce greenhouse gas emissions and maintaining rice grain yields (Richard and Sander 2014). In this study, methane emissions (Table 2) showed no differences between the DF and SH treatments in 2013, but the emissions from both DF and SH treatments were significantly higher than the IF treatment. Meanwhile the results in 2014, methane emissions were not different among all water treatments. The most likely cause of the higher emission in the IF treatment in 2014 is unexpected rainfall when the field was supposed to be drained as treatment scheduled (May-July) in 2014. The rainfall during the water management treatment in 2014 (554 mm) was approximately 2 times higher than that of 2013 (251 mm). In addition to the rainfall, soil organic matter and plant biomass in 2014 were also higher than the trail in 2013. Chidthaisong and Watanabe [31] reported that early CH4 emissions are often attributed to the decomposition of previous crop residues while emissions latter in the season are attributed to root-derived carbon. Thus, the higher plant biomass or grain yield (Table 2) could result in higher CH4 emissions in the rice fields.
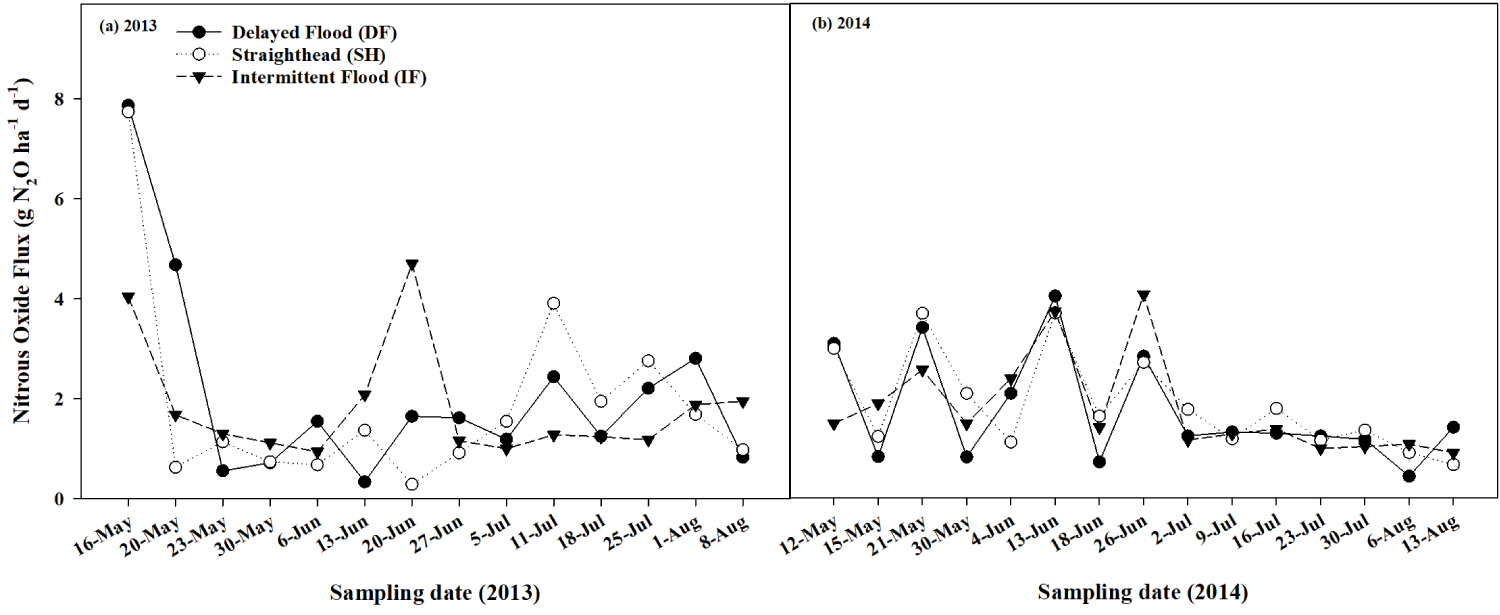
The highest flux of nitrous oxide in 2013 was detected at the first sampling on May 16 (62 DAP) (7.87, 7.74, and 4.04 g N2O ha-1 in the DF, SH, and IF water treatments, respectively. The lowest N2O flux was 0.29 g N2O ha-1 detected in SH treatment (Figure 3a) on Jun 20 (97 DAP). In the IF treatment, the highest flux was also observed on the same sampling day (4.7 g N2O ha-1). Overall, there were no significant effects of water management treatments on N2O flux either daily or seasonal in both 2013 and 2014 (Table 2). This is similar to findings of Linquist, et al. [3] that N2O emissions typically a small portion of total greenhouse gas emissions from the rice field even in the alternate wetting and drying which the fields are drained during the growing season.
In 2014, the lowest N2O flux was 0.43 g N2O ha-1 in the DF treatment (Figure 3b) measured on Aug 6 (146 DAP), and the highest was detected in the IF treatment (4.07 g N2O ha-1) measured on Jun 26 (105 DAP) The average flux of N2O was higher than the flux in 2013 (Table 2). The flux from both trials was highly variable and no significant differences between water management treatments were calculated. Our results did not show the impact of draining the field on N2O emission as reported by others, such as Johnson-Beebout et al. [21], which could be attributed to our practice of a single preflood N application resulted in very low level of residual N fertilizer before draining. LaHue, et al. [7] reported that the emissions of N2O were maintained close to undetectable when the drying periods occurred when there is a low mineral N in soil. In addition to nitrogen management, the sampling frequency can affect annual N2O fluxes calculation. Barton, et al. [32] also report that daily sampling would be the most accuracy method for interpreting the N2O annual emissions.
Effect of water management on grain yield
Average grain yields of three rice varieties in each water management practice for both experiments in 2013 and 2014 are shown in Table 2. In 2013, the grain yields ranged from 7,097 kg ha-1 in the IF treatment to 8,079 kg ha-1 in the DF treatment. Based on the mean separation, the average yields in the DF treatment were significantly greater than the IF treatment, while there was no significant difference between yields in the DF and SH treatments, and between the SH and IF treatments (P = 0.037).
In 2014, grain yields ranged from 11,083 kg ha-1 in the SH treatment to 11,351 kg ha-1 in the DF treatment. There were no statistical differences between grain yields in all water management treatments (P = 0.304). Yield of all treatments in 2014 were higher than the same treatment in 2013, which could be related to rainfall.
It is important to consider the potential effects that changing water management practices would have on the agronomics and economics of producing a commercial rice crop. Most rice cultivars are bred to be grown in aquatic, anaerobic environments and rice grain yield has been shown to be positively correlated with the amount of water used [10]. Subjecting one of these cultivars to even temporary aerobic conditions could potentially induce water stress and dramatically reduce yields by increasing the incidence of pest and pathogen damage, as well as increasing competition with weeds. Recent research has focused on growing rice with less water and reduce methane emissions [33,34]. Early studies reported that yield declines from alternate wetting and drying [35] and without yield reduction [6,8,11,12]. Number of studies in Asia typically found that yield increases [36-38]. In this study, the lower grain yield in 2013 (Table 2) was more likely due to dryer condition from lower amount of rainfall during the growing period as compared to the trial in 2014. Result was similar to the meta-analysis of Jiang, et al. [14] summarized that the severe drying can reduce yields.
Even though alternate wetting and drying or intermittent flooding are well known in term of mitigation of methane emissions, this practice could cause yield reduction. In fact, this practice is different from place to place for the number of drying days, frequency, and growth stage. The meta-analysis of Carrijo, et al. [40] concluded that grain yields in mild drying treatment are similar to continuous flood while severe drying leads to yield reductions.
Global warming potential (GWP) and yield-scaled GWP (GWPγ)
GWP in 2013 was significantly different (P = 0.007) by water management treatment. The DF treatment had the highest GWP (6732 kg CO2 eq ha-1) followed by SH treatment (5889 kg CO2 eq ha-1), and the IF treatment (3539 kg CO2 eq ha-1) (Table 2). The IF water treatment had 47% GWP lower than DF treatment, and the SH treatment was lower by 13% as compared to the DF treatment. The GWP in 2014 was not significantly different (P = 0.619) between the water treatments. The GWP was higher than 2013 in all treatments. The highest GWP was 8303, 8083, and 7634 kg CO2 eq ha-1 in the DF, SH, and IF treatment, respectively. The differences of GWP between water management treatments were also lower than that of 2013. GWP in the IF treatment was 8% lower than the DF treatment and it was lower by 3% in SH treatment compared to DF treatment. Over 90% of GWP was mainly contributed from CH4 emissions. In 2013, it was not different between DF and SH treatments, but both treatments were higher than the IF treatment. In 2014, however, there were not different among three water management treatments. GWP contributed from N2O was not significant between treatments for both years (Table 2). In 2013, GWP contributed from N2O accounted for 0.59, 0.63, and 1.10% for DF, SH, and IF treatments, respectively. GWP contributed from N2O in 2014 were 0.52, 0.58, and 0.60% for DF, SH, and IF treatments, respectively. The contribution of N2O to GWP was significant low regardless of water management practices.
Yield-scaled GWP (GWPγ) was also similar trend with the GWP. In 2013, the GWPγ were significantly different among the three water management treatments (P = 0.009), which the lowest was observed in the IF treatment (499 kg CO2 eq Mg grain-1) as compared to both DF (833 kg CO2 eq Mg grain-1) and SH (796 kg CO2 eq Mg grain-1) treatments. In 2014, however, there were no significant differences in GWPγ (P = 0.611). In 2013, GWPγ was approximately reduced by 40% in the IF treatment as compared to the DF treatment and it was reduced by 8% in the same treatment in 2014. Our results were similar to Tran, et al. [29] which found that GWPγ in single and multiple drains treatments were lower than the continuous flooding treatment.
Conclusions
Results from this study support the premise that methane emissions were reduced in the lower water use practice. However, heavy reduction of water use could reduce grain yield. A short period of drainage in the SH treatment did not show any reduction of CH4 emissions compared to the DF treatment. The IF water management practice showed the lowest methane emissions but could negatively impact grain yield. In addition, field drainage during the growing season in the SH and IF treatments did not increase N2O emission as compared to DF treatment, the dominant water management practice in South Louisiana.
The interaction among rice cultivars, water management practices, and environment conditions on CH4 emissions requires further investigation. Field drying severity, nitrogen fertilizer management, including rice growth stages are the major keys for controlling emissions and yield. Co-management of these factors must be investigated.
Acknowledgement
This work was partially supported by the Louisiana Rice Research Board. We would like to thank Drs. R.D. DeLaune and C.W. Lindau who provided very helpful suggestions for improving the manuscript.
References
- Maclean JL, Dawe DC, Hardy B, et al. (2002) Rice almanac: Source book for the most important economic activity on earth. 3rd edition, CABI Publishing Series Wallingford, UK.
- Wassmann R, Neue HU, Lantin RS, et al. (2000) Characterization of methane emissions from rice fields in Asia. II. Differences among irrigated, rainfed, and deepwater rice. Nutrient Cycling in Agroecosystems 58: 13-22.
- Linquist BA, van Groenigen KJ, Adviento-Borbe MAA, et al. (2012) An agronomic assessment of greenhouse gas emissions from major cereal crops. Glob Chang Biol 18: 194-209.
- Neue HU (1993) Methane emissions from rice fields: Wetland rice fields may make a major contribution to global warming. Bioscience 43: 466-474.
- Lindau CW, Patrick WH Jr, DeLaune RD, et al. (1990) Rate of accumulation and emission of N2, N2O, and CH4 from flooded rice soil. Plant Soil 129: 269-276.
- Kongchum M, Bollich PK, Hudnall WH, et al. (2006) Decreasing methane emission of rice by better crop management. Agron Sustain Dev 26: 45-54.
- LaHue GT, Chaney RL, Adviento-Borbe MA, et al. (2016) Alternate wetting and drying in high yielding direct-seeded rice system accomplishes multiple environmental and agronomic objectives. Agriculture, Ecosystems and Environment 229: 30-39.
- Jiao Z, Hou A, Shi Y, et al. (2006) Water management influencing methane and nitrous oxide emissions from rice field in relation to soil redox and microbial community. Commun. Soil Sci Plant Anal 37: 1889-1903.
- Sigren LK, Lewis ST, Fisher FM, et al. (1997) Effects of field drainage on soil parameters related to methane production and emission from rice paddies. Glob Biogeochem Cycles 11: 151-162.
- Yang Xiaguang, Wang H, Wang Z, et al. (2002) Yield of aerobic rice (Han Dao) under different water regimes in North China. In: Bouman BAM, Hengsdijk H, Hardy B, et al. Water-wise rice production. Los Baños, Philippines, 155-163.
- Tuong TP, Bouman BAM (2003) Rice production in water-scarce environments. In: Kijne JW, Barker R, Molden DJ, Water productivity in agriculture: limits and opportunities for improvement. Manila, Phillipines, 53-67.
- Zhao L, Wu L, Li Y, et al. (2009) Influence of the system of rice intensification on rice yield and nitrogen and water use efficiency with different N application rates. Exp Agric 45: 275-286.
- Wassmann R, Hosen Y, Sumfleth K (2009) Reducing Methane emissions from irrigated rice. Agriculture and climate change: An agenda for negotiation in Copenhagen, Series number. International Food Policy Research Institute IFPRI 16, Washington (DC).
- Jiang Y, Carrijo D, Huang S, et al. (2019) Water management to mitigate the global warming potential of rice systems: A global meta-analysis. Field Crop Research 234: 47-54.
- Kamoshita A, Babu RC, Boopathi, et al. (2008) Phenotypic and genotypic analysis of drought-resistance traits for development of rice cultivars adapted to rainfed environments. Field Crops Res 109: 1-23.
- Palanog AD, Swamy BPM, Shamsudin NAA, et al. (2014) Grain yield QTLs with consistent-effect under reproductive-stage drought stress in rice. Field Crops Res 161: 46-54.
- Yang Xiaolong, Wang Benfu, Chen Liang, et al. (2019) The different influences of drought stress at the flowering stage on rice physiological traits, grain yield, and quality. Scientific Reports 9: 3742.
- Lagomarsino A, Agnelli AE, Linquist B, et al. (2016) Alternate wetting and drying of rice reduced CH4 emissions but triggered N2O peaks in a clayed soil of central Italy. Pedosphere 26: 533-548.
- Adviento-Borbe MAA, Pittelkow C, Anders M, et al. (2013) Optimal fertilizer N rates and yield-scales global warming potential in drill seeded rice. J Environ Qual 42: 1623-1634.
- Pittelkow CM, Adviento-Borbe MAA, Hill JE, et al. (2013) Yield-scaled global warming potential of annual nitrous oxide and methane emissions from continuously flooded rice system in response to nitrogen input. Agric Ecosyst Environ 177: 10-20.
- Johnson-Beebout SE, Angeles OR, Alberto MC, et al. ( 2009) Simultaneous minimization of nitrous oxide and methane emission from rice paddy soils is improbable due to redox potential changes with depth in a greenhouse experiment without plants. Geoderma 149: 45-53.
- Pan X, Zhang Q, Yan W, et al. (2012) Development of genetic markers linked to straighthead resistance through fine mapping in rice (Oryza Sativa L.) PLoS One 7: e52540.
- Saichuk JK, Schultz B, Hollier CA, et al. (2014b) Louisiana Rice Production Handbook.
- Baton Gardisser D (2014b) Louisiana Rice Production Handbook. Louisiana Ag Center, Baton Rouge (LA).
- Lindau CW, Bollich PK, DeLaune RD, et al. (1991) Effect of urea fertilizer and environmental factors of CH4 emissions from a Louisiana, USA rice field. Plant Soil 136: 195-203.
- Saichuk JK, Hollier CA, Groth DE, et al. (2014a.) 2014 Rice varieties & management tips. Louisiana AgCenter, Baton Rouge (LA), USA.
- Rolston DE (1986) Gas Flux In: Klute A, Methods of soil analysis, Part 1, Physical and mineralogical methods. (SSSA Book Ser. 5.1), American Society of Agronomy, Madison, USA, 1103-1119.
- Yu K, Hiscox A, DeLaune RD (2013) Greenhouse gas emission by static chamber and eddy flux methods. In: DeLaune RD, Reddy KR, Richardson C, Megonigal JP, Methods in Biogeochemistry of Wetlands. Soil Science Society of America, Madison,USA, 427-437.
- Tran DH, Hoang TN, Tokida T, et al. (2018) Impacts of alternate wetting and drying on greenhouse gas emission from paddy field in Central Vietnam. Soil Sci Plant Nutr 64: 14-22.
- Khosa MK, Sidhu BS, Benbi DK (2011)Methane emissions from rice fields in relation to management of irrigation water. J Environ Biol 32: 169-172.
- Berger S, Jang I, Seo J, et al. (2013) A record of N2O and CH4 emissions and underlying soil processes of Korean rice paddies as affected by different water management practices. Biogeochem 115: 317-332.
- Chidthaisong A, Watanabe I (1997) Methane formation and emission from flooded rice soil incorporated with 13C-labelled rice straw. Soil Biol Biochem 29: 1173-1181.
- Barton L, Wolf B, Rowlings D, et al. (2015) Sampling frequency affects estimates of annual nitrous oxide fluxes. Sci Rep 5: 15912.
- Bouman BAM, Aureus M (2009) Every drop counts. Rice today 8: 16-18.
- Linquist BA, Anders MM, Adviento-Borbe MAA, et al. (2015) Reducing greenhouse gas emissions, water use, and grain arsenic levels in rice systems. Glob Chang Biol 21: 407-417.
- Bouman BAM, Tuong TP (2001) Field water management to save water and increase its productivity in irrigated rice. Agric Water Manag 49: 11-30.
- Kürschner E, Henschel C, Hildebrandt T, et al. (2010) Water saving in rice production - dissemination, adoption, and short-term impacts of Alternate Wetting and Drying (AWD) in Bangladesh. SLE Publication Series S241.
- Rejesus RM, Palis FG, Rodriguez DGP, et al. (2011) Impact of the alternate wetting and drying (AWD) water-saving irrigation technique: evidence from rice producers in the Philippines. Food Policy 36: 280-288.
- Lampayan RM (2013) Smart water technique for rice. International Rice Research Institute (IRRI) -The European Initiative on Agriculture Research for Development (EIARD).
- Carrijo DR, Lundy ME, Linquist BA (2017) Rice yield and water use under alternate wetting and drying irrigation: A meta-analysis. Field Crops Res 203: 173-180.
Corresponding Author
Manoch Kongchum, H. Rouse Caffey Rice Research Station, Louisiana State University Agricultural Center, 1373 Caffey Road, Rayne, Louisiana 70578, USA, Tel: 337-788-7531, Fax: 337-788-7553.
Copyright
© 2020 Kongchum M, et al. This is an open-access article distributed under the terms of the Creative Commons Attribution License, which permits unrestricted use, distribution, and reproduction in any medium, provided the original author and source are credited.