Cadmium Contamination of Food Crops and Soils in Areas under Wastewater-Based Urban Irrigated Agricultural Practices
Abstract
In this study, Cadmium (Cd) concentrations were measured in soils and food crops (carrot and cabbage) harvested from two separate locations (Dakace, largely an industrial and Jushi, predominantly residential and commercial) in the Kubanni-Galma River Basin of the Zaria metropolitan region, Nigeria. The results obtained showed that soil Cd levels dropped with increasing depth and distance towards the basin's downstream. Jushi's carrot crop had higher mean Cd values, whereas Dakache's cabbage crop had a higher mean Cd value. A significant linkage was found between the metal's concentration in the soil and that in the crops. The area's soil and crop samples were found to contain levels of the metal that exceeded the maximum permitted limits for public health. Steps need to be taken to stop Cd from building up in the soils and crops in the area, especially in the food grown on the soils and eaten by most of the people in the area.
Keywords
Cadmium toxicity, Heavy metal, pollution, Wastewater use, Irrigation
Introduction
Cd is a trace element that is harmful to both humans and the environment, and it is not needed at all for crops ‘growth [1]. Among the top 20 toxins, Cd is classified as No. 7 and also categorised as belonging to Group 1 human carcinogen [2]. Renal, skeletal, and respiratory systems are all adversely affected by Cd's toxicity in the human body system. Unfortunately, many creatures that are important in human food chain, such as mollusks and crustaceans, readily acquire the metal [3,4]. Health problems such as renal failure, lung illness, and osteoporosis can occur in people who are regularly exposed to soils and crops contaminated with Cd because of the metal's detrimental effects on the kidney, skeletal, and respiratory systems.
The toxicity of Cd can significantly impair the performance of crops, with serious obstacles to achieving food security. Alterations in photosynthesis, stomatal movement, enzyme activity, and water relations are only some of the impacts it has on plant’s development. It also affects mineral absorption, protein synthesis, and membrane function. At low concentrations, Cd had a toxicological impact on plants, particularly on seed germination and development, as found out in studies by Hernandez, et al. [5]. It was also observed by Das, et al. [6] that Cd impeded the root's ability to absorb calcium, potassium, magnesium, and iron, as well as further transport of these elements to other sections of the plant. Additionally, studies have shown that it also causes disruption in plant cell's water balance by altering cell wall permeability, which resulted in a great loss of water in the cell; inhibited the activity of the nitrate reductase enzyme, resulting in an inability to uptake nitrate from the root; and reduced the ability of root nodules to take up ammonium and nitrogen [7,8]. Toxic levels of Cd have been discovered to change the metabolism of plants and a wide range of physiological and biochemical activities, as reported by Ekere, et al., [9,10]. Wildner and Henkel, observed that Cd disrupted cellular enzyme function by dislodging metal lipoxygenase activity and affecting lipid peroxidation. It was discovered that the metal decreased soil beneficial microorganisms, hence decreasing the amount of plant-available nutrients [11].
Important contributors to the release of Cd into the environment include a variety of urban activities, such as the disposal and recycling of trash, as well as farming that makes use of phosphate fertiliser and/or waste ash and biosolid amendments. One area of particular interest to the scientific community in this situation is the cultivation of urban floodplains, which is done in most cases to produce crops that are necessary to meet the nutrition needs of city people (particularly vegetables), and the use of wastewater that flows in urban streams to irrigate the soils. Urban floodplains are one area that is of particular importance. On the floodplains of rivers that drain cities, crops are grown with the help of wastewater, which happens to be a very important way to grow food to feed the teeming urban population in many areas [12].
There are four possible causes of Cd enrichment in soils under floodplain irrigation in metropolitan settings. To begin with, the untreated wastewater used to irrigate the soil might be contaminated by the diverse landuse regions it drains from (industrial, commercial, residential, service areas, etc.). Even when wastewater is treated, Cd removal is not always included in the treatment process. Another consideration is that soil formation in floodplains is mostly dependent on the weathering and deposition of sedimentary rocks with a high concentration of the trace element cadmium (Cd). Cd enrichment can occur when urban waste (e.g. biosolid or ash) is utilised in soil amendments because urban residents use various Cd-bearing products in their houses and commercial/industrial complexes [13]. Fourth, because the mineral material used to make these fertilisers contains some levels of Cd, the likelihood of Cd-enrichment increases dramatically when super-phosphate fertiliser is applied to promote crop growth [14,15]. For many areas, there are not enough researchers that specifically looked into the issue. Most of the researches that have been done were carried out in strict experimental settings (like greenhouses and experimental farms) rather than on farmers' fields, even though there are public health concerns with a food production system undertaken by such farmers in cities.
Following the above and utilising the Kubanni-Galma river basin in the Zaria metropolitan area of Nigeria as a case study, this research adds to our knowledge in this area. It is the goal of this research to determine the levels of Cd in carrot and cabbage crops and soils in the Kubanni-Galma basin of Zaria's metropolitan region. The soils are watered by wastewater that flows into the streams of the river basin. Ash from urban waste and cow dung are added to the soil along with superphosphate fertiliser to keep the soil fertile.
Materials and Methods
Study area
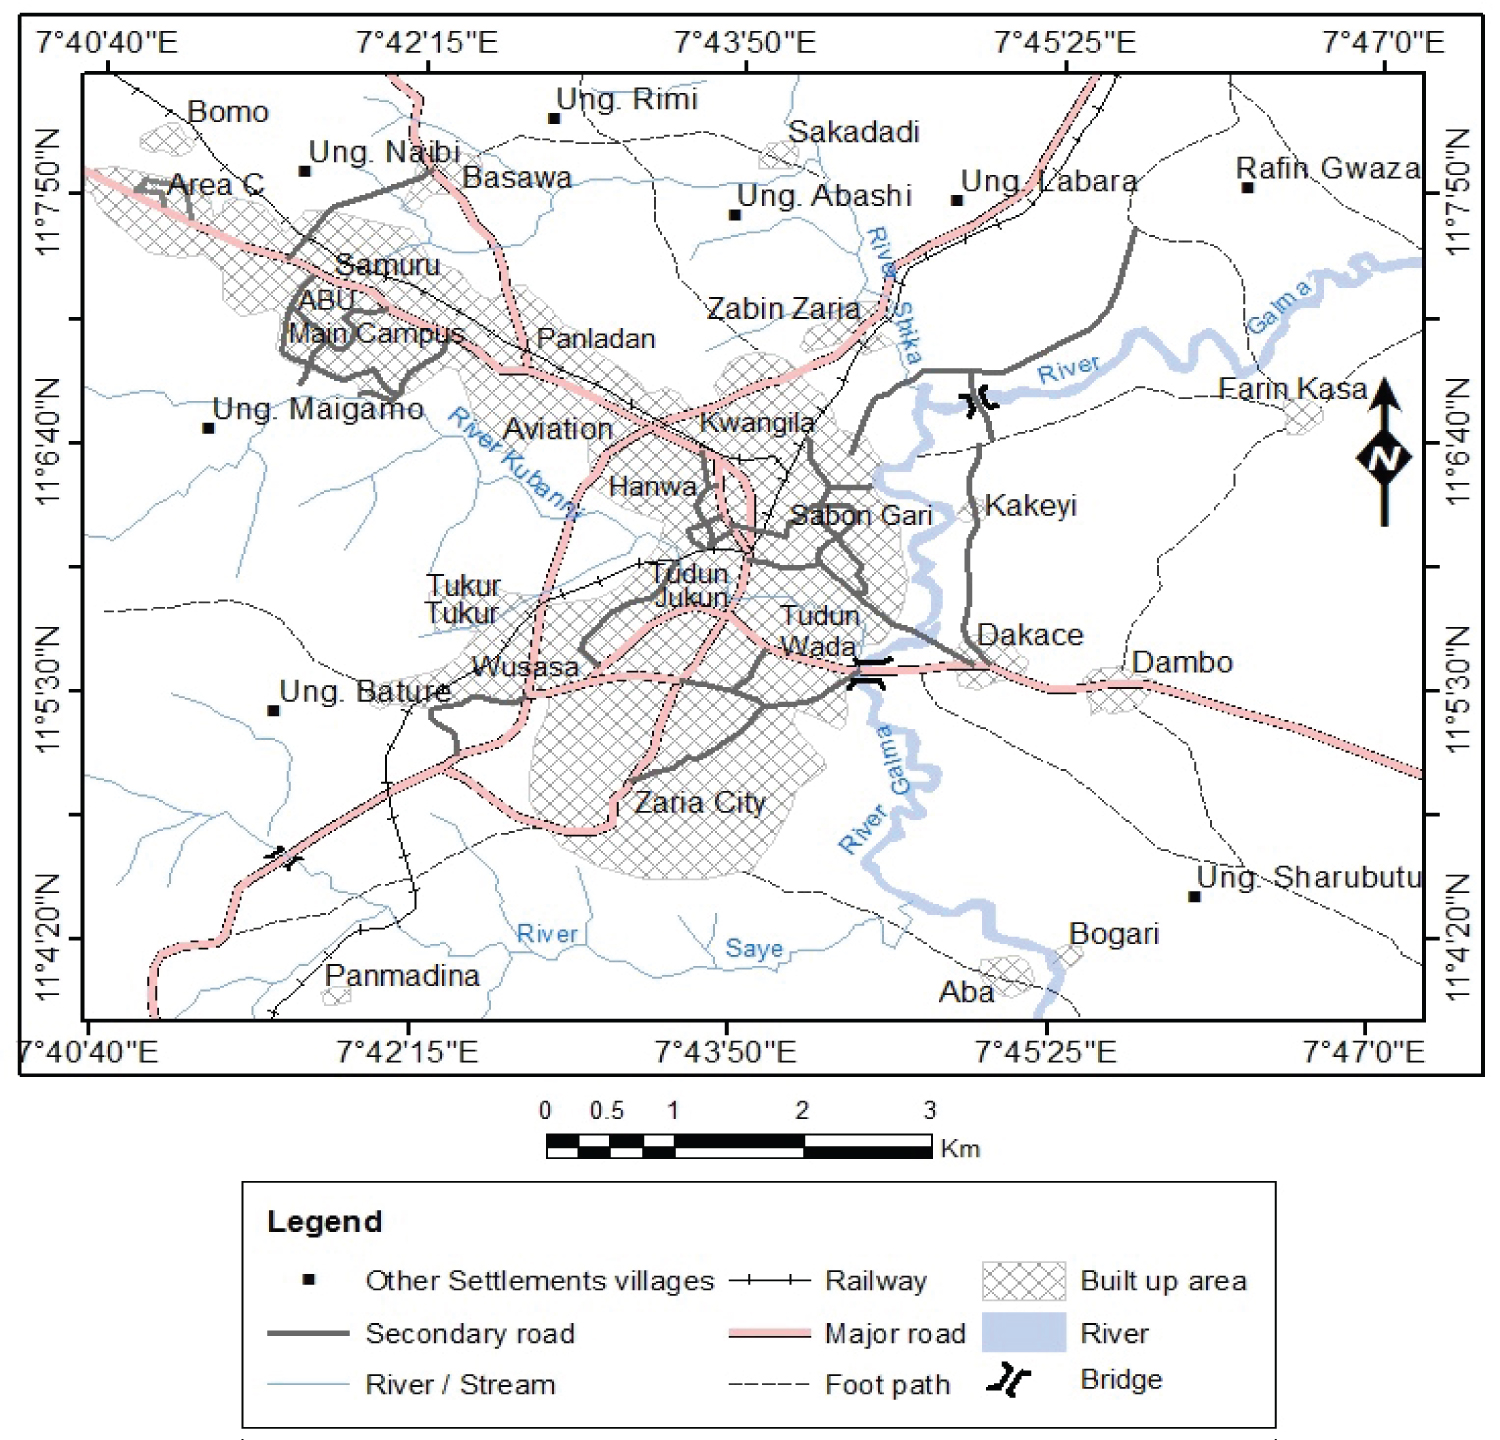
Zaria's urban area (Figure 1) is situated between latitude 11°02’ N and longitude 7° 38’ 30” E. With nine traditional districts (Basawa, Birni Da Kewaye, Dutsen Abba; Sabon Gari; Gyallesu; Tudun Wada; Tukur Tukur; Hanwa; and Wuchichiri), is one of Nigeria's most developed towns and a hub connecting important cities in the north and south of the country. With a total area of 61 km 2 and an average elevation of 670m above sea level, the town is situated on a large undulating peneplain. Three significant rivers drain the region: the Galma, the Kubanni, and the Saye. These rivers have erratic flow patterns due to the frequent occurrence of heavy rains, but River Galma is the only one that flow year-round and the other two are seasonal.
As a result, there is an abundance of vegetables grown in the floodplain of the Galma River during the dry season. Farmers, input suppliers, farm workers, and producers and marketers all benefit from the floodplain food production that occurs along the River Galma, which is a key source of income for the town's residents. In order to guarantee they have adequate water to irrigate their fields, farmers dig shallow wells along the banks of the river. Based on our conversations with the farmers, it appears that this strategy is being used both to provide long-term irrigation water availability and to filter wastewater as it seeps into the shallow wells. Between May and September/October, the region receives an average of 1040 mm of rain during the course of around 90 days. At night, the NE trade wind may bring temperatures down to as low as 10 °C, but during the afternoon, temperatures can sometimes reach as high as 42° degrees Celsius. There is an average year-round temperature of roughly 27 °C in the region.
The area has highly leached ferruginous tropical soils, developed on weathered regolith and overlain by very thin layers of sand and silt. Other types of soil include hydromorphic soils, also known as Fadama soils, formed on alluvial materials along flood plains and are rich in clay; soils created on meta-sediments, also known as schists and quartzites; and soils developed on granite. In terms of nutrients and water retention, Fadama soils are excellent for heavy irrigated cultivation. Due to the low activity of clay particles, other soils in the region are typically low in organic matter and nitrogen, Cation Exchange Capacity (CEC), and exchangeable bases, and are generally neutral in reactivity with profiles that are less than 150 cm in depth.
Reconnaissance survey and selection of suitable experimental sites
A reconnaissance survey of the research region was conducted to locate and choose acceptable study locations. Information such as the varying sizes of the cultivated fields, the history of land tenure, the kind of land tenure, the cropping types and techniques, and the usage of farming inputs such as fertiliser, manure, pesticide, and seeds are some examples of the information that was collected during the survey. However, wastewater-based irrigation practices were found to be used primarily for the cultivation of lettuce, cabbage, and carrots, with municipal solid waste (which is transformed into waste-ash through sorting and burning) and cow dung being used as the main fertility maintenance measures, to complement applications of inorganic compound (NPK) and superphosphate fertilisers.
Farmer selections were made at two distinct points along the Kubanni-Galma river system once the survey was completed. Farmers were chosen based on their past history of input utilisation and crop pattern stability. The farmers' names, residences, and cell phone numbers were recorded so that they could be easily traced. These farmers' farms provided samples of soil and crops for analysis. Ten farmlands were chosen, five of which were in Dakace and the other five were in Jushi.
Samples’ collections
The size of the farms owned by the farmers included in this study ranged from 0.3 ha to around 1.5 ha. A 20m × 20m quadrant was picked from each cropland to guarantee that soil sample collection techniques were consistent. The researchers were able to do this by splitting each quadrant into four equal halves, each of which was 5m in length. Using a soil auger, soil samples were taken at 0-15 cm, 20-30 cm, and 40-50 cm depths at the midpoints of each grid square. Due to the depth of the roots of crops in the region, soil samples were taken at 45 cm depths for soil sampling. As such, comparability between farms will be achievable provided samples are taken at the same depth on each farm as well. Samples of the two primary crops grown in the area were harvested straight from the specified field. Cabbage ( Curbita amaranthus ) and carrot ( Darcus carota ) were the main crops. The soil and crop samples that were obtained from each sampling station were placed inside sterile polythylene bags. These bags were then sealed, tagged, and labelled before being transported to the laboratory for analysis within five hours of when the samples were collected. It was made sure that the right steps were taken to keep soil samples from being mixed together from different depths.
Soil sample digestion
The processes for extracting DTPA (diethylenetriamine pentacetic acid) from soil samples were used to digest the soil samples. This approach was followed in order to determine the amounts of cadmium that are accessible to plants. In the laboratory, the various collected soil samples were first air-dried, and then 1g sub-samples were extracted from each dried sample for analysis. After that, the subsamples were digested with 20 cm 3 of 1:1 nitric acid, and the resulting digested sample was heated to boiling on a laboratory burner until its volume was decreased to 5 cm 3 . The digested sample was then given an addition of 20 cm 3 of distilled water before being subjected to a vigorous boil until the volume was decreased to 10 cm 3 . After that, it was allowed to cool down and then filtered before being topped up with distilled water to the volumetric flask's mark of 50 cm 3 .
Crop sample digestion
4.5.
A subsample of each crop sample weighing 3 grammes was digested using 20 cm 3 of a combination of nitric acid and hydrogen peroxide with a volume ratio of 1:1 (v/v), which had been newly generated for the examination of the crop samples. It was done by diluting the digested samples with distilled water to the desired volume. The mixture was heated in a steam bath before cooling to ensure dryness. Another 10 cm 3 of concentrated nitric acid and 10 cm 3 of concentrated hydrochloric acid were used to complete the operation. Following digestion, the sample was heated with 13 cm 3 of molar hydrochloric acid in order to dissolve all of the salts. After filtering the mixture, distilled water was added to bring the level in a volumetric flask to 25 cm 3 .
Analyses of the samples
The atomic absorption spectrometer (AAS) model Shimadzu AA-6200 was used to measure the concentrations of Cd in the digested soil and crop samples. 228.8 nm wavelengths and slit sizes of 0.7 nm were used. Linear calibration curves for the metal were made with regression coefficients (r) of 0.9998.
Statistical analysis
Data from soil and crop sample laboratory analyses were quantitatively analysed to provide statistical summaries of the minimum, maximum, mean, standard deviation, and coefficient of variation (%). To test for skewness, we used the Shapiro-Wilk normality test (P 0.05) and found that the analytical data was non-normally distributed. The significance of the difference in mean Cd levels between the three sampling depths was evaluated using the Students' t-test approach. Also, it was used to evaluate the importance of the difference in mean metal levels between the two sample locations. The significance of the link between soil and crop Cd levels was then evaluated using the product moment correlation test. Statistix 8 for Windows (Analytical Software, Tallahassee, FL 32317, USA) statistical software was used to do the analyses.
Results and Discussion
Cd concentration in soil samples
The mean Cd concentration at Dakace for 0-15 cm, 20-30 cm, and 40-50 cm soil layers was 3.05 mg/kg, 2.85 mg/kg, and 1.65 mg/kg, respectively (Table 1). At Jushi sampling sites, the mean values for the three layers were 4.05 mg/kg, 3.66 mg/kg and 3.00 mg/kg, respectively. These show that the values of the metal decreased with an increase in soil depth, which is expected given that the upper layer has more biological activity and more direct contact with contamination sources like application of municipal solid waste, fertiliser and irrigation water, which are among the major sources of Cd pollution in soils [16].
The property also exhibits very low coefficient of variation values in both locations. In tropical soils of low activity clays, organic matter is the main soil colloid influencing the availability of elements in soils, and the mean Cd values were consequently higher in the upper soil layer where organic activities are more prominent. The values of the metal are higher at Jushi, which is a location within the upstream of the Kubanni-Galma river system, than at Dakace, suggesting that the pollution problem decreases towards the downstream location.
Cd level in crop samples
At the Dakace sample location, the mean Cd concentration in the carrot crop was 0.63 mg/kg, while the value ranged from 0.61 mg/kg to 1.34 mg/kg (Table 2). It ranged from 1.12 mg/kg to 3.23 mg/kg at the Jushi sample location, with a mean concentration of 1.27 mg/kg at that location. In the case of the cabbage crop, the mean values at the Dakace sampling location ranged from 0.50 mg/kg to 2.20 mg/kg, with a mean of 1.05 mg/kg; while, at the Jushi location, it ranged from 0.70 mg/kg to 1.28 mg/kg, with a mean of 0.54 mg/kg. These indicated that the carrot has a greater Cd concentration than the cabbage crop in the Jushi sampling location. However, in the Dakace sample location, the metal content of cabbage has higher mean values than that of carrots, despite the fact that the coefficient of variation at the Dakace location is quite large.
The mean Cd values recorded in crop samples for this study are much higher than those reported in the majority of other studies [17-20]. For instance, Qadir, et al. [17] found out that the mean Cd levels in the leaves and fruits of several crops irrigated with untreated city sewage in Pakistan were 0.19 mg/kg and 0.08 mg/kg, respectively. These values were found in the leaves and fruits. As reported by Li, et al. [19], rice ( Oryza sativa L. ) grain grown on soils with pH values of 4.95 and 6.54, respectively, was found to have mean concentrations of 0.36 mg/kg and 0.43 mg/kg. This research was conducted in China. In greater Sydney, Australia, Jinadasa, et al. [21] found that in leafy vegetables grown on soils with Cd levels ranging from 0.11 to 6.37 mg/kg (mean: 1.33 mg/kg) and background soil values of 0.36 mg/kg, Cd has accumulated at levels of 0.75 mg/kg, which was about 25 percent higher than the MAC limits that are permitted in the country. Rusin, et al. [20] found that vegetable crops such as carrots, apples, pears, raspberries, and strawberries that were sold in Polish market places had Cd levels that ranged from 0.036 mg/kg to 0.161 mg/kg. Sánchez-Camazano, et al. [22] observed Cd concentrations of 0.020-0.095 mg/kg in vegetables produced in urban gardens in Salamanca (Spain) which were reported to have surpassed the mean concentration of the metal in natural and cultivated soils by a factor of 2.04. found levels of Cd ranging from 0.01 mg/kg to 7.54 mg/kg in Tehran (Iran), while the levels in crops grown on contaminated soils ranged from 0.398 mg/kg to 1.437 mg/kg.
However, comparable findings were made in Lagos, Nigeria by Yusuf, et al. [23], who measured Cd levels in five different edible vegetables at values ranging from 1.13 mg/kg to 1.67 mg/kg. As was mentioned earlier, the fact that the crop samples in the study region had significantly higher Cd levels than those in the majority of other places is likely a reflection of three primary variables. First, according to the findings of the research, a significant amount of urban waste is used in the process of amending the soil. The solid component of the waste is directly used in soil treatment as biosolids, while the remaining components of the waste are burned and the ash is also used in the process of amending the soil. The second method that farmers employ to encourage the development of their crops is the widespread application of super-phosphate fertiliser. Thirdly, the wastewater that is used to irrigate the soils is derived directly from the Galma-Kubanni river channels. These river channels collect runoff from various landuse surfaces (residential, commercial, service areas, and industrial), which is where many activities that involve the use of Cd in many different forms take place. Because this water does not undergo any kind of treatment, the level of pollution that it carries is likely to be rather considerable. Fourth, animal dung is employed in soil fertility management, which promotes high organic matter buildup in the soils and enhances the bioavailability of cadmium in the soils. This is accomplished by the use of animal manure. It is anticipated that the presence of significant levels of Cd enrichment in the soils was brought about by these four variables. Even in countries with a lot of regulations, like Europe, it has been found that municipal solid waste (MSW) has between 0.3 and 12 mg/kg of cadmium and that the leachate from such waste has between 0.5 and 3.4 g/L of cadmium [24].
Comparison of mean soil Cd values between sampling locations
Compared to Dakace, average Cd levels at depths of 0-15 cm were lower in Jushi, while those at 20 and 30 cm were higher, as seen in Table 1. According to the findings of a t-test that compared the mean values of the metal, the differences between the sample depths are not statistically significant, but the disparities that exist between the two sampling sites are significant (Table 3). Although the mean Cd levels differed little between sample depths, there was a considerable variance between sampling locations. This lends credence to the hypothesis that the level of heavy metal contamination in wastewater-irrigated soils in the research region varies from one site to another, indicating that the contamination is not uniform. This change in quantities and types of human activities that contribute to heavy metal pollution in the region may be seen over time, as can be inferred from the spatial variation.
Metal accumulation in crops
Correlation analysis was used to compare levels of the metal in soil and samples of the two primary crops being cultivated to determine the amount of Cd building up in the area's irrigated crops (carrot and cabbage). According to the findings, there is a statistically significant link between the Cd levels of the soil samples and the crop samples (the correlation was r = 0.6705 for carrots and r = 0.4714 for cabbage). This implies that the carrot crop is more impacted by Cd pollution, and this may be a reflection of the fact that the crop, unlike cabbage, often immobilises large quantities of water in its growth processes. Additionally, this may be a reflection of the fact that carrot crops are more likely to be grown in areas with higher levels of Cd contamination. Alloway, et al. [25] states that the metal is easily taken up by plants, especially leafy greens, even when there is less of it in the soil.
Comparison of the soil Cd content with the maximum permissible limits
When it comes to determining how much cadmium should be allowed in soil, different nations have developed a variety of criteria that may be found in published works. According to Awashthi [26], the maximum levels of cadmium, copper, lead, cobalt, nickel, and zinc in agricultural soils in India were set at 135-270 mg/kg, 250-500 mg/kg, 300-600 mg/kg, 75-150 mg/kg, 3-6, and 300-600 mg/kg, respectively. In the European Union, the maximum acceptable concentration (MAC) limits in agricultural soils for copper (Cu), lead (Pb), cadmium (Cd), and chromium (Cr) were established in the European Union at 140 mg/kg, 300 mg/kg, 3 mg/kg, and 150 mg/kg, respectively [27]. The FAO/WHO (1984) proposed MAC limits of 100 mg/kg for Cu, Pb, and Cr; 50 mg/kg for Co and Ni; 3 mg/kg for Cd; and 20 mg/kg for As. The limits set by the Chinese State Environmental Protection Agency [28] were 100 mg/kg, 300 mg/kg, 50 mg/kg, and 0.6 mg/kg, respectively for Cu, Pb, Cr and Cd in agricultural soils. The MAC limit for Cd in several crops, including cereals, root, tuber, and stem vegetables, and legumes, was set at 0.10 mg/kg. When it comes to grain products, the maximum permissible concentration (MAC) was established at 0.20 mg/kg, while the maximum allowable concentration (MAC) was established at 0.05 mg/kg for vegetable and fruit products. Risk assessment for the study area's soils was simplified by employing a comparison of observed contamination levels to established recommendations in order to determine the amount to which they are polluted by the metal investigated. This strategy consisted of comparing the mean soil Cd levels throughout the two primary sampling locations from which soil samples were gathered for this study (i.e., Dakace and Jushi) with the mean values established by the EU. The EU was the only organisation that had standards set for both soils and crops.
The results of this investigation are shown in Table 4, which includes a comparison of the mean Cd concentrations found in the soil samples tested with the maximum permissible limits (MPLs) imposed by the EU. The table also compares mean Cd concentrations with those specified by Kabata-Pendias and Pendias [29]. The MAC values in agricultural soils supplied by Kabata-Pendias and Pendias [30] were also used to compare the mean values.
In soils, Cd concentrations range from 0.01 mg/kg to 1 mg/kg, with a global average of 0.36 mg/kg, according to Kubier, et al. [16]. It was stated by Akbar, et al. [31] that Cd levels above 3 mg/kg are commonly assumed to indicate that a soil is polluted. However, Baize and Sterckeman [32] and Kubier, et al. [16] demonstrated that concentrations above 3 mg/kg may be found even in soils that are not connected to anthropogenic pollution. In fact, values of as high as 10 mg/kg can be observed in soils that have been influenced by pedo. Garrett, et al. [33] found that soils with high Cd concentrations had weathered phosphorites from guano deposits through extensive weathering.
The findings presented in Table 4 make it abundantly evident that the levels of Cd that are present in the soils of the region are all significantly higher than the values that are typical for the majority of the world's soils. The values were well beyond the ECC's recommended range for sage crop cultivation which suggests that the irrigated soils of the study area are heavily polluted with Cd. Studies have shown that increased Cd bioaccumulation by crops receiving anthropogenic addition of the metal has led to increased daily Cd intake in nations such as China, Korea, and Jamaica. China's extensive use of nitrogen fertilisers, pollution from irrigation and atmospheric deposition, and the cultivation of rice with a high affinity for Cd accumulation have particularly been noted to have all contributed to major difficulties in soil and crop contamination [34-36]. Many other studies [37-40] have found that using untreated wastewater to irrigate crops results in heavy metal contamination of soil, which is consistent with this study's findings. It should be noted here that Cd pollution occurred in soils of the study area despite the fact that the farmers were not directly pumping the wastewater from the streams to their farms, but were using mechanical pumps to pump water from shallow wells dug along the banks of streams. According to the farmers' responses to an interview conducted with them, the primary goal of digging wells is to store water permanently and continuously so that it would be available for irrigation purposes. Besides ensuring that the water was not taken straight from the free-flowing effluent, this procedure also ensured that the ground had 'filtered' the water before it was used. It is very clear that the local strategy of letting the water be "cleaned" in some way by the earth through filtration does not help reduce the chance of Cd pollution in the area.
Conclusion
This research investigates the pollution of crops and soils in Zaria, Nigeria, that has been caused by the use of wastewater for irrigation purposes. As a result of the consistent application of wastewater in irrigating the soils, there has been a buildup of Cd in both the top and lower soil layers, which has led to a large accumulation of the metal in the crops of carrots and cabbage, the two of the most eaten vegetables in the area under investigation. In general, the mean values of the metal were greater at the Jushi site than at the Dakace location. The levels of the metal in both the soils and the crops are all above the permissible limits, which raises a great deal of public health concerns regarding the consumption of the two crops that are being produced in the region. Consequently, it is necessary to take steps that will result in a lower concentration of the metal in crops and soils in the area. Because it may not be possible to implement an immediate ban on the production and consumption of the two crops in the region, there is a necessity to take actions that will help reduce the level of contamination in the area. These actions include adopting measures that will help reduce the extent of the contamination, and two courses of action are suggested here. The first step is to start growing low-Cd-accumulating crop types to replace the ones that are now being grown. It has been demonstrated by Rizwan, et al. [41] that the cultivation of low Cd-accumulating vegetable cultivars, in conjunction with insolubilizing additives and correct agricultural techniques, is a highly beneficial strategy for minimising the amount of Cd that is exposed through the food chain. The second option is to treat the soils in the region with ameliorative chemicals in the hope that this would help reduce the amount of Cd pollution in the soils. In this context, it is possible to experiment with a number of different bioremediation and phytoremediation techniques that are described in by various researches in the literature. According to Bravo and Braissant [42], the introduction of organic in addition to inorganic Cd-level lowering amendments can be of tremendous assistance in significantly reducing the degree to which a soil is polluted with the metal. According to the findings of Yuan and colleagues [43], adding a significant quantity of organic matter to soil can help reduce the amount of cadmium pollution present in the soil. It is also proposed in this context that investigations need to be undertaken by plant breeders in order to find crop cultivars that may be planted in order to minimise the amount of cadmium that is mobilised in the region. It has long been recognized by Grant, et al. [44] that this type of crop breeding has a very high potential for addressing Cd pollution in soils and crops. Continuous monitoring is required in order to determine the extent to which any ameliorative measure employed in the study area help in reducing Cd pollution in soils and crops.
References
- WHO (World Health Organisation) (2012) Preventing Disease through Healthy Environments Exposure to Cadmium: A Major Public Health Concern. Public Health and Environment World Health Organization 20 Avenue Appia, 1211 Geneva 27, Switzerland.
- Chaney RL, Ryan JA, Li Y-M, et al. (1999) Soil cadmium as a threat to human health. In: McLaughlin, MJ, Singh BR, Cadmium in Soils and Plants. Kluwer Academic Publishers, Dordrecht, 219-256.
- Hasan SA, Fariduddin Q, Ali B, et al. (2009) Cadmium: toxicity and tolerance in plants. J Environ Biol 30: 165-174.
- Irfan M, Ahmad A, Hayat S (2014) Effect of cadmium on the growth and antioxidant enzymes in two varieties of Brassica juncea. Saudi J Biol Sci 25: 125-131.
- Hernandez LE, Carpena-Ruiz R, Garate A (1996) Alterations in the mineral nutrition of pea seedlings exposed to cadmium. J Plant Nutr 19: 1581-1586.
- Das P, Somantary S, Rout GR (1997) Studies on cadmium toxicity in plant: a review. Environ Pollut 98: 29-36.
- Balestrasse KB, Gallego SM, Tomaro ML (2004) Cadmium-induced senescence in nodules of soybean (Glycine max L.) plants. Plant and Soil 262: 373-381.
- Shanying HE, Yang X, Zhenli HE, et al. (2017) Morphological and physiological responses of plants to cadmium toxicity: A review. Pedosphere 27: 421-438.
- Ekere NR, Ugbor MCJ, Ihedioha JN, et al. (2020) Ecological and potential health risk assessment of heavy metals in soils and food crops grown in abandoned urban open waste dumpsite. J Environ Health Sci Eng 18: 711-721.
- Wildner GF, Henkel J (1979) The effect of divalent metal ions on the activity of Mg ++ depleted ribulose-1, 5-bisphosphate oxygenase. Planta 146: 223-228.
- Moreno JL, Hernandez T, Garcia C (1999) Effects of a cadmium-containing sewage sludge compost on dynamics of organic matter and microbial activity in an arid soil. Biol Fertil Soils 28: 230-237.
- Badami MG, Raman Kutty N (2015) Urban agriculture and food security: A critique based on an assessment of urban land constraints. Glob Food Sec 4: 8-15.
- Pasquini MW, Harris FMA (2005) Efficient use of resources: Urban waste ash and soil fertility on the Jos Plateau, Nigeria. Area 37: 17-29.
- Roberts TL (2014) Cadmium and phosphorous fertilizers: the issues and the science. Procedia Engineering83: 52-59.
- McDowell RW, Gray CW (2022) Do soil cadmium concentrations decline after phosphate fertiliser application is stopped: A comparison of long-term pasture trials in New Zealand? Sci Total Environ 804: 150047.
- Kubier A, Wilkin RT, Pichler T (2019) Cadmium in soils and groundwater: A review. Appl Geochem 108: 1-16.
- Qadir M, Ghafoor A, Murtaza G (2000) Cadmium concentration in vegetables grown on urban soils irrigated with untreated municipal sewage. Environment, Development and Sustainability 2: 11-19.
- Baldantoni D, Morra L, Zaccardelli M, et al. (2016) Cadmium accumulation in leaves of leafy vegetables. Ecotoxicol Environ Saf 123: 89-94.
- Li C, Zhou K, Qin W, et al. (2019) A review on heavy metals contamination in soil: effects, sources, and remediation techniques. Soil Sediment Contam 28: 380-394.
- Rusin M, Domagalska J, Rogala D, et al. (2021) Concentration of cadmium and lead in vegetables and fruits. Nat Sci Rep 11: 11913.
- Jinadasa KBPN, Milham PJ, Hawkins CA, et al. (1997) Survey of cadmium levels in vegetables and soils of greater Sydney, Australia. J Environ Qual 26: 924-933.
- Sánchez-Camazano M, Sánchez-Martín MJ, Lorenzo LF (1994) Lead and cadmium in soils and vegetables from urban gardens of Salamanca (Spain). Sci Total Environ 146-147: 163-168.
- Yusuf AA, Arowolo TA, Bamgbose O (2003) Cadmium, copper and nickel levels in vegetables from industrial and residential areas of Lagos City, Nigeria. Food Chem Toxicol 41: 375-378.
- UNEP (United Nations Environment Programme) (2010) Final Review of Scientific Information on Cadmium. UNEP 201.
- Alloway BJ, Thornton I, Smart GA, et al. (1988) Metal availability. Sci Total Environ 75: 41-69.
- Awashthi SK (2000) Prevention of food adulteration Act no 37 of 1954. Central and State Rules as amended for 1999, Ashoka Law House, New Delhi.
- EU (The European Union) (2006) Commission Regulation (EC) No. 1881/2006 of 19 December 2006 Setting Maximum Levels for Certain Contaminants in Foodstuffs. Off J Eur Uni L364/5.
- SEPA (State Environmental Protection Administration of China) (1995) Environmental Quality Standards for Soils (GB15618-1995).
- Kabata-Pendias A, Pendias H (1992) Trace Elements in Soils and Plants. (2 nd edn), CRC Press, London, 413.
- Kabata-Pendias A, Pendias H (2001) Trace Elements in Soils and Plants. (3 rd edn), CRC, New York, 10-20.
- Akbar KF, Hale WHG, Headley AD, et al. (2006) Heavy metal contamination of roadside soils of Northern England. Soil Wat Res 1: 158-163.
- Baize D, Sterckeman T (2001) Of the necessity of knowledge of the natural pedo-geochemical background content in the evaluation of the contamination of soils by trace elements. Sci Total Environ264: 127-139.
- Garrett RG, Porter ARD, Hunt PA, et al. (2008) The presence of anomalous trace element levels in present day jamaican soils and the geochemistry of late-Miocene or Pliocene phosphorites. Appl Geochem 23: 822-834.
- Sebastian A, Prasad MNV (2014) Cadmium minimization in rice: A review. Agron Sustain Dev 34: 155-173.
- Yang YJ, Xiong J, Chen RJ, et al. (2016) Excessive nitrate enhances cadmium (Cd) uptake by up-regulating the expression of OsIRT1 in Rice (Oryza sativa). Environ Exp Bot 122: 141-149.
- Chen HP, Tang Z, Wang P, et al. (2018) Geographical variations of cadmium and arsenic concentrations and arsenic speciation in Chinese rice. Environ Pollut 238: 482-490.
- Liu WH, Zhao JZ, Ouyang ZY, et al. (2005) Impacts of sewage irrigation on heavy metal distribution and contamination in Beijing, China. Environ Int 31: 805-812.
- Hussain SI, Ghafoor A, Ahmad S, et al. (2006) Irrigation of crops with raw sewage: hazard assessment of effluent, soil and vegetables. Pakistan J Agric Sci 43: 97-102.
- Liu YZ, Xiao TF, Perkins RB, et al. (2017) Geogenic cadmium pollution and potential health risks, with emphasis on black shale. J Geochem Explor 176: 42-49.
- Liu C, Chang C, Fei Y, et al. (2018) Cadmium accumulation in edible flowering cabbages in the Pearl River Delta, China: critical soil factors and enrichment models. Environmental Pollution 233: 880-888.
- Rizwan M, Ali S, Adrees M, et al. (2017) A critical review on effects, tolerance mechanisms and management of cadmium in vegetables. Chemosphere 182: 90-105.
- Bravo D, Braissant O (2021) Cadmium-tolerant bacteria: current trends and applications in agriculture. Lett Appl Microbiol 74: 311-333.
- Yuan C, Li Q, Sun Z, et al. (2021) Effects of natural organic matter on cadmium mobility in paddy soil: A review. J Environ Sci (China) 104: 204-215.
- Grant CA, Sheppard SC (2008) Fertilizer impacts on cadmium availability in agricultural soils and crops. Hum Ecol Risk Assess 14: 210-228.
Corresponding Author
Sani Abubakar Mashi, Department of Geography & Environmental Management, University of Abuja, PMB 117, Abuja, Nigeria, Tel: +234-80-99991919.
Copyright
© 2023 Sani S, et al. This is an open-access article distributed under the terms of the Creative Commons Attribution License, which permits unrestricted use, distribution, and reproduction in any medium, provided the original author and source are credited.