Carbon Footprint of Food Waste in Classified Star Hotels in Nairobi City County, Kenya
Abstract
The global goal to obtain food security is hampered by the most salient yet mostly ignored global food waste and losses. This situation is in total contravention of target 3 of the Sustainable Development Goals 12. The study's general objective was to assess the carbon footprint of food waste in classified star hotels in Nairobi City County. Specifically, the study was designed to determine the amount of greenhouse gas emissions from food waste produced in the classified star hotels. The Systems Theory formed the theoretical foundation of the study. A descriptive survey design based on a mixed-method approach correlated food waste with climate change. The results revealed that (83.33%) of the hotels wasted an estimated volume of 11-30 kg food daily, averagely translating to 27.5-75 kilogram of CO 2 equivalent emitted into the atmosphere daily. The study concluded that greenhouse gases emitted daily contribute to climate change. As such, the study recommends that Classified Star Hotels should partner with government agencies and other stakeholders such as NEMA, EIK, NGOs, local business communities, and the county government to come up with better policies and waste management frameworks to guide and promote waste composting systems, waste for energy technology, reuse and recycling of food waste generated from the hotels. Given the initial results and findings, the study suggests that future research should be conducted on the mitigation strategies that foodservice industries can easily adopt to reduce the amount of food waste generated.
Keywords
Food waste, Food loss, Carbon footprint, Greenhouse gases, Waste management, Climate change
Introduction
According to Lundqvist, de Fraiture, & Molden [1], the plan to increase food production cannot be easily achieved due to the various factors limiting food production, including food loss and waste. Food waste is an environmental issue that has significant economic and social consequences, especially in developing countries such as Kenya. It is estimated that food waste accounts for up to 10% of all greenhouse gas (GHG) emissions globally. Furthermore, food waste in hotels contributes to additional environmental problems such as landfills, water pollution and soil degradation.
In 2014, FAO reported that close to 805 million people representing one in nine, suffer from chronic malnutrition worldwide. Such a condition worsened in sub-Saharan Africa, where one out of four persons was chronically ravenous [2-4]. A similar report in 2018 indicates that 821.6 million people are undernourished globally. Similarly, the FAO's global report on food crises suggested that over 113 million people interspersed across 53 nations witnessed an acute hunger that requires urgent food, nutrition, and livelihoods assistance [5].
In Kenya, annual estimates of food wastage and loss run to more than 72 billion shillings. A report on creating awareness about food waste and loss and sustainable solutions by FAO [6] approximates that 30% of the food is lost and wasted by Kenyan farmers from harvest to the point of sale. According to Global [7], food waste, especially in the horticultural sector, is occasioned by cosmetic specifications, cancellations and adjustments to last-minute forecasts, which results in high financial loss and impacts the environment regarding GHG emissions.
Problem and objective statement
Nairobi is a vibrant city with a thriving hospitality industry. The tourism sector plays a significant role in the city's economy, with many hotels and restaurants catering to domestic and international visitors. Nairobi has over 250 hotels, many of which are of international standard. These hotels provide a wide variety of cuisines that are often prepared in large quantities to meet the demand of their guests. Therefore, the potential for food waste in these establishments is high. When hotels waste food, they are also wasting significant resources, energy, and money on purchasing the food, water and labor for processing, preparing and cooking, and disposing of the food.
The carbon footprint of food waste in hotels in Nairobi is substantial. An estimated 20-30% of all food is wasted in these hotels, which equates to approximately 20,000 tonnes per year. The disposal of food waste contributes to GHG emissions through the release of methane gas as it decomposes in landfills. The carbon footprint of food waste in Nairobi hotels therefore depends on the disposal method used. If food waste is disposed of through landfill, the CO 2 equivalent emissions are 1.38 kg per kg of wasted food. On the other hand, if food waste is composted, the CO 2 equivalent emissions are significantly reduced to 0.11 kg per kg of food waste.
In this regard, addressing food waste in the hotel sector is an essential prerequisite for the economic growth of the hotel sector since it can reduce hotels' Greenhouse gas emissions and carbon footprint, as well as their entire water and ecological footprint. Therefore, the objective of this study was to determine greenhouse gas emissions from food waste at classified star hotels. The indicators used to realize this objective included: The estimated distance in kilometres between the point of purchase and the hotel facility; the estimated distance from the hotel facility to the landfill; the quantity of food waste from the hotel facilities; and the estimated daily energy consumption to prepare food in classified star hotels.
Literature Review
Carbon footprint is described as a quantitative measure of the volume of greenhouse gases (GHG) imposed by the activities of humankind with regards to Carbon IV oxide (CO 2 ), Methane (CH 4 ), and Nitrous oxide (N 2 O) and their impact on global environmental sustainability [8-10]. Generally, carbon footprints are measured using the Life-Cycle Assessment (LCA), otherwise called "cradle-to-grave analysis" [11]. The LCA estimates the total emissions and resources used early in the production process to manufacturing, use and disposal [12,13]. According to Meier, Stoessel, Jungbluth, Juraske, Schader, et al. [14] carbon footprints are the life-cycle GHGs of entities such as nations, companies, individuals or products. The current study's primary interest is the carbon footprint of food waste in relation to GHGs using caveats from the data analysed in the classified star hotels in Nairobi City County.
The Carbon Footprint of Products Declaration, which gave rise to the ISO/TS 14067 - a standard for quantifying the carbon footprint, monitoring and tracking the progress of GHG mitigation potential of a product - focuses on the impact assessment of climate change with greater emphasis on concise communication [15,16]. Other initiatives include Japan's Carbon Footprint System, whose sole aim is to provide information on the emissions of GHGs produced over a product's life cycle [17,18]. These initiatives are intended to halve the 10-30 per cent GHG emissions from food products resulting from agricultural practices such as fertiliser use and nitrogen fixation in leguminous crops by 2030 as stipulated by target 12.3 of the SDG 12 (Center for Sustainable Systems).
Various initiatives have been undertaken regarding the carbon footprint of products, which is equally called Global Warming Potential (GWP). Food has been at the centre of these developments [19]. These initiatives are PAS 2050, Carbon Footprint of Products Declaration, and Japan's Carbon Footprint System. PAS 2050 mainly supports the calculation of specific Product Carbon Footprint (PCF).
Jóhannesson, Heinonen, & Davíðsdóttir [20] attempted to evaluate the accuracy of the data used to calculate carbon footprint because of the numerous criticisms that have been made of the ecological footprint of products. These criticisms centre on the use of estimates and averages to calculate ecological footprints, which results in the discrepancies that arise in both local and international databanks. The study revealed that stating any given number as the carbon footprint at any given time is misleading, resulting in a lack of data accuracy. Moreover, the lack of accuracy may be related to the fact that the Global Footprint Network (GFN) operates as a think tank that actively encourages the use of ecological footprints. They also serve as the largest research organization globally which employs the methodology. This study, against this backdrop, sought to calculate the carbon footprint of food waste using caveats from results emanating from the data analysed in the classified star hotels in Nairobi City County.
The scientific community globally posits that products from livestock have high carbon footprints [21]. However, scholars from Cranfield University sought to support the initial standpoint by offering a contemporary perspective on the global position. Pagnanelli & Borges-Neto [22] conducted a comprehensive LCA of the main agricultural products in the United Kingdom. Their research aimed to estimate the overall carbon footprint of the United Kingdom's food consumption. The full life-cycle of all major food supply chains in the United Kingdom, from agricultural inputs to domestic refrigeration and food preparation, had been covered. Their estimated result indicated that 20% of emissions came directly from the food system -which is an equivalent of 152 million tonnes of carbon dioxide or 6.8 kg CO 2 per person per day - out of the approximated total of 748 million tonnes of carbon footprint in the UK which equates to roughly 12 tonnes per person each year. Their findings also demonstrated that UK meat and milk have a carbon footprint that is equally higher than plant-based foods. The researchers in this study failed to include the food waste's carbon footprint within the life-cycle assessment, hence the need for this study.
A similar study by Röös [23] examined the carbon footprint of food products to help design an efficient consumer strategy in Sweden. The study adopted an uncertainty carbon footprint in the range of ±10-30%, which indicated that the carbon footprint uncertainty for foods that do not have a specific origin is considerably higher. The study revealed that the N 2 O emissions from soils prevailed over emissions and uncertainties; hence the determining factor for all crops was the yield. It was also revealed that the obstacles recognised to prevent the purchasing of organic foods (e.g. perceived high prices and a healthy lifestyle) equally apply to purchasing labelled products with a carbon footprint. The study concluded that labelling the carbon footprint of food at the retail level is limited. However, the results indicated that the CF values are critical in developing policy, communication in the business setting, and the development of scientifically efficient and justified consumer messages for communication.
Materials and Methods
Study area
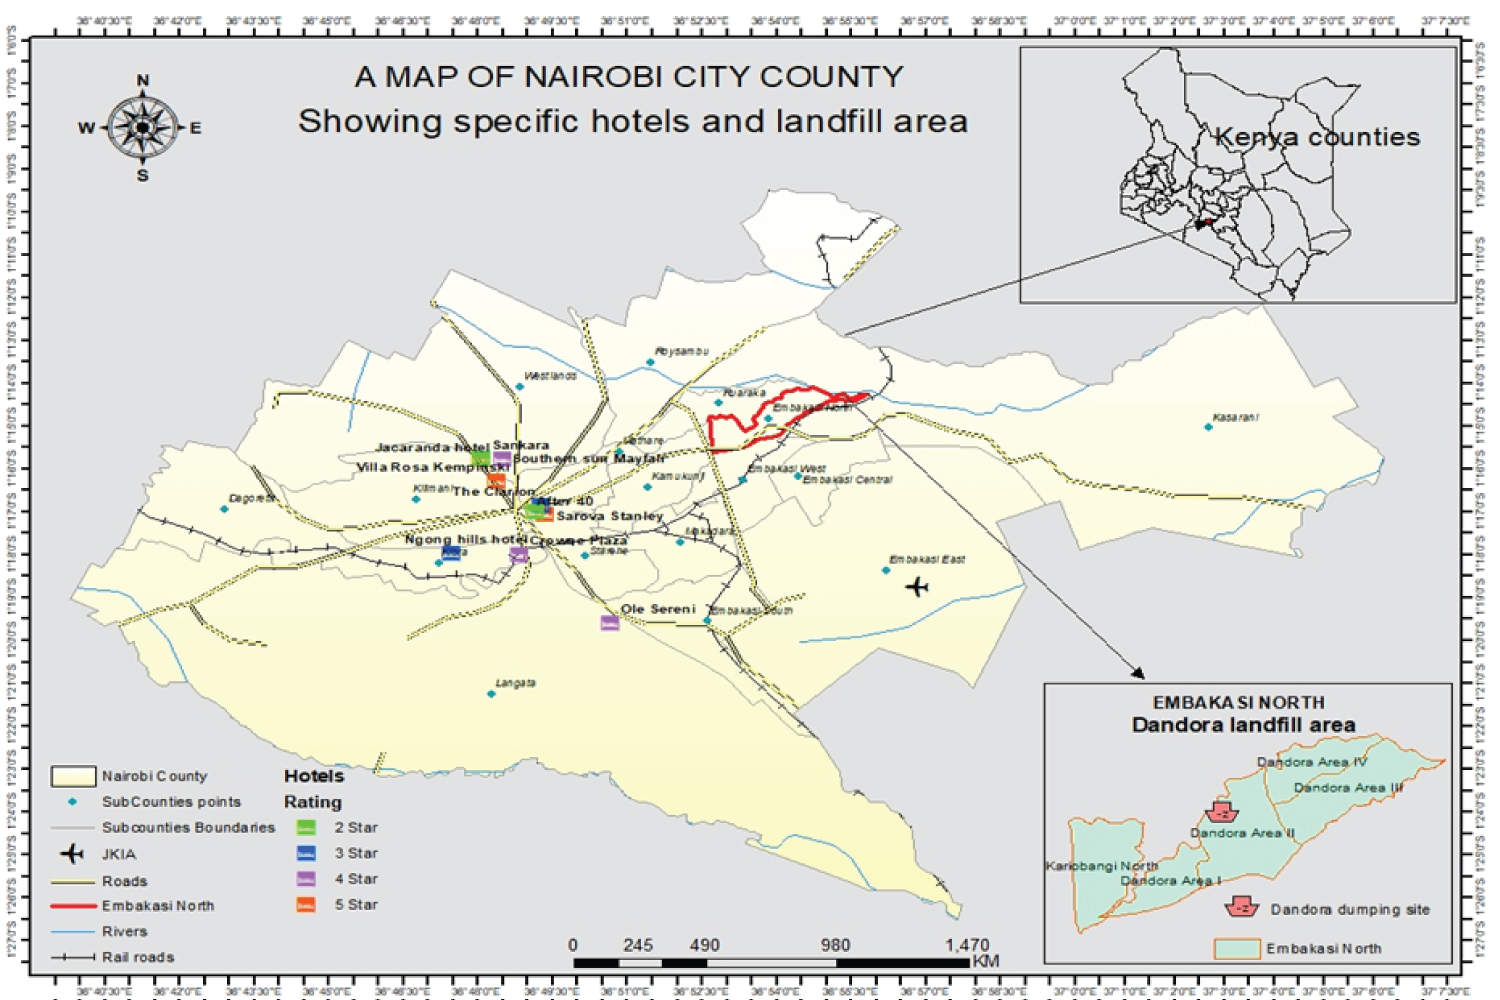
Nairobi is the capital of Kenya, with its location in the southern centre of the country, on a high plateau of about 5500 feet (1680 meters). Nairobi is located 480 km northwest of Mombasa, Kenya's most important port city on the Indian Ocean. Nairobi is among the few cities globally that have a national park within its boundaries, making it a tourist destination of choice and several other tourist attractions. There are numerous hotels in Nairobi, including 5-star, 4-star and 3-star luxury hotels. Twenty-eight (28) of these hotels will be used for the purpose of this study (Figure 1).
Research methodology and design
Systems theory has been adopted as the theoretical foundation and guiding principle for assessing the carbon footprint of food waste in star hotels in Nairobi County, Kenya. The Systems Theory was advanced. It stems from the principle that real systems are open to and interact with their environments and acquire new properties through emergence, resulting in continual evolution. The Systems theory is important and relevant in this study since it allows for an in-depth understanding of the interactions, inter-dependability and interconnections among the different parts of the ecological systems which contribute to the changes in global climate. As such, reducing food loss and waste in the star hotels in Nairobi City County will reduce greenhouse gas emissions, thereby mitigating climate change.
A mixed research approach was employed for this study. As a result, data collection and analysis followed the principles of both quantitative and qualitative methods. The quantitative method will measure the amount of food waste generated in the classified hotels while the qualitative will elaborate on the consequences of the food waste generated on the environment. Specifically, a descriptive survey design was employed to enhance understanding of the concepts under review through the nomothetic scientific inquiry method. A parametric test was conducted on the study dataset, with data presented in pie charts for representing data into series of segments and tables for proper organization of data.
Data source and materials
The following procedures were taken to address the problem for this research's objective. The study employed primary data to arrive at the final results. The primary data was collected from all the 28-star hotels within the study area.
A census survey technique was employed to collect data from all the 28-star hotels for one week. The hotels grouped into strata based on their categorization for quality and standardization in the hospitality industry includes four categories from 2-5 stars, as shown in the Table 1. A purposive sampling technique was employed to select two (2) key informants from the National Environment Management Authority (NEMA). Two key informants from NEMA and 28 hotel managers, making thirty (30) people, were interviewed in a nutshell.
To achieve the study objective, the study assessed the food waste's carbon footprint generated from the data collected using the food waste calculator. The food products' carbon footprint was also obtained with the help of available data on the amount of energy needed for transporting raw food items from the farm gates to the hotels in Nairobi and the amount required to prepare food at the hotels. This method is intended to employ the LCA tool in determining the Carbon Footprint (CF) of the life cycle of the main food items consumed in Nairobi hotels.
Data analysis
The carbon footprint of hotel food waste was calculated using the food waste calculator to determine GHG emissions. The food waste footprint approach helped determine the volume of greenhouse gases emitted from food waste daily. Correlational data analysis was undertaken to identify the relationship between food wastage and greenhouse gas emissions as the main component of environmental changes. Results have been presented in charts, graphs, and tables.
Y = α + β1X1 + β2X2 + β3X3 + β4X4 + εi
Where Y= The expected volume of the carbon footprint is the dependent variable.
α = Constant (representing the Y-intercept)
X1 = main food waste generated from star hotels,
X2 = quantity of food waste generated from star hotels,
X3 = mitigation potential of reducing food waste,
X4 = greenhouse gas emission from transporting food waste.
β1 = coefficient of the regression for independent variable X1,
β2 = coefficient of the regression for independent variable X2,
β3 = coefficient of the regression for independent variable X3,
β4 = coefficient for the regression for independent variable X4,
εi = Error term, which we assume is normally distributed with the average 0 and a certain constant variance.
The estimated volume of carbon footprint generated at a given time in a star hotel is dependent on the main food waste generated, the amount of food waste produced, the mitigation potential of reducing food waste, and greenhouse gas emissions resulting from transporting food waste to the landfills in Nairobi City County.
A regression analysis was conducted to examine causality relationships between dependent and independent variables. A regression analysis was carried out to test the hypotheses and answer the research questions. The dependent variable in each model represented an effective measure in estimating carbon footprint, the quantity of food waste generated, and mitigation potential.
Y1 = β0 + β1X1 + β2X2 + β3X3 + εi (1)
Y2 = α0 + α1X1 + α2X2 + α3X3 + εi (2)
Where:
Y1 = quantity of food waste generated;
Y2 = mitigation potential
β0 … β3; α0 … α3 = are constants to be estimated
X1 = quantity of food waste generated from star hotels,
X2 = mitigation potential of reducing food waste,
εi = Error term, which we assume is normally distributed with the average 0 and a certain constant variance.
All the food waste generated in star hotels contributes to Greenhouse Gas Emissions.
Results and Discussion
Introduction
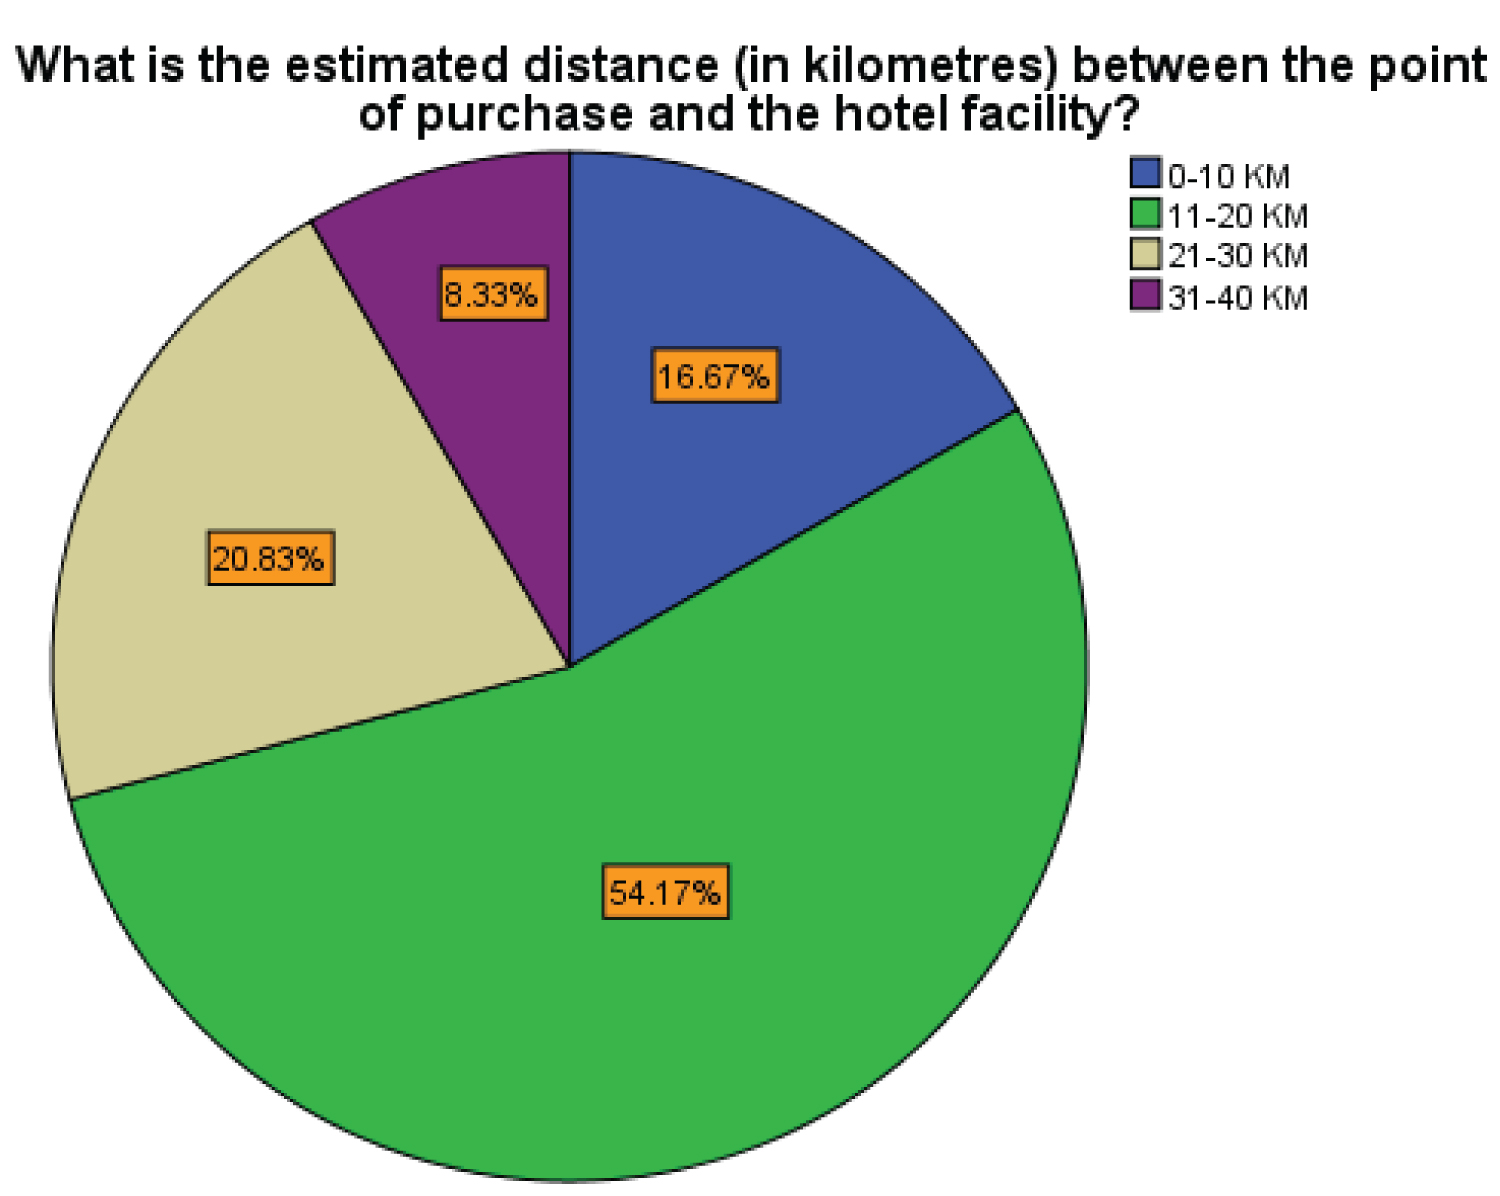
An analysis was conducted to determine the estimated distance in kilometres from the purchase point to the hotel establishment and the results are presented in Figure 2.
From the presentation in the figure above, the study indicated that (54.2%) of the classified star hotels had a distance ranging between 11-20 kilometres from the point of purchase and the facilities, while (20.8%) of the hotels agreed that the distance between the pint of purchase and the facilities was between 21-30 kilometres. Additionally, (16.7%) of the hotels indicated that the distance between the point of purchase and the facilities ranged between 0-10 kilometres, whereas (8.3%) of the classified star hotels revealed that the distance between the point of purchase and the facilities ranged between 31-40 kilometres. Therefore, the study notes that the hotels' points of purchase for the different categories of food items were within a radius of 0-40 kilometres, thereby allowing them to acquire the food items as fast and as convenient as possible to prepare meals for the customers.
It is important to note that the distance between the point of purchase for various food items and the hotel facilities determines the carbon footprint of the distance covered for transporting food to the facilities. In this regard, this study adopted the United States Environmental Protection Agency [EPA] (2018) method of estimating the carbon IV oxide emitted from a distance of one (1) kilometre travelled by truck to calculate the carbon footprint of transporting food from the point of purchase to the facility.
The method stipulates that the average truck emits about 0.251 kilograms of CO 2 per 1-kilometre distance. The trucks consume an average fuel of about 35.41 kilometres per gallon, with every gallon of fuel creating about 8.887 kilograms of CO 2 when burned. Therefore, the average truck, when driving one kilometre, has the CO 2 emission equivalent as follows:
Where KMPG represents the Kilometre Per Gallon.
Since most of the hotels (54.2%) indicated that the estimated distance from the point of purchase to the facilities ranges between 11-20 kilometres, it implies that between 2.761-5.02 kilogram of CO 2 equivalent is emitted into the atmosphere. Similarly, since (20.8%) of the classified star hotels revealed that the estimated distance from the point of purchase to the hotel facilities ranges between 21-30 kilometres, which translates into 5.271-7.53 kilogram of CO 2 equivalent released into the atmosphere. Moreover, (16.7%) of the hotels indicated that the estimated distance from the point of purchase and the facilities was between 0-10 kilometres, which is equivalent to 0.251-2.51 kilograms of CO 2 emitted into the atmosphere. Lastly, the remaining (8.3%) of the hotels revealed that the distance from the point of purchase and the facilities was between 31-40 kilometres, which translates to 7.781-10.04 kilograms of CO 2 equivalent emitted into the atmosphere. The results indicate that a significant amount of CO 2 is released into the atmosphere by the classified star hotels through the transportation of food from the point of purchase to the facilities. Consequently, this contributes to global warming and climate change.
These findings are in tandem with the research results conducted. on the carbon footprint of food waste management options in the waste hierarchy in Sweden. The study results showed that the properties of each food product have a major influence on determining the most favourable waste management option.
Another descriptive analysis was performed concerning the estimated distance between the hotel and the landfill, and the results are presented in Table 2.
From the table above, the results note that a majority of the hotels (50%) are located at a distance of between 11 and 15 kilometres, followed by (45.83%) of the hotels are at a distance of 16-20 kilometres to the disposal site, whereas (4.17%) of the hotels had a distance of 31-35 kilometres from the disposal site. The study thus noted that most hotels were located around 11 to 20 kilometres from the disposal site.
Nonetheless, to calculate the carbon footprint of transporting food from the point of purchase to the facility, the study adopted the United States Environmental Protection Agency [EPA] (2018) method of estimating the carbon IV oxide emitted from a distance of one (1) kilometre travelled by truck. The method stipulates as follows:
The average truck emits about 0.251 kilograms of CO 2 per 1-kilometre distance. The trucks consume an average fuel of about 35.41 kilometres per gallon, with every gallon of fuel creating about 8.887 kilograms of CO 2 when burned. Therefore, the average truck, when driving one kilometre, has the CO 2 emission equivalent as follows:
Where KMPG represents the Kilometre per Gallon.
The finding showed that (50%) of the hotels indicated that the estimated distance from the facilities to the landfill ranges between 11-15 kilometres, implying that between 2.761-3.765 kilograms of CO 2 equivalent are emitted into the atmosphere. Equally (45.8%) of the classified star hotels stated that the estimated distance from the facilities to the landfill ranges between 16-20 kilometres, which translates into 4.016-5.02 kilogram of CO 2 equivalent released into the atmosphere. Additionally, (4.2%) of the hotels indicated that the estimated distance from the facilities to the landfill was between 31-35 kilometres, equivalent to 7.781-8.785 kilograms of CO 2 emitted into the atmosphere. The results are a pointer to the growing concern about the CO 2 emissions emanating from the hotel sector through transportation of the food waste to the landfill sites, which has greatly contributed to climate change.
These findings agree with the results of the research conducted by Song, Li, Semakula, & Zhang (2015), investigating food consumption and waste and the embedded carbon, water and ecological footprints of households in China. The study calculated the carbon, water and ecological footprints associated with food consumption and wastage at the household level and per capita. The results showed that the environmental footprint of the various modes of food consumption varied significantly. Since the food derived from animals produces more GHGs than food derived from plants, the footprint shares of foods derived from animals differ from those derived from plants. Food waste from animal-derived foods was only (13%) by weight but accounted for (30%), (44%), and (27%) of the total embedded CF, WF, and EF, respectively. Food waste, which was the largest contributor to the CF, GH and EE, was rice, pork and vegetables, respectively. Wheat, beef, aquatic products, and legumes also represented large waste fractions.
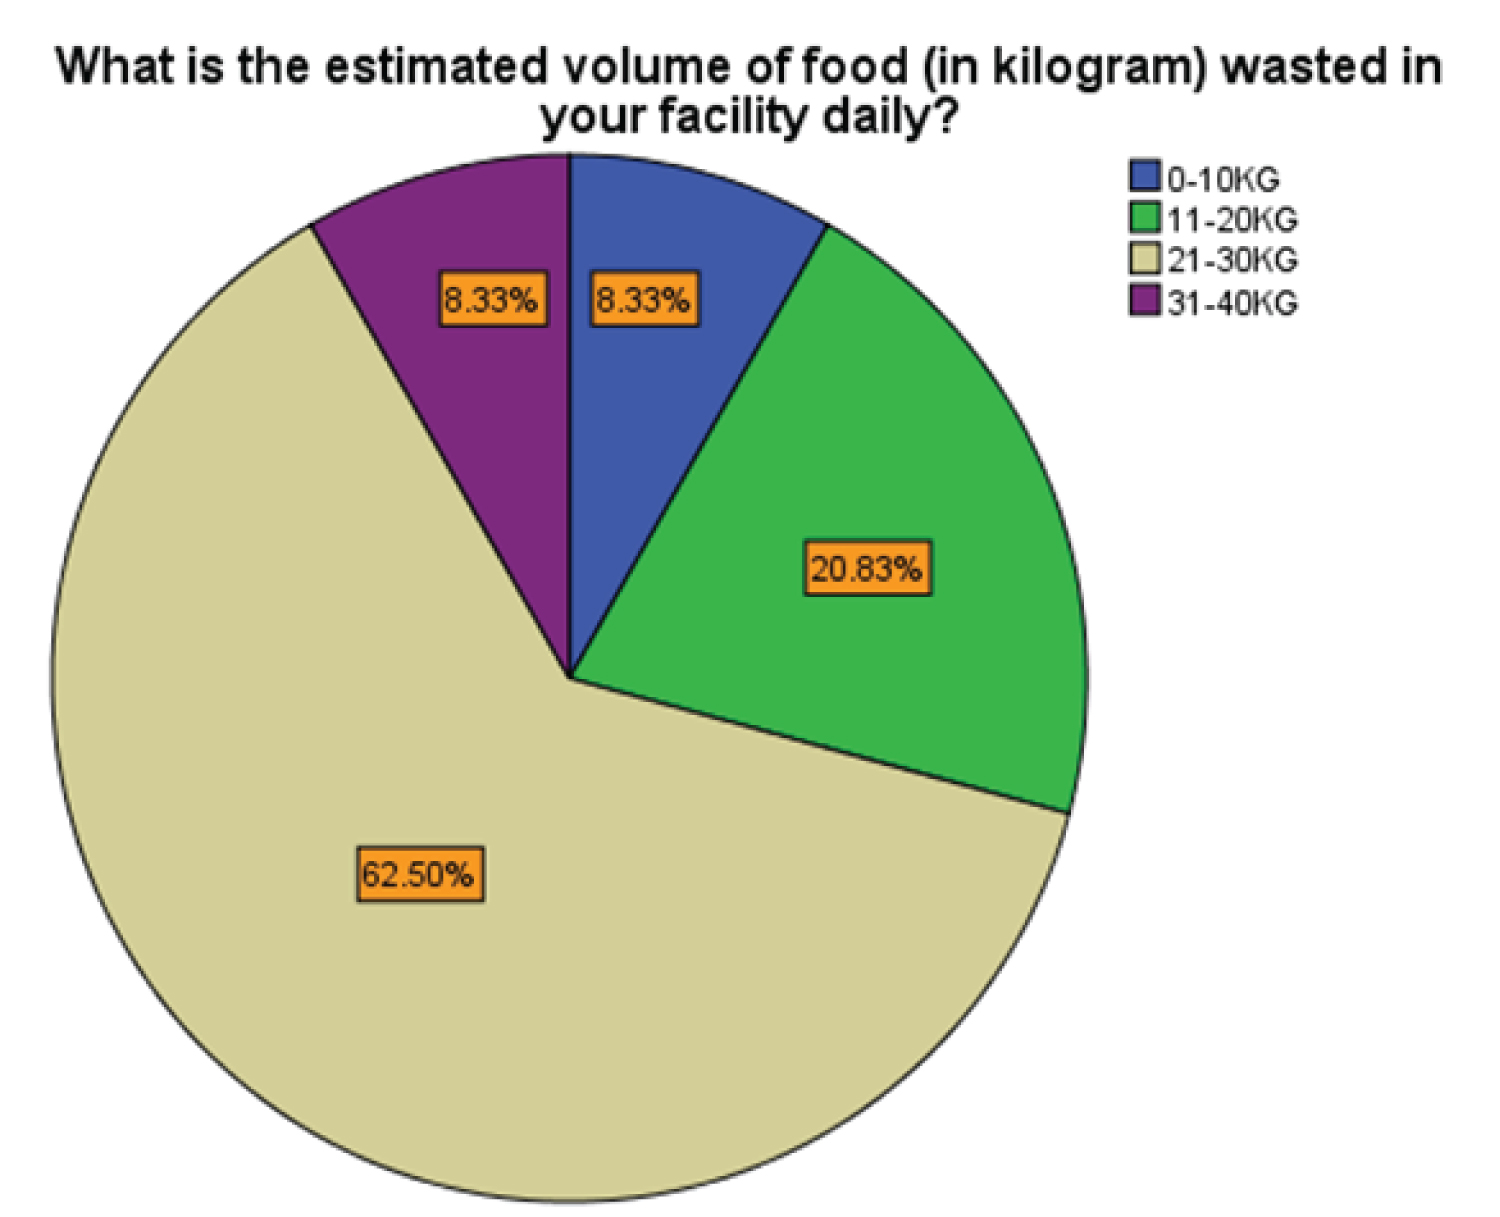
A further analysis was done to establish the quantity of food waste from the hotel facilities, and the findings indicated in the Figure 3.
The results showed that the majority (62.5%) of the hotels confirmed that they wasted between 21-30 kilograms of food daily at their facilities, while (20.83%) of the hotels indicated that they wasted between 11-20 kilograms of food daily in their facilities. A further (8.33%) of the hotels revealed that they wasted between 0-10 kilograms and 31-40 kilograms of food daily at their facilities. The findings highlighted were designed to help determine the carbon footprint of the amount of food waste generated in star-rated hotels. To this end, the study adopted the FAO (2013) estimate of food waste, which states that for 1.3 gigatonnes of food waste, the emissions are 3.3 gigatonnes of CO 2 equivalent. This implies for every 1 kg of food wasted, 2.5 kg of CO 2 equivalent is emitted into the atmosphere.
Since most of the hotels (62.5%) indicated that the amount of food wasted daily ranges between 21 and 30 kilograms, this implies that between 52.5 and 75 kilogram of CO 2 equivalent is emitted into the atmosphere daily. Similarly, since (20.8%) of the classified star hotels revealed that the amount of food wasted daily in the facilities ranges between 11 and 20 kilograms, this means that 27.5 and 50 kilograms of CO 2 equivalent is released into the atmosphere daily. Instructively, (8.3%) of the hotels emit between 2.5 and 25 kilograms of CO 2 , equivalent to 1 to 10 kilograms of food wasted daily. Most importantly, the other (8.3%) hotels emit between 77.5 and 100 kilograms of CO 2 , equivalent to the 31 to 40 kilograms of food wasted daily within the facilities.
The study findings show that through food waste, the classified star hotels contribute significantly to the spewing amount of CO 2 into the atmosphere daily, exacerbating the already dire consequences of climate change. The findings agree with the study conducted by Zhang, Tong, Singh, Cai, & Huang [24] on assessing the carbon footprint of nano-packaging considering potential food waste reduction due to shelf-life extension. The study incidentally evaluated consumer behaviour to quantify the amount of reduced food waste resulting from the extended shelf life of food products. The findings indicated that the global warming potential decreased due to reducing food waste was significantly higher than the additional global warming potential produced by nanomaterials.
Therefore, a Pearson correlation analysis was conducted to establish a relationship between food wasted and the carbon footprint in classified star hotels. These findings are presented in Table 3.
From the correlational matrix above, the study noted a significant strong positive relationship between the estimated amount/volume of food wasted daily in the hotel facilities and the greenhouse gas emitted. The correlation coefficient (0.863 * ) and a significant level.000 show the p-value (P < 0.05).
On the question of the estimated daily energy consumption to prepare food in classified star hotels, a descriptive analysis was conducted, and the results are shown in the Table 4.
From the results, it was indicated that (54.17%) of the respondents stated that the classified star hotels' estimated daily consumption of energy to prepare food at the facilities cost between 2001-3000 Kenya Shillings (37.5%) of the respondents confirmed that they spend between 1001-2000 Kenya Shillings on daily energy consumption, whereas (4.17%) of the respondents indicated that the estimated daily energy consumption cost between KSH 0-1000, and KSH 3001-4000 respectively. Therefore, the study evidently noted that the hotels' estimated daily energy consumption ranged between 0-4000 Kenya Shillings.
Regression model of quantity of food waste on carbon footprint
A regression analysis of the mean score indices for the quantity of food waste generated as an explanatory variable was measured against carbon footprint to measure Hotels' capacity (dependent variable) to estimate the causal relationship. Table 5 shows a summary of statistics estimated by the regression model:
The regression coefficient R = 0.880 shows the strength of the causal relationship between the dependent and independent variables. Model1 was able to explain roughly (88%) of the observations. From the adjusted R2, which was 0.757, the model estimated shows that there was (75.7%) positive variation in carbon footprint due to changes in the quantity of food waste generated. The analysis indicates that (24.3%) of the variation in carbon footprint was explained by factors other than the quantity of food waste generated by the classified star hotels.
Overall statistical significance of the regression model was examined by testing the null hypothesis that r = 0 and the regression coefficient is not significant as shown from the model significance (Sig. = 0.125). The study fails to rejects the null hypothesis and concludes that there was no statistically significant causal relationship between the quantity of food waste generated by the classified star hotels and the volume of greenhouse gas emissions in Nairobi City County.
Regression model of food waste reduction on carbon footprint
Mean score indices measuring waste management practices (X1, X2, X3) as explanatory variables were then regressed against mitigation potential (Y2) as a measure of Classified Star Hotels' contribution (dependent variable) to estimate the causal relationship. Table 6 presents s summary of statistics estimated by the regression model 2.
The adjusted R2 is the coefficient of determination. This value explains carbon footprint was influenced by the explanatory variables, including mitigation potential of food waste reduction. The regression coefficient R = 0.365 indicates the strength of the causal relationship between food waste reduction by the classified star hotels and carbon footprint. The regression model accounted for explaining (36.5%) of the observations. From the adjusted R2, which is 0.032, the model indicated a (3%) positive variation in greenhouse emitted as a result of changes in the mitigation potential of food waste reduction. Thus, this revealed that (97%) of the variation in greenhouse gas emitted was explained by factors other than the mitigation potential of food waste reduction adopted by the classified star hotels.
Overall statistical significance of the regression model was examined by testing the null hypothesis that R = 0 and the regression coefficient is not significant, as shown from the model significance (Sig. = 0.427). In this regard, the study failed to reject the null hypotheses. It concluded a statistically no significant causal relationship between food waste reduction in the classified star hotels and climate change mitigation in Nairobi City County.
Analysis of Variance (ANOVA) was also used to test the significance of the relationship between the dependent and independent variables.
In addition, the analysis of variances and the results are indicated in Table 7.
A significance value is statistically significant when it is less than 0.05, which is a significant value. The significance value of this study was 0.000, which is lower than the significance value of 0.05; thus, the model is statistically significant in predicting categories of food, the quantity of food waste, amount of greenhouse emissions, and mitigation potential of climate change.
The regression results for the analysis of the predictor and dependent variables are provided in Table 8.
Based on the results in Table 8, the B-coefficient was 0.880 and a P-value of 0.000. This result implies that the estimated quantity of food waste contributes to the carbon footprint through the greenhouse gas emitted into the atmosphere since P-value < 0.005.
The other research question was how the mitigation potential of food waste reduction affects the carbon footprint of food waste. It was hypothesized that there are significant positive causal relations between reducing food wasted and greenhouse gas emitted in the atmosphere, thereby contributing to climate change. The result showed a β-coefficient of 0.365 and a P-value > 0.004.
Summary, Conclusion and Recommendation
Summary of the findings
The study's general objective was to assess the carbon footprint of food waste in classified star hotels in Nairobi City County star hotels. The problem in this study was the notable gaps in the amount of greenhouse gas emitted into the atmosphere occasioned by the quantity of food waste generated by the classified star hotels. The literature reviewed indicated that because the carbon footprint of food waste is a vital contribution to climate change, the quantity of food waste generated by the hotels is critical to informing how they make decisions that reduce the impact of greenhouse gas emissions on climate change.
The study sought to determine the greenhouse gas emissions from food waste in classified star hotels. The results revealed that the estimated average distance between the point of purchase and the hotel facilities ranged between 11 and 30 KM, translating into an averagely of 2.761-7.53 kilogram of CO 2 , the equivalent of greenhouse gas released into the atmosphere within the radius of 0-40 KM. The findings also indicated that the estimated average distance from the hotel facility to the disposal site ranged between 11 and 20 KM, translating into an average of 2.761-5.02 kilogram of CO 2 equivalent released into the atmosphere within the radius of 35 KM. The results also revealed that (83.33%) of the hotels wasted an estimated 11-30 KG volume of food daily, averagely translating to 27.5-75 kilogram of CO 2 equivalent emitted into the atmosphere daily. Therefore, the findings indicated that greenhouse gas emissions from food waste significantly influenced climate change.
Conclusion
The study also concludes that greenhouse gases emitted into the atmosphere contribute to climate change. As such, the application of all the methods designed to calculate the CO2 equivalent released into the atmosphere within a given radius is relevant in helping to reduce food waste in classified star hotels in Nairobi City County.
Recommendation
From the findings and conclusions, the study recommends the following:
Classified star hotels should partner with government agencies and other stakeholders such as NEMA, EIK, NGO's, local business communities, and the county government to come up with better policies and waste management frameworks to guide and promote waste composting systems, waste for energy technology, reuse and recycling of food waste generated from the hotels.
Suggestions for further research
Given the initial results and findings, the study suggests that future research should be conducted on the mitigation strategies that food service industries can easily adopt to reduce the amount of food waste generated.
Acknowledgement
I am forever indebted to Professors Latifa and Christopher Shisanya, who, through the Intra-Africa Mobility Scholarship, offered me the opportunity to pursue this master's program, which led to this article.
To my supervisors, Dr Ezekiel Ndunda and Prof. Michael Koech, I am very grateful for your unwavering support, encouragement, and patience. I can never pay you back for all the help you have provided me, the experience you have helped me gain by working with you and the precious time you spent making sure my thesis is always on track. I hope you find some kind of satisfaction in this modest paper. Thank you so much.
To Mark Odhiambo, I don't know where I would be now if it weren't for your huge help editing my many mistakes. You are truly an outstanding person and an able educator, and I thank you from the bottom of my heart.
References
- Lundqvist J, de Fraiture C, Molden D (2008) Saving Water From Field to Fork - Curbing Losses and Wastage in the Food Chain. SIWI Policy Brief. Huddinge, Sweden: Stockholm International Water Institute (SIWI).
- Food and Agricultural Organization of the United Nations (FAO) (2014) Global food losses and food waste - extent, causes, and prevention. Rome: FAO.
- Obayelu AE (2019) A preventable tragedy how close is Africa to end hunger and malnutrition in all its forms by 2030? Afr J Food Agric Nutr Dev 19: 1-5.
- Stathers T, Holcroft D, Kitinoja L, et al. (2020) A scoping review of interventions for crop post-harvest loss reduction in sub-Saharan Africa and South Asia. Nat Sustain 3: 821-835.
- FAO (2019) Food and agriculture policy decision analysis; Ghana. Country Fact Sheet on Food and Agriculture Policy Trends, 915, 1-5.
- FAO, IFAD, UNICEF, WFP, and WHO (2020) The State of Food Security and Nutrition in the World 2020. Transforming food systems for affordable healthy diets. Rome, FAO. Global F (2015) Food waste in Kenya: Uncovering food waste in the horticultural export supply chain.
- Global F (2015) Food waste in Kenya: Uncovering food waste in the horticultural export supply chain.
- Hoekstra AY (2008) Water neutral: reducing and offsetting the impacts of water footprints, Value of Water Research Report Series No. 28, UNESCO-IHE, Delft, the Netherlands. www. water footprint. org 34/Business water footprint accounting Hoekstra. In Value of Water Research Report Series.
- Power W (2009) Life cycle management: how businesses use it to decrease footprint, create opportunities and make value chains more sustainable - United Nations Environment Programme & Society of Environmental Toxicology and Chemistry Europe.
- Murphy-Bokern D (2010) Understanding the Carbon Footprint of our Food. Complete Nutrition 10: 61-63.
- Tillman AM (2010) Methodology for Life Cycle-Assessment. In Environmental Assessment and Management in the Food Industry. Woodhead Publishing Limited.
- Eady SJ, Sanguansri P, Bektash R, et al. (2011) The carbon footprint for Australian agricultural products and downstream food products in the supermarket. In the 7th Australian Conference on Life Cycle Assessment, The Australia Life Cycle Assessment Society (ALCAS). Melbourne.
- Jensen JK, Arlbjørn JS (2014) The product carbon footprint of rye bread. J Clean Prod 82: 45-57.
- Meier MS, Stoessel F, Jungbluth N, et al. (2015) Environmental impacts of organic and conventional agricultural products-Are the differences captured by life cycle assessment? J Environ Manage 149: 193-208.
- Carbon Trust DEFRA (2008) BSI (a) PAS 2050: 2008. Specification for the assessment of the life cycle greenhouse gas emissions of goods and services. Carbon Trust, DEFRA, BSI a.
- ISO 14067:2018. (2018, August). ISO.
- Ikezuki T (2009) Japan's Carbon Footprint System. In Unpublished paper presented at the OECD Global Forum on Trade and Climate Change, Paris.
- Bolwig S, Gibbon P (2009) Emerging product carbon footprint standards and schemes and their possible trade impacts. Intereconomics 35: 127-136.
- Dassisti M, Intini F, Chimienti M (2016) Thermography-enhanced LCA (Life Cycle Assessment) for manufacturing sustainability assessment. The case study of an HDPE (High-Density Polyethylene) net company in Italy. Energy 108: 7-18.
- Jóhannesson SE, Heinonen J, Davíðsdóttir B (2020) Data accuracy in Ecological Footprint's carbon footprint. Ecol Indic 111: 105983.
- Grasty S, FAO (1999) Reducing enteric methane and livelihoods Win-Win opportunities for farmers. In Most, 14,.
- Pagnanelli R, Borges-Neto S (2020) How low can we go? J Nucl Cardiol 27: 573-574.
- Roos E (2013) Analysing the carbon footprint of food.
- County NC (2018) County Integrated development plan. 2018-2022.
Corresponding Author
Emmanuel Kwabena Owusu, Department of Environmental Science and Education, Kenyatta University, Nairobi, Kenya, Tel: +233541094186.
Copyright
© 2023 Owusu EK, et al. This is an open-access article distributed under the terms of the Creative Commons Attribution License, which permits unrestricted use, distribution, and reproduction in any medium, provided the original author and source are credited.