Enhanced Oil Recovery in the Field A123 by Using the Injection of Alkaline, Surfactant and Polymers
Abstract
This paper is based on numerical simulations in order to improve the total oil production of field A123 by using an Alkaline-surfactant and polymer (ASP) injections method. The main objective of this paper is to carry out reservoir simulations job that will further permit to conclude if producing oil and gas in this field will be rentable or not. To achieve this objective, the computer Modelling Group software version 2015.10 (CMG 2015 software) is used to carry out the field numerical simulations. Based on the tests run, one injection well is selected and used as a main injector in order to execute the chemical injection schemes in the field. Four different scenarios are studied such as natural flow of oil as the base case (primary oil production), polymer flooding, alkaline-surfactant (AS) flooding and ASP flooding are considering in the injection process and important results from simulator are analyzed and interpreted. Sensitivity analyses are done especially focusing on chemical solution concentration, injection rate and duration of injection time. The results obtained shows an oil recovery factor (ORF) of 64.1554 for polymer flooding, 64.2026 for alkali-surfactant finally 64.8056 for the combined flooding (ASP flooding), respectively. Those results have a direct influence on reservoir pressure which changes after the injected fluids are introduced in the reservoir and therefore improve the production rate. By evaluating the feasibility of the project of polymer flooding combined to AS flooding considering oil prices fluctuations due to COVID 19, the net present value (NPV) is 873 484 102 USD which is the best for the field A123.
Keywords
Field A123, Enhanced oil recovery, Numerical simulations, Water flooding, Alkali-Surfactant-Polymer flooding
Introduction
Obviously, ASP is used as the most important chemical EOR method in oil industry. Thus, the recoveries facilitate the displacement of macroscopic sweep efficiency as well as microscopic molecules in the reservoir [1]. The world energy of hydrocarbon totalizes a rate supply of more than 85% nowadays [2]. Henceforth, governments have worked hand to gloves with petroleum companies to ensure the optimal production of oil and gas to continuously provide energy and support the global economy. Optimization of the rate of conventional hydrocarbons is majorly in three stages namely: Primary, secondary and tertiary stages [1,3]. Improving conventional hydrocarbon recovery rates is essential to meet the global energy demands necessary for socioeconomic functioning [4]. According to a report published by TOTAL [5] on the future of oil resources, improved oil recovery is one of the main ways. The average recovery factor using conventional primary and secondary production techniques to the economic limit is about 33% [6]. This implies that more than 60% of oil is not recovered either because it is bypasses by the injected water, or it is too viscous to be displaced by the water, numerous EOR methods have been devised and utilised to overcome this unrecovered oil. During oil recovery, the overall oil displacement efficiency is a combination of macroscopic (volumentric sweep) and microscopic (pore-scale) displacement efficiency. Petroleum reservoirs usually start with a formation pressure high enough to force crude oil in to the well and sometimes to the surface through the tubing. However, since production is invariable accompanied by a decline in reservoir pressure, natural drive soon comes to an end [7]. The well known traditional chemical enhanced oil recovery (EOR) methods are polymer flooding, surfactant, and alkaline flooding. However, the conventional chemical EOR methods have their limitations [8-10]. Polymers, whose main recovery mechanism is to increase the viscosity of injectants and consequently mobility, suffer viscosity loose in the presence of reservoir brines and elevated temperature conditions [11,12]. Surfactant and alkali lose their efficiency during their flow in porous media due to adsorption phenomena [13-16]. Subsequently, different methods of chemical flood injections are devised, studied, and applied for EOR processes [17-19]. This includes the tertiary mix of alkaline/surfactant/polymer [20].
The main objective of this paper is to maximize the production of the A123 field after observing its depletion by injecting ASP. For this to be done different scenario are studied and some specific objectives are also set. They are Coming out whit a 3D model of the reservoir A123 identifying the nature of the reservoir properties; building of a digital reservoir well using CMG; well creation and choosing both injector and producer wells; realising the different scenarios of simulation of production with natural drive realising the different scenarios of simulation of production with ASP injection; carrying out an economic evaluation on the different results after interpretation and comparison of the results of both simulations. Therefore, this paper, it is sliced into three sections. The first section presents the introduction. The second section presents the data and results obtained followed by a discussion. The conclusion is given in the third section.
Data and Results
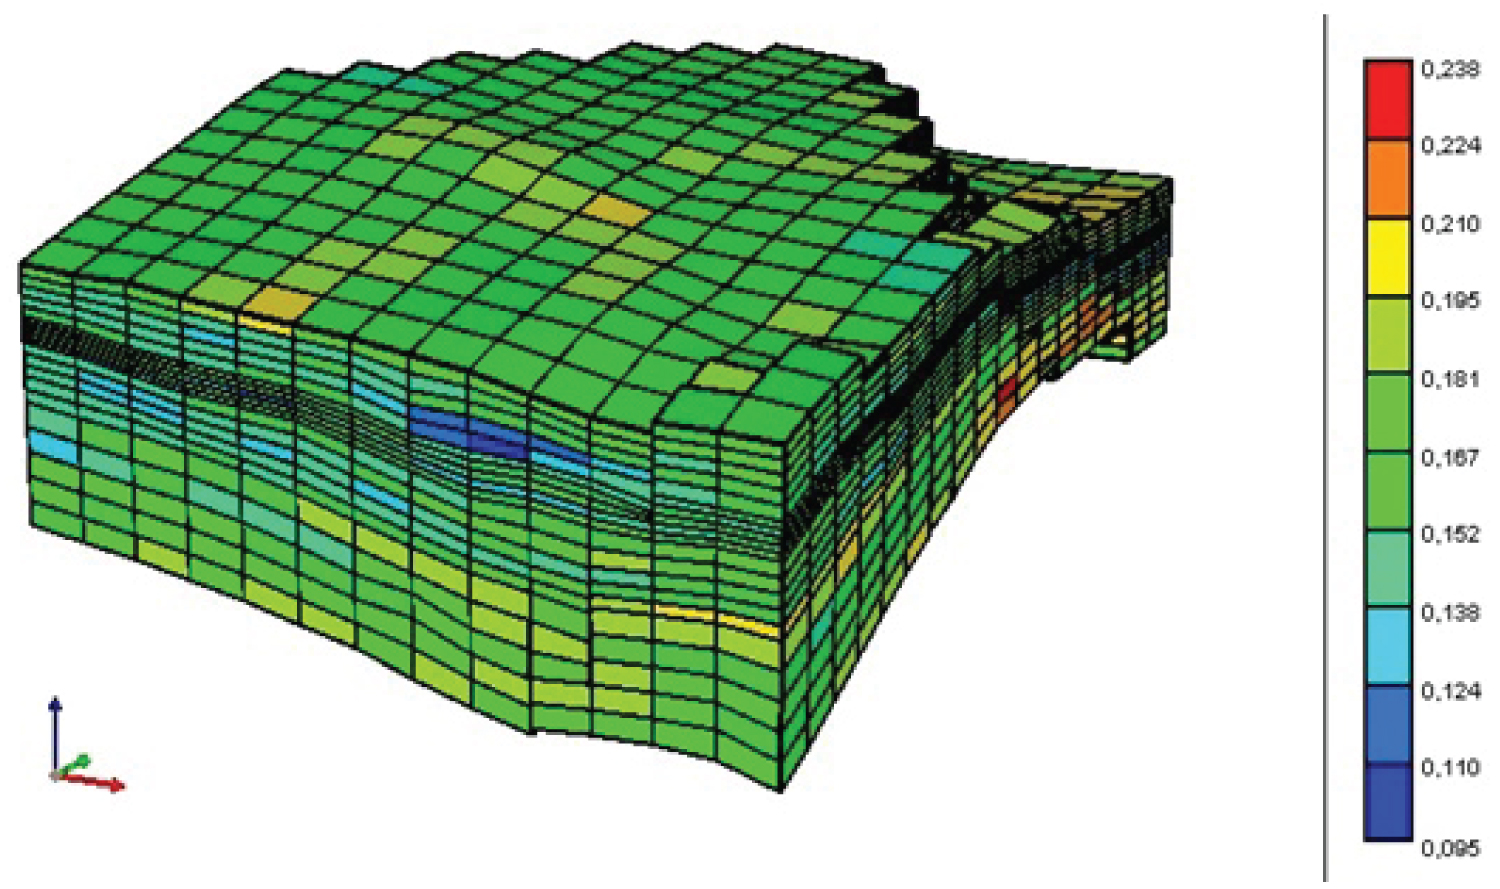
The field name is the field A123 and its location is not given for confidential reasons. The field A123 has a single porosity type and has 4680 blocks arranged in 13 layers along the X axis, 18 layers along the Y axis and 20 layers along the Z axis (4680 grid blocks, 2005 view blocks and 3441 exterior faces) with a colure scale representing the petro physical parameter to discourse (porosity, permeability and saturations). The Table 1 and Table 2 present the reservoir initial state.
Based on the data of Table 1 and Table 2, the Computer Modelling Group software version 2015.10 and economic evaluation are used to attain the aims of this paper.
The reservoir model of the field A123 with porosity distribution is presented in Figure 1.
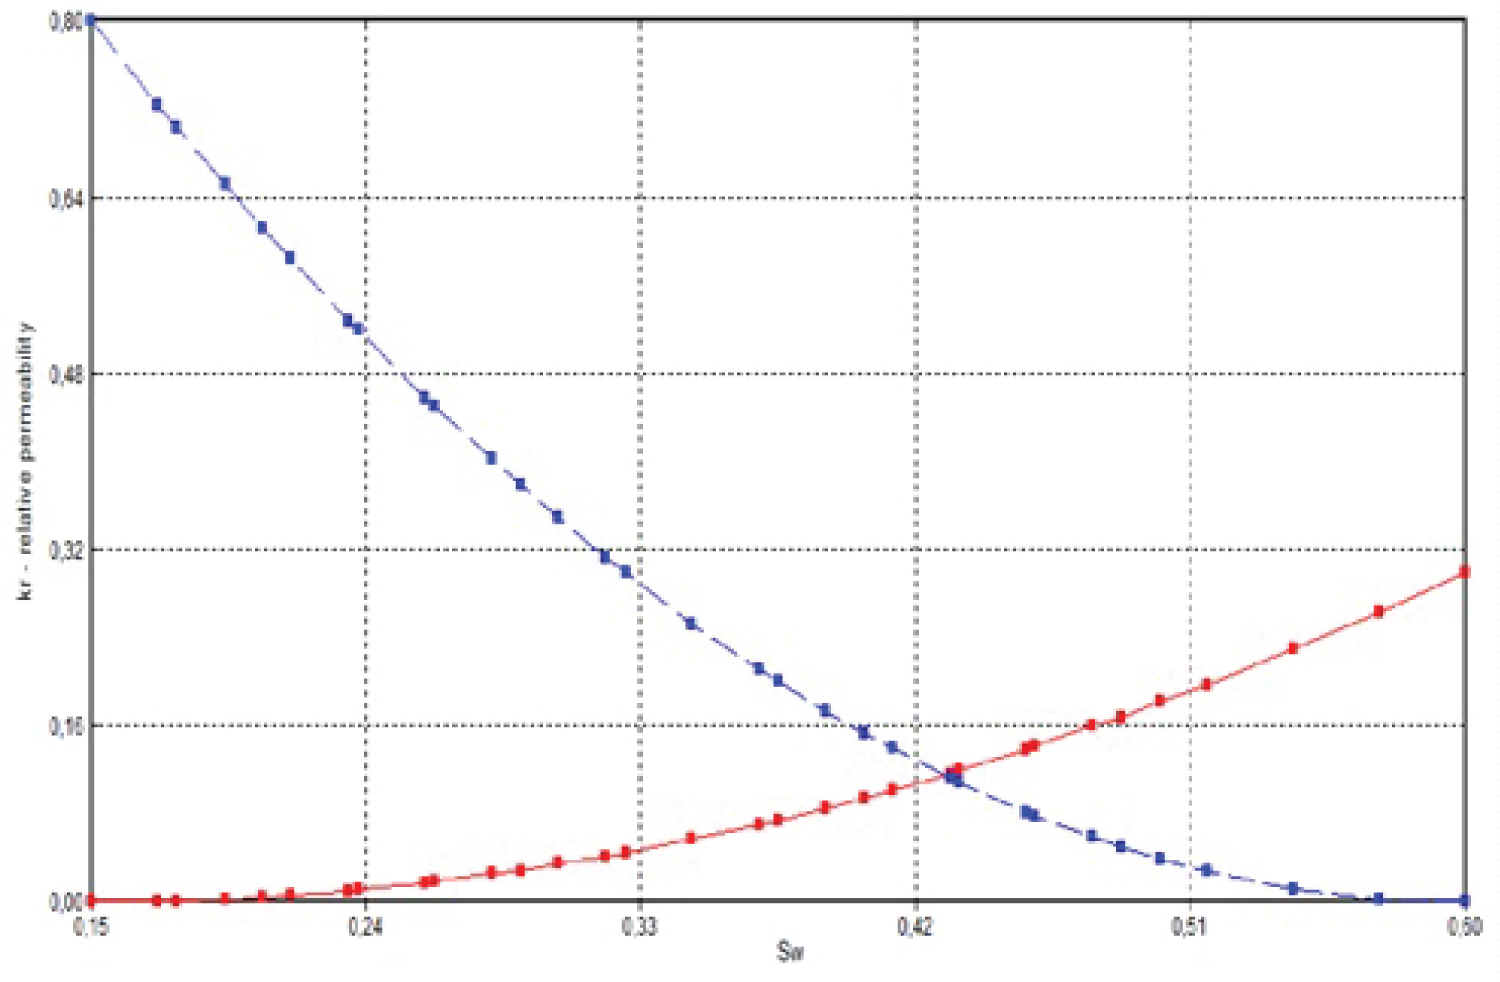
In Figure 1, the porosity ranges from 0.095 (blue), to 0.238 (red) of the field and that of our zone of interest averages between 0.167 to 0.195 (possible Sandstone or a dolomite type reservoir) and can reach up to 0.210 to 0.238 in some zones. The reservoir can therefore be considered to have a good porosity because its value ranges between 15% and 20% [21]. Figure 2 shows the relative permeabilities of the water in blue and that of oil in red in the tank.
In Figure 2, it can be seen that the water starts to move at saturation Sw = 0.19375. Furthermore, water moves faster than oil and occupies the large diameter pores. The A123 field tank is water-wet table and from this it is understood that the positioning of our production well is very important that can permit the exploitation of this water energy in driving out the fluid of interest. Relative permeability together with capillary pressure are unitless functions of saturation that helps in estimating reservoir fluid flow generally ranges between 0 and 1. The intersection at 0.46 shows increasing water wettability. This method of determining wettability depends on connate water saturation and pore size distribution hence can be subjected to large errors.
Base case results: 26 years of natural energy production
On the 1 January 2016, four producing wells are drilled into the reservoir depending on the oil saturation, porosity and permeability of the reservoir. The reservoir produces by itself for 26 years without external energy. The production quantities are summarized in Table 3.
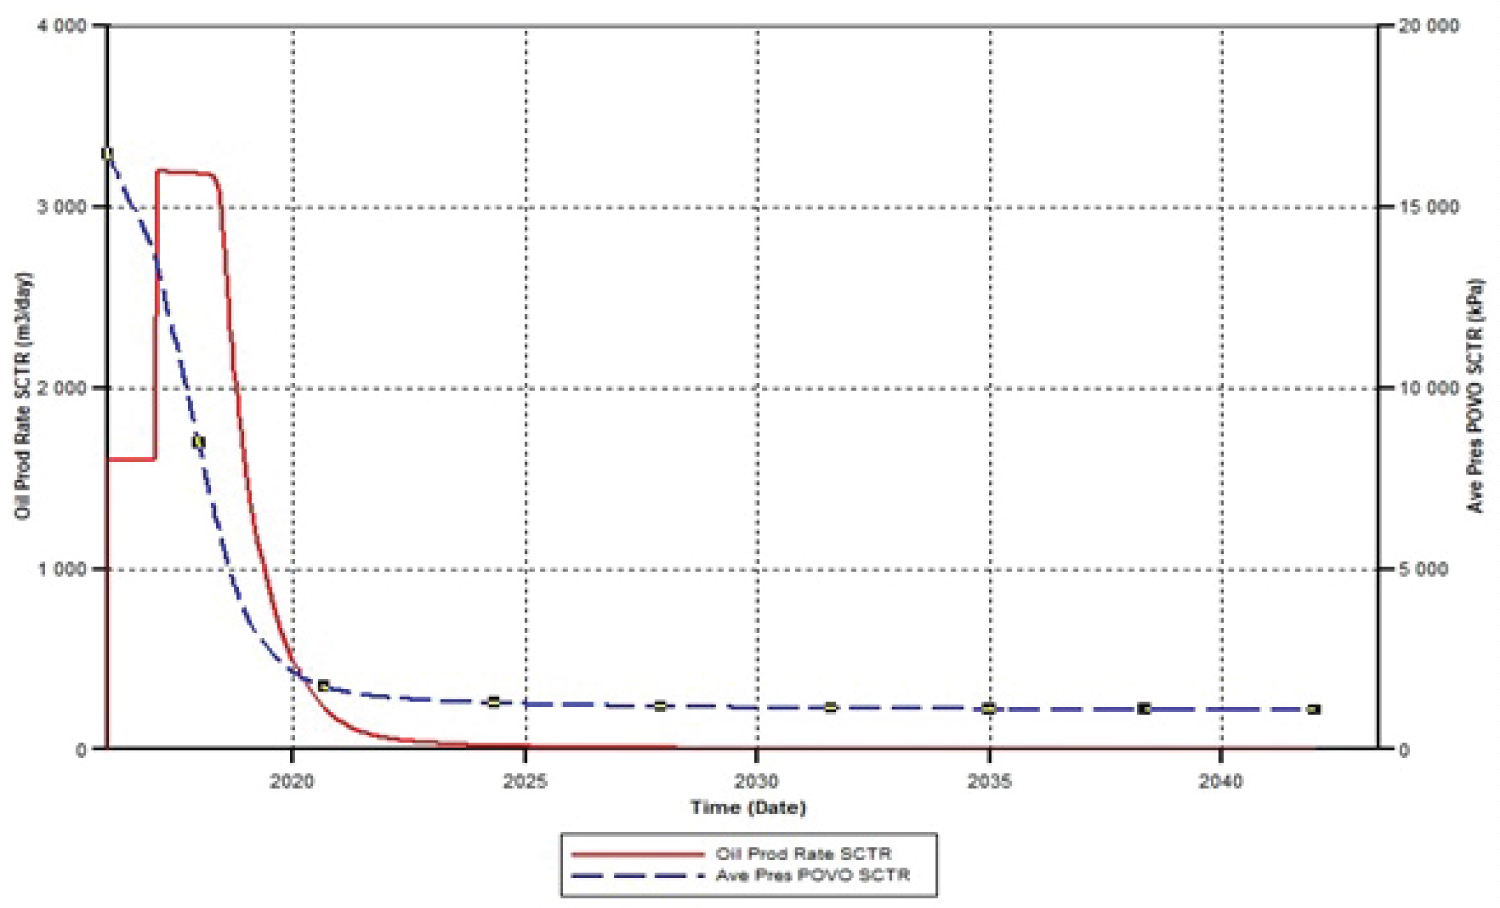
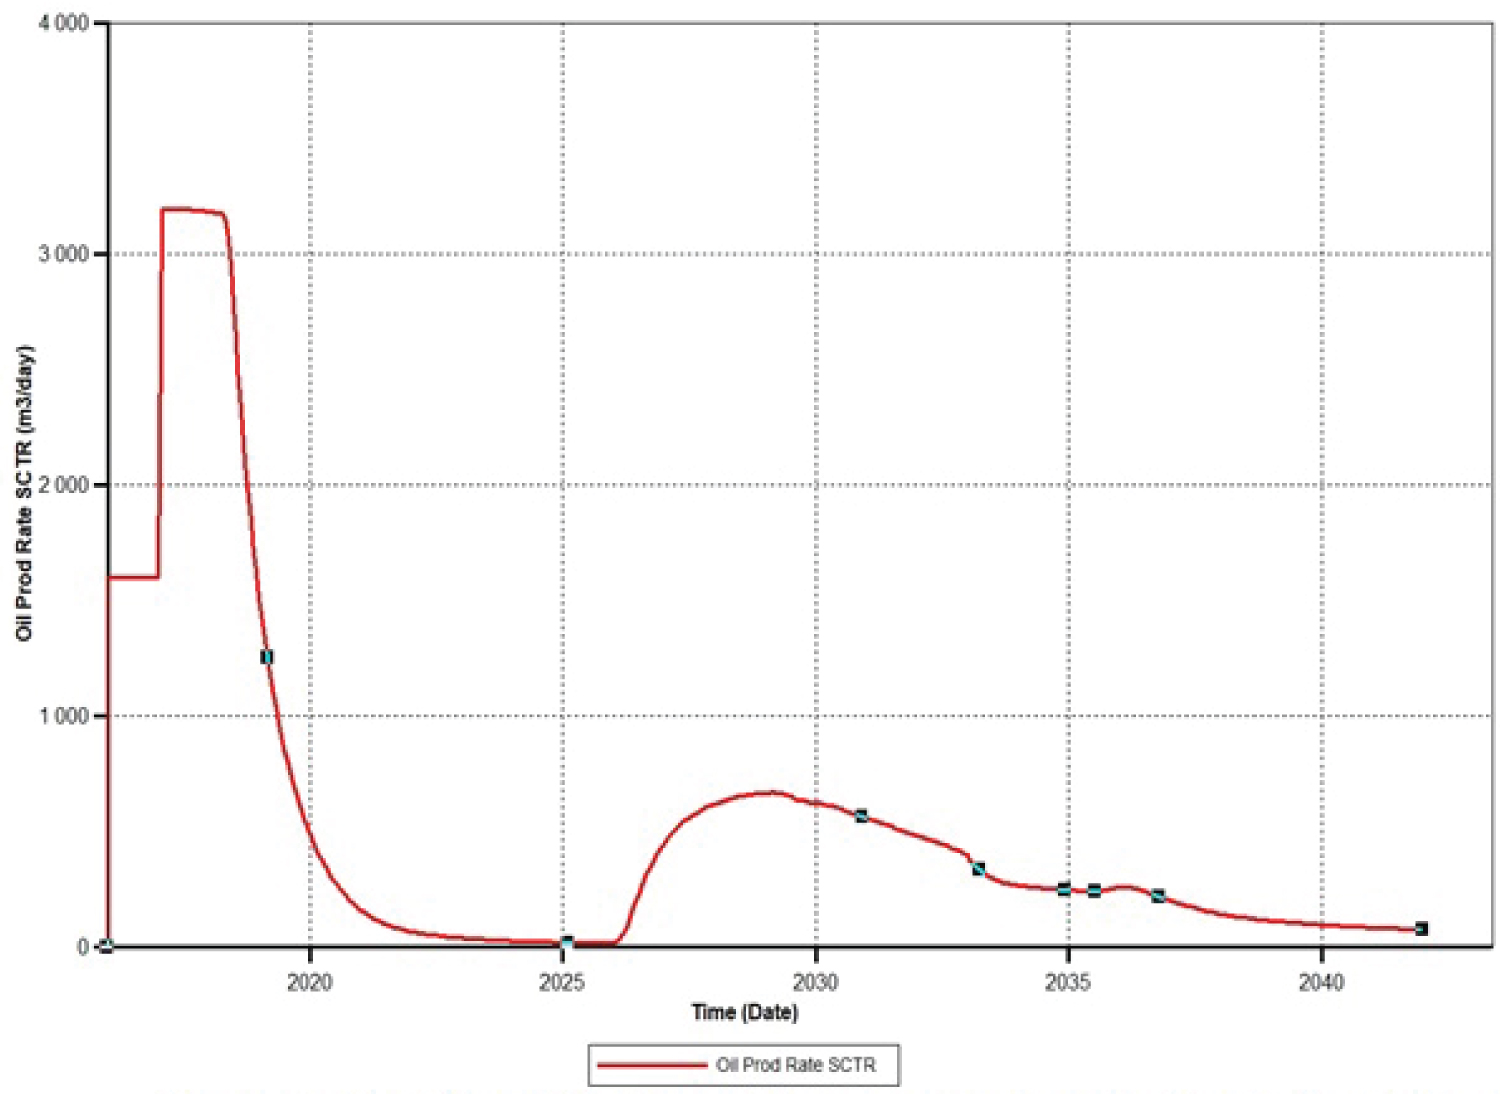
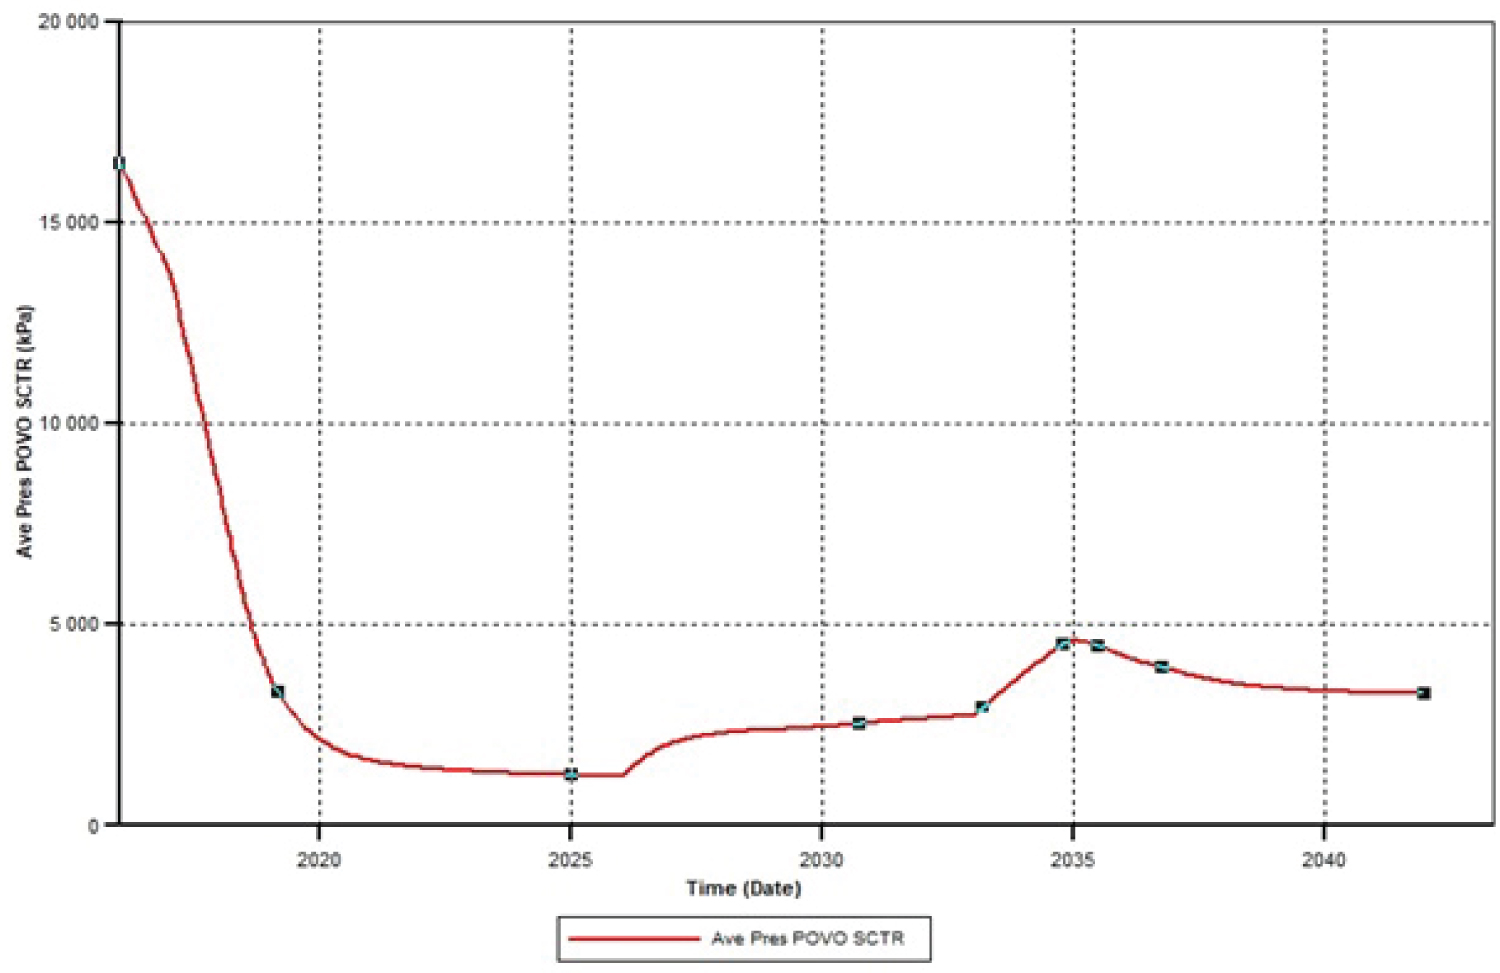
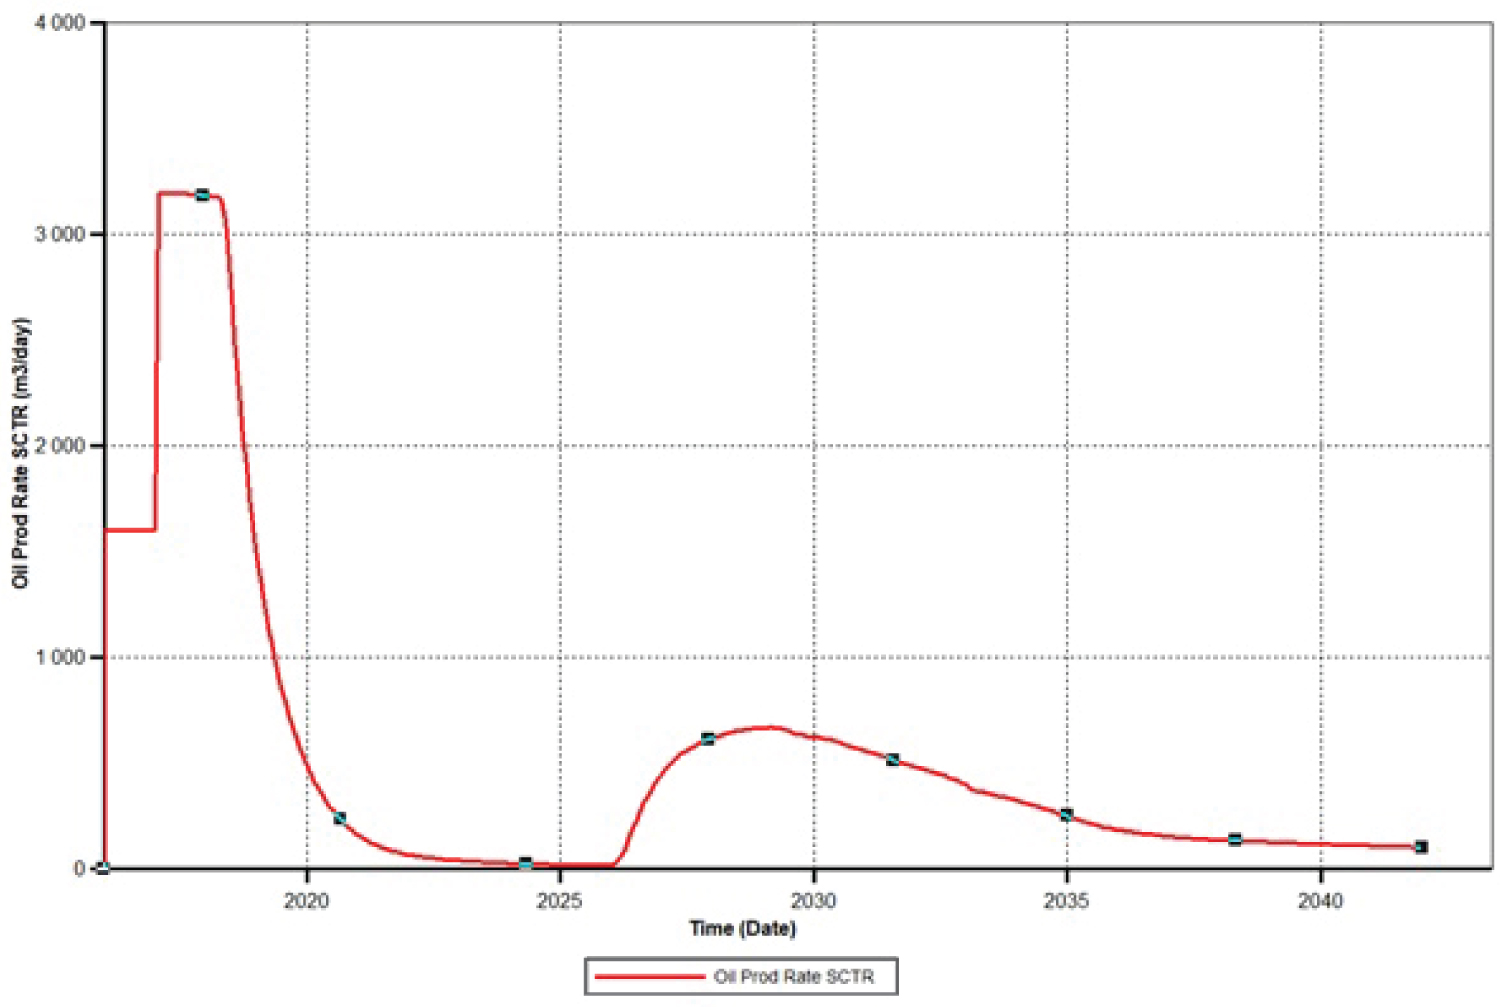
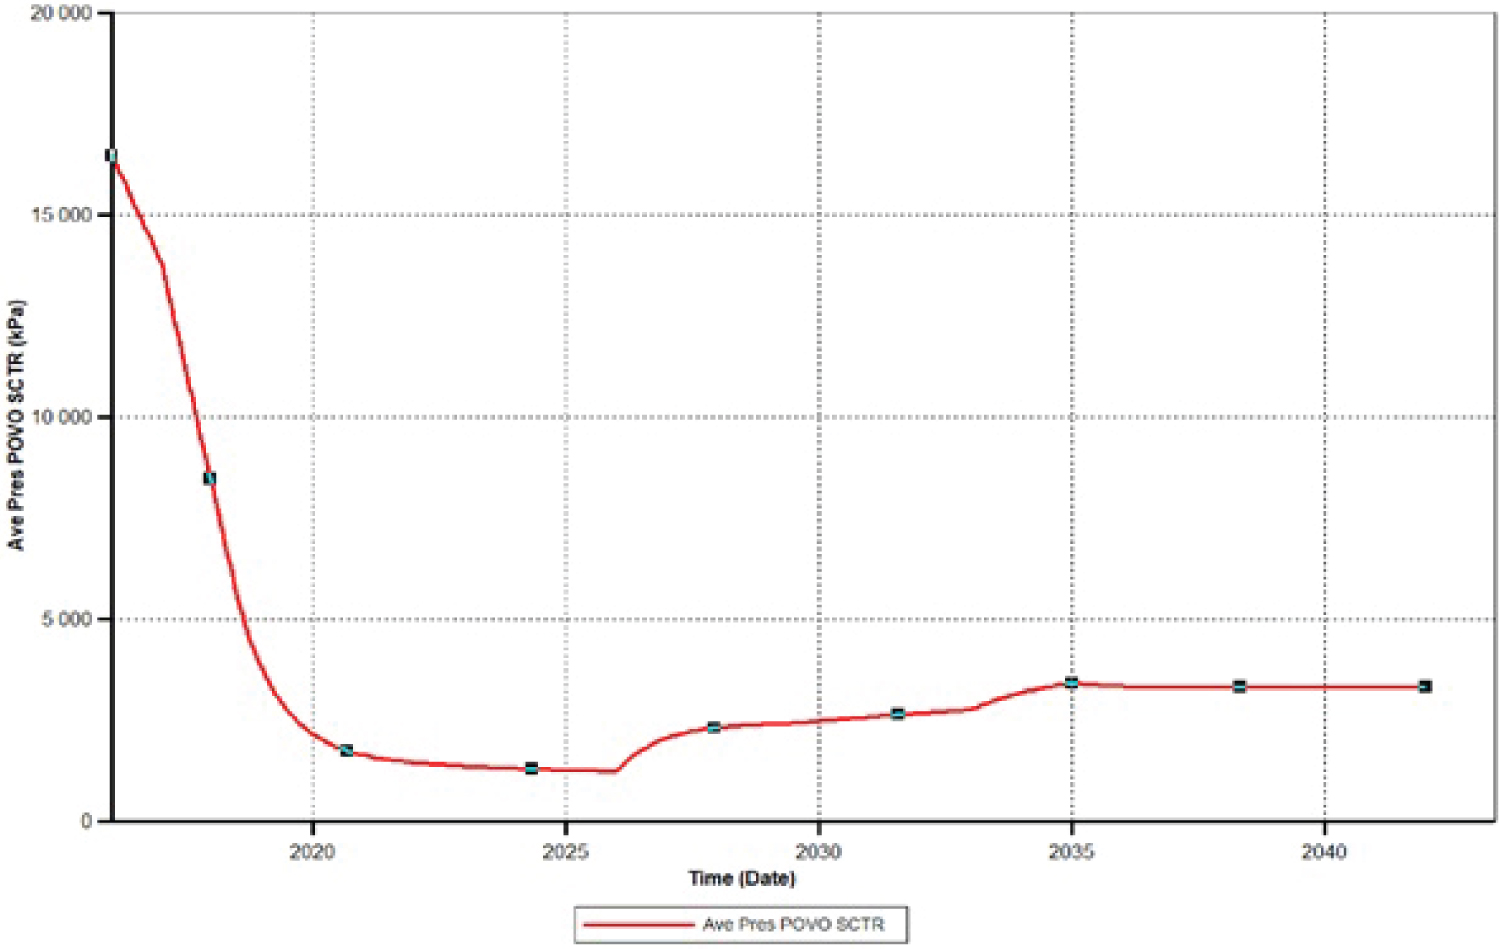
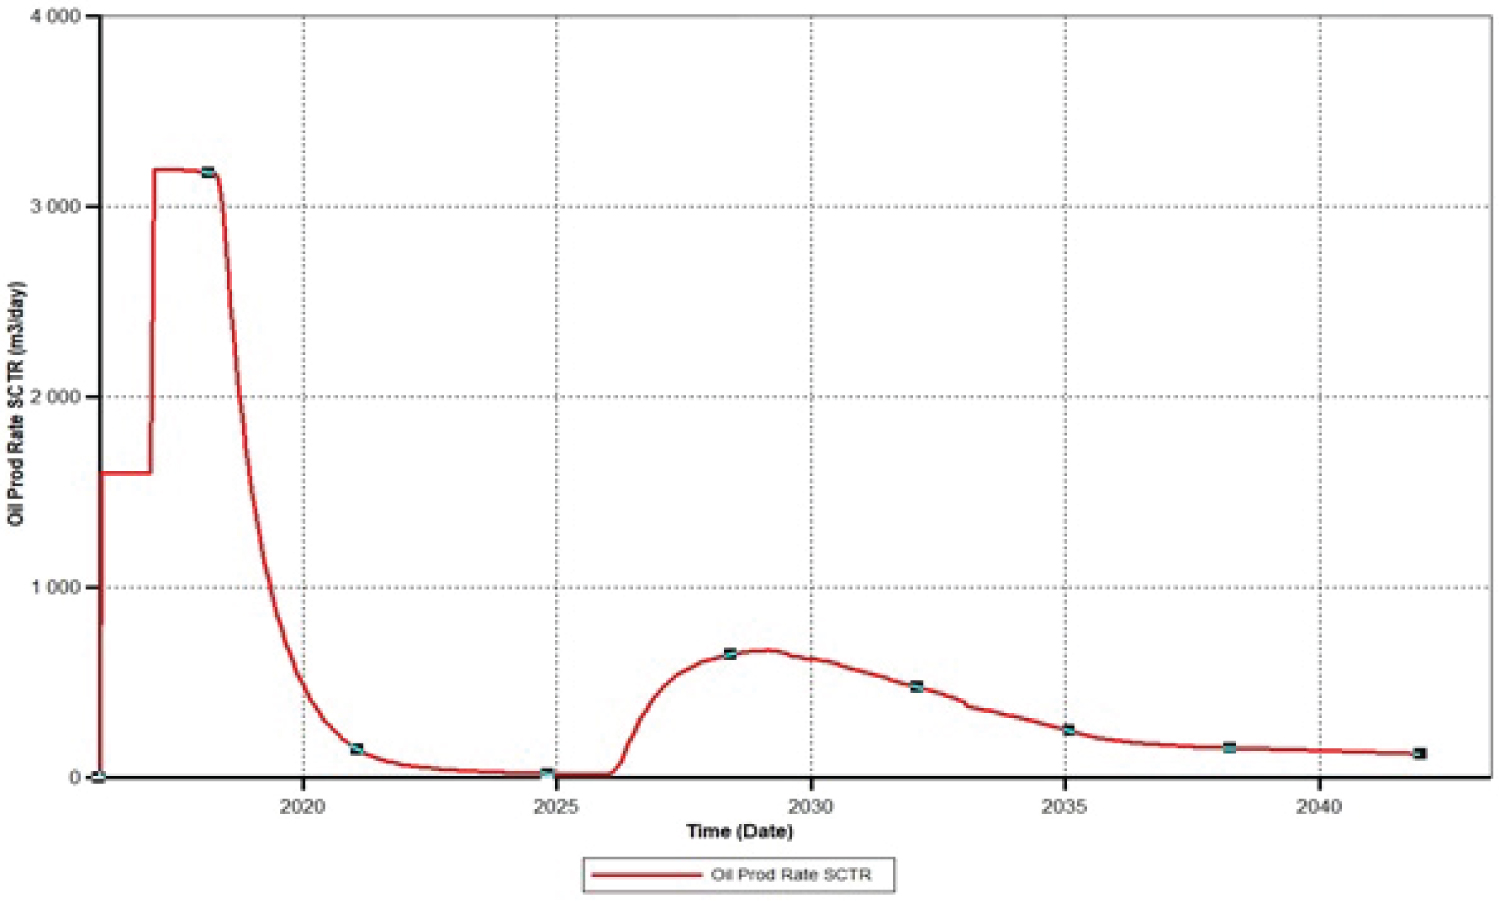
Figure 3 shows a diagram of oil rate produced with average reservoir pressure curve without any injection over the 26 years of simulation.
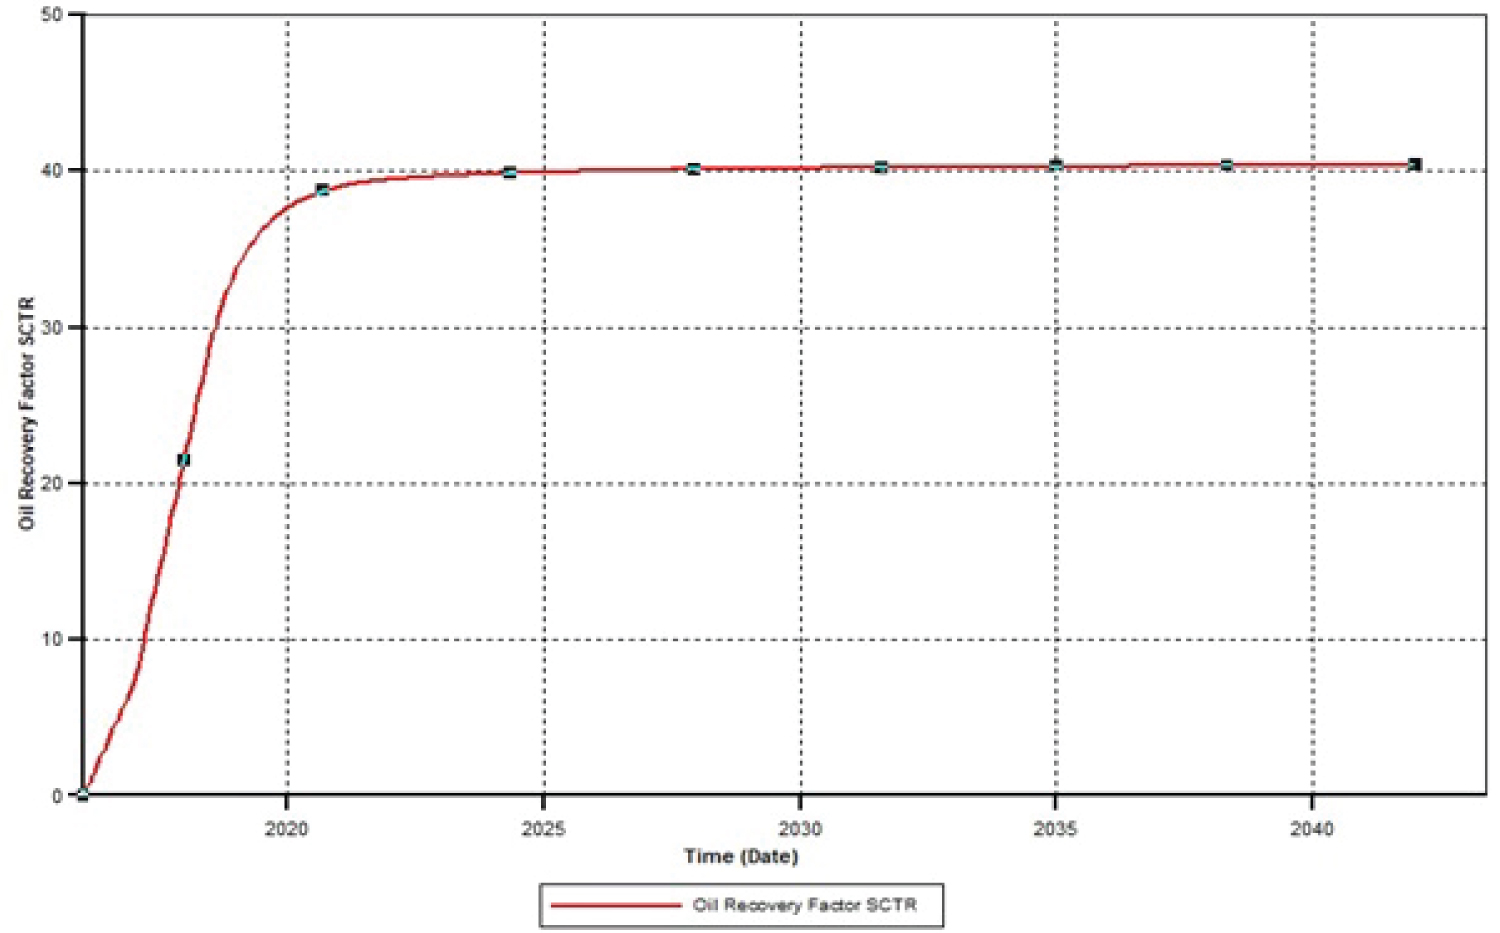
In Figure 2, high production is conducted by high internal pressure, this cure drops because of no active additive to help improve pressure rate. The red curve represents the oil production rate while the blue curve represents the average reservoir pressure. We notice that the oil production is directly proportional to the reservoir pressure. At the beginning of production, oil production is high of about 3194.68 m cube/day in 2016 then drops drastically from the year 2018 continually till it reaches 1.39993 m cube/day in 2042.When the reservoir is fractured and set to production, the backdrop pressure from the year of fracture 2016 with a value of about 16468.9 kPa start dropping drastically till 2022 to 1266.51 kPa then further decreases smoothly in 2025 and finally reaches a value of 1099.35 kPa in 2042. Thus, the pressure decreases with the oil production rate. This production drop could be due to the fact that the reservoir does not have a sufficient pressure to maintain the flow of fluid for a long period. Also, it is observed that the production reaches its crest in 2017 and last for 2 years before a decline in production rate. It is only after this that one can start EOR operations. The ORF for base case as function of year is depicted in Figure 4.
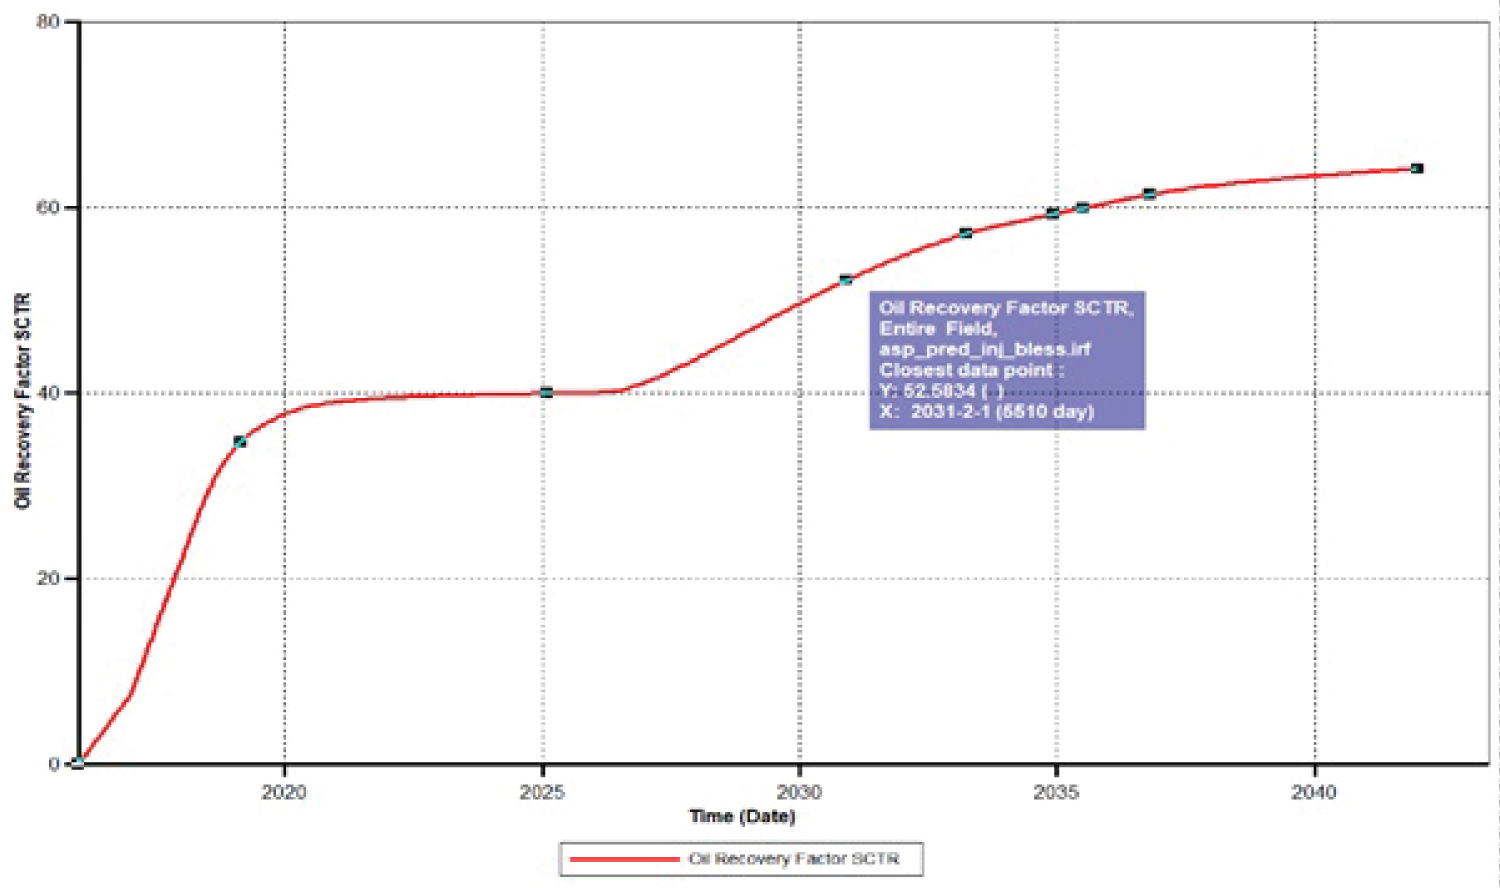
The aim here is to increase the recovery factor as far as EOR is concerned since it is a function of fluid displacement mechanism. At the end of the base case, it is possible to easily evaluate the hydrocarbons recovery factor of field A123. CMG software provides this value automatically after simulation. In a reservoir solely dependent on natural reservoir pressure, we notice a high ORF (oil recovery factor) which starts with a value of 39.8698 and remains stable till the end of simulation to a value of 40.3613. This curve encounters an abrupt increase and become constant because of absence of pressure regulation, the value of the RF is over the one note in [22]. It is further notice that, the ORF at the end is similar to the gas recovery factor (GRF) reason being that, the gas is dissolved in oil. The Figure 5 presents the perfect curve description of the cumulative fluid rates of a typical well production without any injection process.
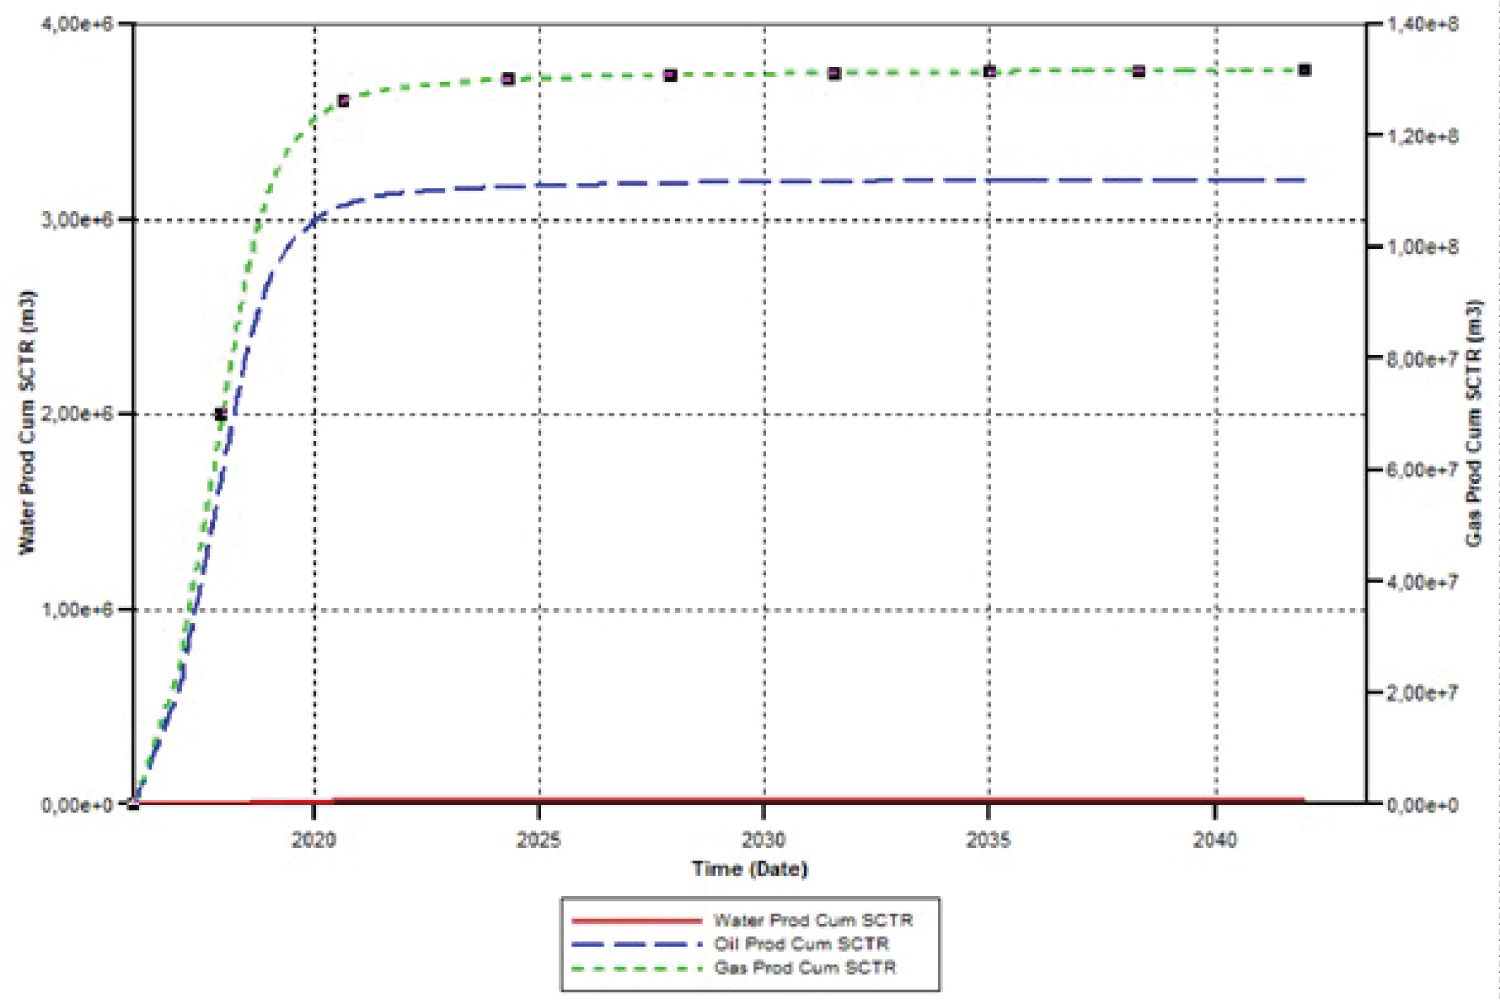
A direct increase of production is notice from the Figure 5 and a steady production rate follows. Cumulative fluids produced (CWP), starts at 0.00e + 0 m3and ends at 20767.2 m3 in 2042 which is not that significant because of the absence of water intervention during this production. Both CGP and COP 0.00e0 m3 at the beginning of the simulation and when the well was opened, they increased to 1.31596e + 008 m3 and 3.20457e + 006 m3 respectively and stabilize with a slide increase throughout the years of simulation. The above parameters explain the high productivity of this field only at the very beginning of production simulation. Below are the results and interpretation of the field with the injection of Alkaline, polymer and surfactant.
Results of the first scenario: Polymer injection
The first scenario consists of the simulation of 10 years of primary production, followed by 7 years of secondary production by injecting water then 2 years of polymer injection and finally 7 years of water flooding. The production quantities of the fluids are being summarized in the table below. Taking in to consideration the concentration of polymer injected to be 2.25412e-007 mol with a volume of 4800 m3. A quantity of 32 millions of barrils was produced with polymer injection, this productivity increasement is revealed in [23] with his study case field in Dalia (Angola). The Table 4 gather the additional quantity of fluids produced with the injection of polymer.
Daily production rates also vary during polymer injection. The different flows of oil production during the first scenario are represented in Figure 6.
From Figure 6, it can be observe that a small increase in production rate caused by polymer injection that is 397.704 m3/day in the year 2033 as compare to that of the base case which was 1.39993 m3/day. The increase caused by polymer injection is small because of a small concentration of the injected polymer. Polymer injection has therefore contributed to the improvement of the production rate but also boosted the reservoir pressure [24]. A variation in reservoir pressure is also observed. The pressure varies from a value of 2760.01 kPa in the beginning of the polymer injection (2033) to 4599.1 kPa at the end of the injection (2034). This is due to the action of the water bringing additional energy to the tank. The force acquired by the water through its injection rate provides additional energy to the aquifer which in turn acts on the reservoir. When polymer injection is stopped and conventional water injection begins, a slight pressure drop is observed for sometimes and then further stabilizes with a pressure of about 3288.77 kPa and remains fairly constant until the end of production. The water injected into the aquifer acts both as a pressure booster and improves the scavenging as shown in Figure 7.
A combination of Figure 6 and Figure 7 (oil production rate and average reservoir pressure respectively) can help to estimate the sweep efficiency since both are directly promotional. Hence if the pressure increases, the most be a relative increase in the quantity of oil produced (GIAN, 1995). The recoveries obtained after polymer injection are shown in Figure 8.
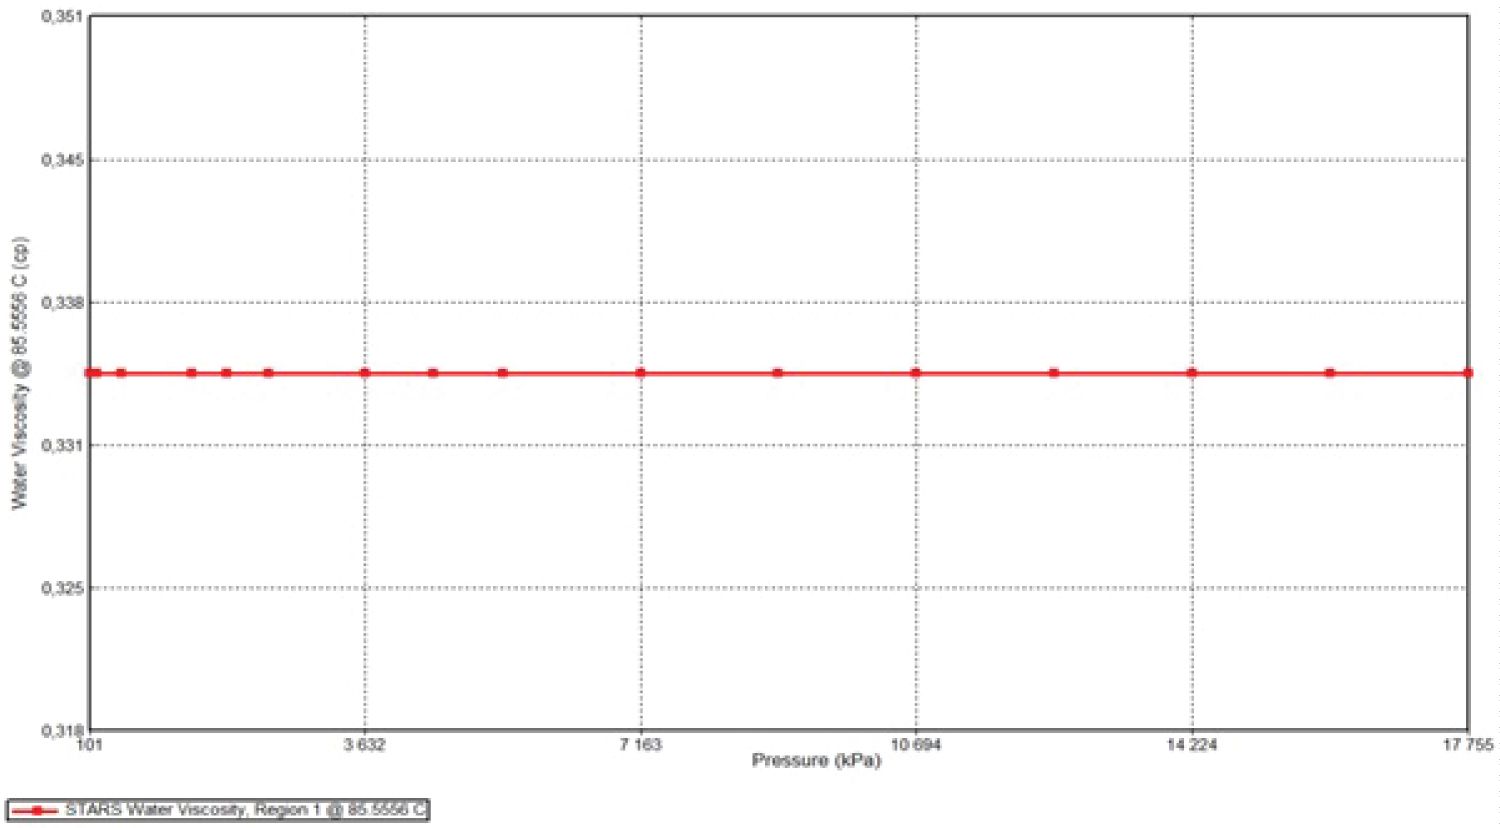
In Figure 8, the recovery factor of oil at the end of the first scenario is 64.1554. This is a significant increase compared to the previous scenario. The polymer due to its viscosifying effect has thus improved the sweeping of a large amount of oil and the effect of shear thickening such as precise in [2]. Figure 9 shows the evolution of the water viscosity during the scenario.
In Figure 9, the main effect of the polymer in the reservoir is to improve the mobility of the water by increasing the viscosity of the water. Indeed, a polymer injection is successful when an oil bank is formed that is displaced by the water bank without digitations. The viscosity range is too small that is from 0.335cp to 0.468 cp. It can therefore be said that the polymer effect was not successful as the hydrocarbon sweep, this is due to its low concentration. This results also influences the parameter of the capillary number. Indeed, the increase of the viscosity of water induces the increase of the capillary number.
Results of the second scenario: AS injection
The second scenario describes a 7 years of water injection preceded by 2 years of AS with known concentrations (about 0,004710122 mol for alkaline and 6,54e-0,6 mol for surfactant) are injected and followed by 7 years of drainage by conventional water injection. As in the first scenario, tests were carried out and the production quantities of the fluids are being summarized in the Table 5.
Figure 10 shows the evolution of oil production rates during the second scenario.
In Figure 10, from 2026 onwards, the production rate increase from 25.4546 m3/day to 407.511 m3/day and all this occurs during the 10 years of water injection. During A-S injection, also its observe a slight decrease in the production rate for the next 2 years (from 397.704 m3/day to 255.334 m3/day). Reason being that the concentration of A-S is small during the injection and the soap generated by the reaction of alkali is not enough to reduce the interfacial tension between oil and the reservoir. Once the environment returns to equilibrium, the flow rare stabilizes at 131.974 m3/day then slowly decreases until the end of the flow rate to the value of 100.698 m3/day. Figure 11 explains pressure change with respect to time, this curve changes as different solutions are being injected.
It is seen that, the pressure increases from 2803.37 Kpa to 3401.17 Kpa at the beginning of the A-S injection till the end. When A-S injection is stopped and conventional water injection begins, a slight pressure drop is observed for sometimes and then further stabilizes with a pressure of about 3320.577 Kpa and finally reaches the pressure of 3327.02 Kpa at the end of production.
Results of the third scenario: ASP injection
The third scenario involves a combined injection of alkali -surfactant-polymer over 2 years and to improve reservoir productivity. The combine is the most chemical EOR process because it improves both pore scale and volumetric sweep efficiency. The first slug comprises of alkali and surfactant injection with known concentrations (0.00499012243 mol of alkaline, 4.53647494e-006 mol of surfactant and 1.81458998e-006 mol of polymer) which mobilizes residual oil rapped in the pore space then follows the injection of a known concentration of polymer slug to improve the mobility ratio. Finally, the use of water flooding is to optimize the chemical recovery. The production quantities are summarized in Table 6.
Figure 12 shows the production rate of oil for an ASP injection.
In Figure 12, the observation done is that the production rate for this scenario has improved as compare to others. During the injection one notice that at 2026 there is an increase in the production rate from 25.446 m3/day to 397.707 m3/day then a slight decreased till 2034 to 320.285 m3/day. Finally, the slope becomes constant till the end of the production with a production rate of 123.472 m cube/day in 2042. This typically describe the scheme follow in [2]. The variation of the reservoir pressure for scenario 3 is shown in Figure 13.
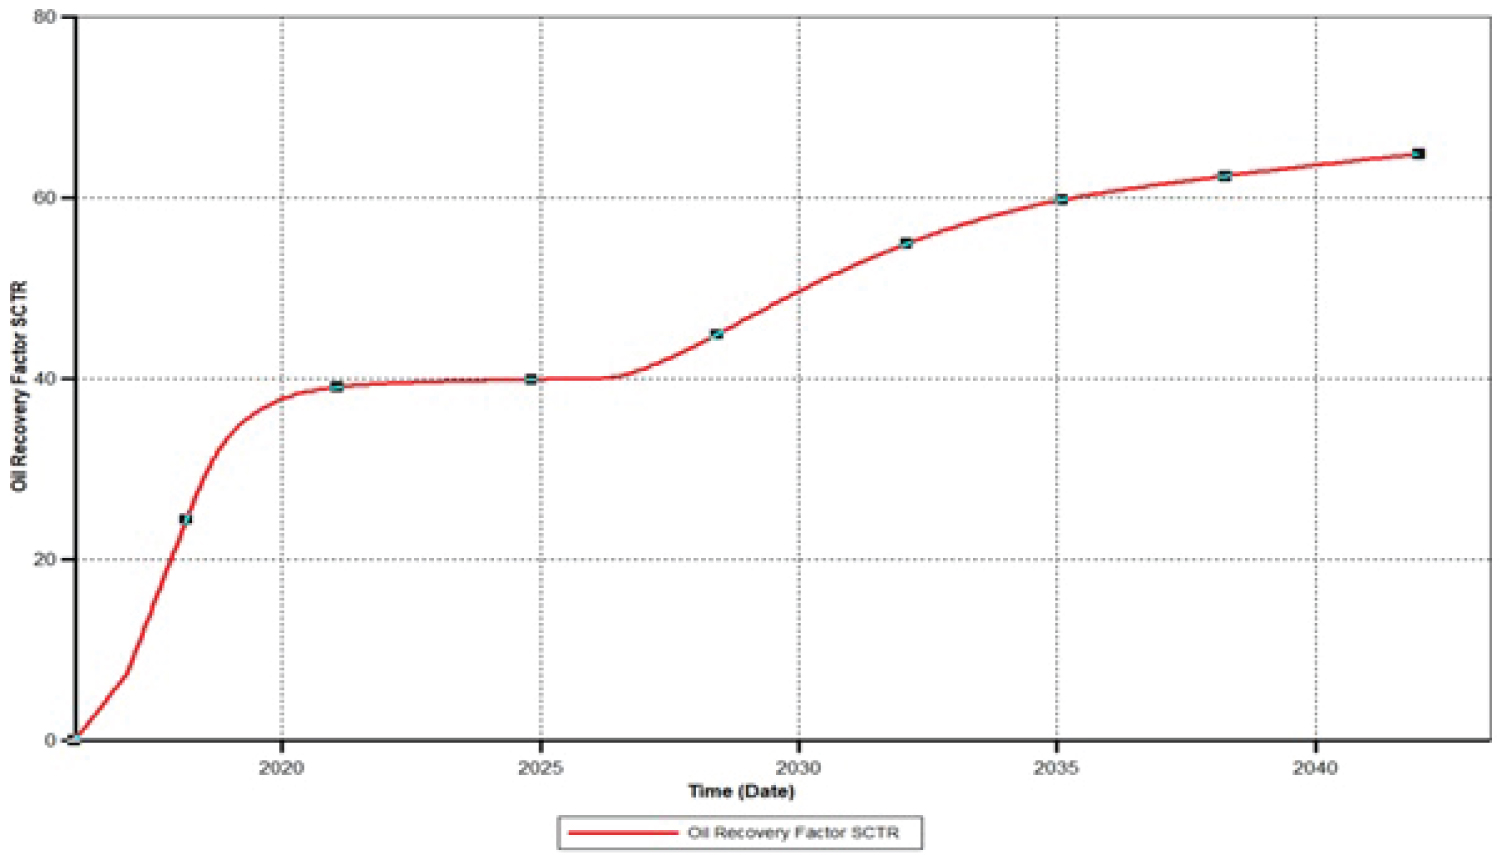
In Figure 13, the pressure of the reservoir starts increasing from 1236.62 Kpa to 2802.69 Kpa for the first 7 years of water injection. Furthermore, another increase in pressure is mark for the next 2 years to 3429.06 Kpa. It then stabilizes at 3364.86 Kpa till the end of our production. The oil recovery factor of scenario 3 is shown in Figure 14.
In Figure 14, the rise in oil recovery is due to alterations of the contact angle between the oil-water for rock equilibrium, which mobilizes more oil. As observe in this scenario the oil recovery increases to about 64.8056 at the end of the production. This is due to the injection of the ASP chemicals.
Economical evaluation
Table 7 summarizes the results obtained at the end of the work. Referring to the recovery factors, the most cost-effective scheme appears to be the third scenario: the combined injection of ASP.
In all development project, the priority is to offer the most qualify product respecting API restrictions at a minimum cost. Hence this aspect in this paper is the most important since after which the validation or rejection of the project depends entirely in the economic evaluation. The economic results of this study are shown in Table 8. It is consider that the price of oil is 70.90 USD per barrel and gas 2.49 USD per barrel, the price of polymer, surfactant, and alkaline are 990, 1005 and 150, respectively from and their quantities is 4800 tons each.
With a net present value of 873,484,102 USD, scenario 3 is the most economically viable, followed closely by scenario 1 with a NPV of 868,476,994. Thus, although scenario 2 remains less profitable than the injection of simple polymers.
Conclusion
This paper aim to improve the productivity of the field A123 with chemical enhanced oil recovery by using injection of alkaline, surfactant and polymers through numerical simulations on CMG. To achieve this, field A123 has 5 active wells including four producer wells and one injector well. This included the definition of study scenarios, namely the base case with 26 years of primary production, scenario 1 consisting of primary production and polymer injection, the scenario 2 consisting of primary production followed by alkaline, surfactant injection and scenario 3 which involved the combination of the three previous scenarios. The different quantities of fluid obtained were presented, the pressure variations during the scenarios, the recovery factors, the mechanisms related to each scenario and their economic evaluation. Indeed, at the end of this process, a recovery factor of 40.3613 for the base case, 64.1554 for scenario 1, 64.2026 for scenario 2 and 64.8056 for scenario 3 was obtained. Added to this, oil recovered for scenario 3 was 5.14538 × 10⁶ barrels, significantly higher than the other scenarios carried out. Economically, the injection of polymers surfactant and alkaline also appears to be better with a net present value of 873,484,102 USD compared to 868,476,994 USD for the single polymer injection and 402,976,482 USD for the alkaline, surfactant injection alone. The application of these three methods in combination not only promotes mobility control and sweep efficiency through the use of polymers but also optimizes the action exchange capacity of the rock/crude/brine system through the migration of fine particles from the formation and the increase in the pH of the medium. The objectives of this work have therefore been achieved.
References
- Phukan R, Subrata B, Tiwari GP (2018) Enhanced oil recovery by alkaline‑surfactant‑alternated‑gas/CO2 fooding. Journal of Petroleum Exploration and Production Technology, 1-14.
- Don WG, Willhite GP (1998) Enhanced Oil Recovery (Vol. 6). Texas SPE (Society of Petroleum Engineers).
- Olajire AA (2014) Review ofASP EOR (alkaline surfactant polymer enhanced oil recovery) technology in the petroleum industry: Prospects and challenges Energy 77: 963-982.
- Pal N, Saxena N, Mandal A (2018) Characterization of alkali-surfactant-polymer slugs using synthesized gemini surfactant for potential application in enhanced oil recovery J Pet Sci Eng 168: 283-300.
- Bashir A, Haddad SA, Rafati R (2018) Experimental investigation of nanoparticles/polymer enhanced CO2-foam in the presence of hydrocarbon at high-temperature conditions. SPE Int Heavy Oil Conf Exhib, 10-12 December, Society of Petroleum Engineers, Kuwait City, 1-13.
- Gabriel A (1979) Economic Value of biopolymers and their use in enhanced oil recovery, Polysac-charides and Polysaccharases, Academic press.
- Raffa P, Broekhuis AA, Picchioni F (2016) Polymeric surfactants for enhanced oil recovery: A review. J Pet Sci Eng 145: 723-733.
- Samanta A, Ojha K, Sarkar A, et al. (2011) Surfactant and surfactant-polymer flooding for enhanced oil recovery. Adv Pet Explor Dev 2: 13-18.
- Pogaku R, Mohd Fuat, Sakar S, et al. (2017) DNA Polymer flooding and its combinations with other chemical injection methods in enhanced oil recovery. Polym Bull 74: 1-22.
- Cheraghian G, Hendraningrat L (2016) A review on applications of nanotechnology in the enhanced oil recovery part A: Effects of nanoparticles on interfacial tension. Int Nano Lett 6: 129-138.
- Sheng JJ (2011) Modernchemical enhanced oil recovery theory and practice United States Elsevier.
- Kompendium KJ (2009) Reservoir Recovery Techniques. Trondheim: NTNU.
- Ahmed T (2010) Reservoir Engineering Handbook. (4th edn), Burlington: Gulf Professional Publishing, ELSEVIER.
- Nelson RC, Lawson JB, Thigpen DR, et al. (1984) Co-Surfactant Enhanced Alkaline Flooding. SPE 12672.
- Olsen DK, Hicks MD, Hurd BG, et al. (1990) Design of a Novel Flooding System for an Oil-Wet Central Texas Carbonate Reservoir. SPE20224, presented at the SPE Seventh Symposium on Enhanced Oil Recovery.
- Chul JJ, Ke Z, Hyun CB, et al. (2012) Rheology and polymer flooding characteristics of partially hydrolyzed polyacrylamide for enhanced heavy oil recovery. J Appl Polym Sci 127: 4833-4839.
- Dang C, Nghiem L, Nguyen N, et al. (2018) Modeling and optimization of alkaline-surfactant-polymer flooding and hybrid enhanced oil recovery processes. J Pet Sci Eng 169: 578-601.
- Sheng JJ (2017) Critical review of alkaline-polymer flooding. J Pet Explor Prod Technol 7: 147-153.
- CMG (2015) Chemical EOR Simulation. Calgary CMG.
- René C (1988) Le gisement. Paris: InstittutFrancais du Pétrole.
- Muggeridge A, CockinA, Webb K, et al. (2014) Enhanced oil recovery and technological limits. Phil Trans.
- Morel D, Vert M, Gauchet R, et al. (2012) First polymer injection in deep offshore field Angola recent advances in the Dalia Camelia field case. (Vol. 1). Dalia Camelia Oil Gas Facilities.
- Willhite GP, Randall SS (2011) Polymer Flooding. Richardson Society of Petroleum Engineers.
Corresponding Author
André Chéagé Chamgoué Department of Petroleum and Gas Engineering, School of Geology and Mining Engineering, University of Ngaoundere, P.O. BOX 115, Meiganga, Cameroon
Copyright
© 2023 Mbouombouo CIR, et al. This is an open-access article distributed under the terms of the Creative Commons Attribution License, which permits unrestricted use, distribution, and reproduction in any medium, provided the original author and source are credited.