The EU 2030 Renewable Energy Vision - Can it be more Ambitious?
Abstract
Setting a renewable energy (RE) target necessitates a comprehensive assessment of its impacts on the energy system and at the macroeconomic level in the European Union (EU). The decision of the EU about the renewable energy target is based on such impact assessments. We postulate that the EU could be more ambitious with respect to the RE target without endangering economic growth in the EU. We review fifteen impact assessment studies of the EU's energy transition in this paper. We classify and interpret the modelling used in these studies and their results, apply descriptive statistics and analysis, and show how model features and input parameters influence the impacts of different shares of renewable energies (RE) on the energy system and the wider economy. The variety of input factors and modelling approaches used explain the diverging results of the assessments. There are two crucial criteria to measure the impact: First, gross domestic product (GDP), which is the best indicator of overall change. GDP considers fossil fuel imports, prices, domestic additional generation and investments, and shows the resulting impacts of changes in these factors on welfare in monetary units. Second, energy system costs indicate what it costs to achieve a target and how efficiently this is done. We conclude that the European Union could feasibly increase its share of renewable without any negative impact on the economy, especially in the light of recent cost developments.
Keywords
Renewables, Economic impacts, Energy policy, Impact assessment, Energy transition
Abbreviations
CCS: Carbon Capture Storage; CO2: Carbon Dioxide; EC: European Commission; ECB: European Central Bank; EE: Energy Efficiency; ETP: Energy Technology Perspectives; EU: European Union; GDP: Gross Domestic Product; GHG: Greenhouse Gas; IEA: International Energy Agency; IRENA: International Renewable Energy Agency; LCOE: Levelised Cost of Energy (electricity); MWh: Mega Watt Hours; PV: Photovoltaic Energy; RE: Renewable Energy; RES: Renewable Energy Source; RES-E: Renewable Energy - Electricity; SD: Sustainable Development; WEO: World Energy Outlook
Introduction
In the Paris agreement, countries agreed on limiting global warming to less than 2 ℃ in order to restrict dangerous climate change. The European Union (EU) accounts for around 10% of global CO2 emissions [1]. In addition, at least some European countries have a forerunner role in decarbonising their energy system and have set ambitious emission targets.
While the EU currently strives to reach their 2020 emissions and renewables targets, targets for the period after 2020 are under discussion. As for 2020, three separate climate and energy targets will be determined. A greenhouse gas emissions target is accompanied by a renewables (RE) and an energy efficiency (EE) target. The two ladder targets are defined in order to ensure the timely development and implementation of RE and EE measures. Both are supposed to be needed in the long term to achieve sufficient levels of decarbonisation. Such technologies are supported today to benefit from declining overall costs of decarbonisation in the future and account for necessary market uptake times.
The target levels were pre-set in 2014 when the EU Energy Council agreed on a 40% greenhouse gas (GHG) reduction target compared to emissions in 1990, a 27% renewables target (share of RE final energy demand) and a 27% efficiency target (reduction of energy consumption compared to projections). However, already then, the European Parliament favoured a RE target of at least 30%. In the light of the Paris agreement and given the recent auction results for renewables support, a broader discussion about adapting the target level especially of the RE target has taken place and resulted into a RE target of 32%.
We postulate that even a more ambitious RE target would have no negative economic and societal impact in the EU because the underlying assessments rely on very restrictive assumptions regarding input factors and modelling issues. We conduct a review of the main impact assessment studies by comparing the applied approaches and results. We classify and interpret the research and modelling on that topic, show how impacts of different shares of RE on the energy system and the wider economy are influenced by model features and input parameters and finally provides suggestions regarding future impact assessments. So far, no review of impact assessment studies, on which the EU has based its RE target decision, exists.
The paper is structured as follows: Section 2 gives an overview of the studies considered in the analysis. Section 3 explains our methodological approach, i.e. which indicators we use for our analysis and which are relevant for deciding about a suitable RE target. Section 4 discuss critical issues influencing modelling results. In Section 5, impacts at the macro and system level are critically reviewed. Section 6 concludes and gives policy implications.
Literature Reviewed
This review focuses on impact assessment studies based on scenario development of future energy systems, on modelling of energy system and macroeconomic impacts. To limit the variety and due to comparability reasons (of scenarios) we mainly aim at recent studies covering the development in the EU up to 2050. Comparing the outcomes of the various studies is a challenging exercise, as the existing studies vary substantially in terms of their model type and philosophy, assumptions on input factors, technologies included, regional and sectoral focus, time horizon and modelling objective, e.g. analysing pathways for further decarbonisation, assessing impacts of RE on various economic sectors. Table 1 gives an overview of the studies assessed in this paper [2-24].
The studies differ greatly, for example by their geographic and sectoral coverage, time horizon, models, included technologies, analysed impacts, level of aggregation, assumptions on prices and costs as well as by the implemented targets. For example, some studies include a RE target or energy efficiency target as constraint of the modelling approach, while others only set a GHG target for selected regions, sectors and technologies. Furthermore, different modelling approaches are used some focussing on a low cost solution, others implement target oriented solution, or apply a equilibrium based systems depicting the national industries or generation technologies in high resolution; or focus on the energy system while others include macroeconomic effects or even societal impacts e.g. impacts on health. Overall, a structured approach is required to review these impact studies.
Apart from modelling approaches or impact assessments of the EU energy transition, we find a rich literature on studies analysing the long-run interactions between renewable energy use, energy efficiency, GHG emissions and economic growth (e.g. [25-29] based on historic data. The studies rely on an econometric approach and show a positive relation between energy consumption and economic growth and GHG emissions from the past till today. For our review we focus on studies investigating the impact of ambitious future RE, EE and GHG targets.
Data and Methodological Approach
Reviewing impact assessments and comparing results entails a kind of reference basis. As there exists no "standard" assessment method, and as the research questions, objectives, depicted impacts and input factors strongly varies from assessment study to assessment study, we identify basic criteria on which our review and analysis relies on. These criteria encompass:
• Modelling issues and input factors affecting the outcomes (impacts)
• Targets the study is based upon
• Impacts depicted in the study
Modelling issues and Input factors affecting the outcomes of impact assessments
Impact assessments rely on a variety of different modelling approaches. In our analysis we differentiate between:
• Energy system models and
• Macroeconomic models.
The first depicts which RE technologies are used for energy generation and assess the costs at the energy system level. Macroeconomic models depict the economic impacts, mainly on GDP and employment. Modelling results rely on different model types and philosophies which have an impact on the model outcome.
Besides the modelling approach, input factors substantially impact modelling results. For example assumptions regarding technology availability and costs, fuel prices and discount rates are necessary for modelling effects of different RE shares. These assumptions can have significant impacts on the competitiveness of RE, and therefore the economic feasibility of higher RE shares. Therefore, we have a closer look at:
• Levelised cost of energy (LCOE): Assumptions regarding technology cost developments up to 2030 or beyond are not only crucial for technologies that are currently still in the research and development phase (such as new nuclear, CCS), but also for more established technologies (wind, photovoltaics (PV)). If they are lower than conventional based energy generation, models will report an increase RE use.
• Discount rates: Under a cost perspective, high discount rates render technologies with low initial investments and high fuel and maintenance costs (such as gas-fired power plants) more attractive than those with initially high investments and low operating and maintenance costs (such as solar and wind or nuclear power plants). Thus, their magnitude influences the generation technology mix in energy system models.
• Technology availability: Assumptions regarding the availability of technologies are an important driver for model results concerning RE. The availability of different technologies in models (or scenarios) can, for example, be restricted due to uncertain technological developments or political decisions. Modellers account for high uncertainties of future developments by including high discount rates or technology costs, both reducing their likelihood of being part of the model solution. Technological availability influences the share of renewables necessary to reach GHG reduction targets.
• Fossil fuel prices: There are significant uncertainties attached to the assumptions about the future development of fossil fuel prices due to their price volatility in the past. This means there are high uncertainties surrounding the calculated cost-effectiveness of renewables and deployment levels in the various models. As higher fossil fuel prices make RE relatively cheap, assumptions on fossil fuel prices are crucial factors in models.
Targets of impact assessment studies
In the context of the EU climate policy, RE targets as well as increases in energy efficiency (EE target) will be needed to reach ambitious carbon reduction targets (GHG target). The assessment studies incorporate often very different target combinations. Between these main targets - i.e. GHG, RE and EE targets - multiple interactions exist. As a consequence of the interactions between the three targets, it is necessary to define well-harmonized target levels. For the renewable target, this implies that very ambitious targets are potentially only useful in combination with more ambitious GHG reduction and EE targets, as otherwise necessary cost-effective GHG emissions reductions e.g. in industry and agriculture are postponed, and possible stranded investment in CO2-intensive products and processes might occur.
Due to the variety of targets and the importance of well-harmonized target levels, we include in our approach the target levels of:
• Renewable energy deployment target (RE target)
• Energy efficiency (EE target)
• Carbon reduction target (GHG target)
The interrelations of EE, RE targets and policies and carbon pricing mechanisms are generally accounted for in energy system models.
Impacts of renewable energy use
Renewable energy shares influence the energy system and the wider economy and society in many different ways. Often, some impacts are negative, others positive. E.g., higher RE shares might increase energy system costs but at the same time create higher employment rates. Overall, there are a variety of impacts at different levels. In a first step we categorize these impacts. A suitable way for this is a differentiation by level:
• The energy system level,
• Macro level and
RE impact the energy system by influencing costs of electricity and heat generation and costs in the transport sector. Moreover, RE lead to changes in the environmental impact of the energy system (by reducing GHG emissions as well as other air pollutants, but also by changing land use patterns) and affect security of supply (by reducing dependency on fossil fuel imports, yet also increasing flexibility requirements in the electricity sector [30,32,33]. On the energy system level, the following indicators can be applied to describe RE impacts:
• Energy system costs: Comprise the investment, maintenance, operation, transportation and distribution costs of different technologies that produce, supply and transport energy or reduce energy consumption (e.g. EE options). The system costs vary in granularity and technologies included in the system. In many studies, system costs of a reference situation and scenarios with e.g. high RE shares are compared [4,13,34,35] Some studies assess abatement (e.g. [10]) or substitution costs (e.g. [8]) instead.
• Investment requirements: Indicate average, annual or cumulated investments to achieve the targets [3,4,8,16-18, 20,21].
• (Avoided) emissions of GHG and other air pollutants: Are expressed in quantity or monetary units by various studies [2,4,9,10,16,20,22]. Avoiding GHG is the main driver of all policy and thus a major decision criterion.
• Reduced imports of fossil fuels: Are expressed in quantity or monetary units and assessed in many impact studies for the energy system [4,8,14].
• System adequacy: Is used to address the impact of renewables on short term security of supply in the power sector. It refers to the ability of the power system to meet the aggregate demand of all consumers at virtually all times. It is addressed for example in [7] or [11].
• RE also have impacts at the macro level i.e. the economy and society as a whole. They affect economic activities and welfare, health and wellbeing as well as the environment. Effects of RE at the macro level are analysed by a number of authors [4,13,34-40]. Commonly applied assessment criteria on the macro level are the following:
• GDP (gross domestic product): Shows how much a country "earns" or "loses" if more or less RE are used. It is often used as a proxy for welfare.
• Net employment: Economy-wide impact on the number of jobs due to increase in RE deployment. Employment impacts can be either cumulated additional jobs over the total period or the number of jobs in the year(s) of consideration. The latter might vary over time because investment activities result in temporary employment, while operation and maintenance create a small but long-lasting employment effect.
• Health effects: Often expressed in monetary values, i.e. avoided health expenditures. Used as a proxy for wellbeing.
• Avoided emissions: The assessment at the macro level can include avoided emissions outside the energy system.
On the micro level, deploying RE affects actors such as energy consumers, prosumers and generators (households and firms). These actors pay a price for energy or energy services. The price depends on the regulatory framework and the energy system and markets in which RE are deployed. For example, in the electricity sector higher RE shares cause increasing expenditures [41], while some industries benefit from decreasing wholesale prices [41-46]. At the supply side, some generators or prosumers also benefit from support policies. However, such distributional effects depend on the specific policy design and burden sharing and not on the target level. Thus, they should not be considered when assessing different RE targets.
The European Commission grounded its 2014 decision on several outputs of the impact assessment without publishing an explicit ranking or weighting of those criteria. However, in the discussions among EU member states or on national level, energy system costs are often the main criterion used for deciding about a desired RE share or other energy policies. Given the multiple and interdependent impacts of renewables, this simple view does not seem appropriate. If one single criterion were selected, the GDP or employment rates are more suitable as, at least in theory, many of the mentioned criteria are included in GDP. In the following, we discuss the main impacts employed in these studies, and which factors influence them.
Findings on Modelling Issues and Input Factors
Model types
In the following, different model types used on the energy system and macroeconomic level and their influence on results are explained in detail.
Energy system models: On the energy system level, simulation models generally represent developments of the future energy system based on costs, policies, potentials and barriers (e.g. WEM in) [9]. Optimisation models provide a least-cost solution to reach a given objective e.g. a minimum RE share taking the perspective of a central planner and ignoring non-economic barriers and behavioural aspects (e.g. METIS [47] applied in [4] and [48], and Enertile [49]).
In addition, there are mixed approaches, e.g. models with integrating partial optimisation in a simulation model (Poles [10,50] Primes [51,52]) or models focussing on a more limited scope , for example on RE only (Green-X in [53]), or on cost comparisons (REmap in [8] or [9].
Macroeconomic models: At the macro-level, a variety of approaches exists to assess impacts of RE shares on GDP and/or employment. When assessing different REtargets, it is important to analyse net impacts of RE use, which show the "sum" of all positive and negative effects including impacts of higher prices or investments. In contrast, gross impacts show the effects on the energy or "RE-sector" i.e. in manufacturing, construction, installation and operation of RE. They ignore negative effects on other sectors, especially the price effect on consumption [54] and [55] describe different macroeconomic models in more detail.
Some studies use accounting approaches to derive the impact of more Reon growth and employment. These are assessments based on coefficients e.g. jobs per installed capacity or value added. Accounting approaches are, for example, used in the Energy (R)evolution study [21,22] and in the Annual Overview Barometer 2017 [56]. The resulting job effects are gross impacts and therefore results are not suitable to assess the impact of higher RE.
More complex macroeconomic models allow interactions between sectors and actors over time. They can be classified into general equilibrium, econometric and hybrid models. The main feature of equilibrium models is the assumed limitation of production factors. Subsequently, investments in energy crowd out investments elsewhere. Therefore, equilibrium models result in smaller or negative effects of ambitious RE-deployment. The integration of different financing options mitigates crowding-out (applied with the model GEM-E3 in [3] and [4]. In contrast, econometric models are not bound to equilibrium conditions and depict effects based on estimated parameters and empirical validation. Capital for investment is in general unlimited, such that large energy investments do not crowd out other investments. To account for this unrealistic assumption, a limit for investments can be set. Econometric models tend to report more positive impacts of RE when compared to general equilibrium models (applied with the model E3Mein [3] and [4].
Hybrid models combine different features of both modelling approaches. For example, they account for behavioural aspects, but also imply some market clearing aspects. These models are rather flexible in depicting market actions, but they are not founded on a clear theoretical foundation. For example, Astra (applied in [6] and [14] is a system dynamics-based model, using neoclassical production functions with endogenous technological changes. NEMESIS (applied in [13] is an econometric simulation model based on Post-Keynesian approaches.
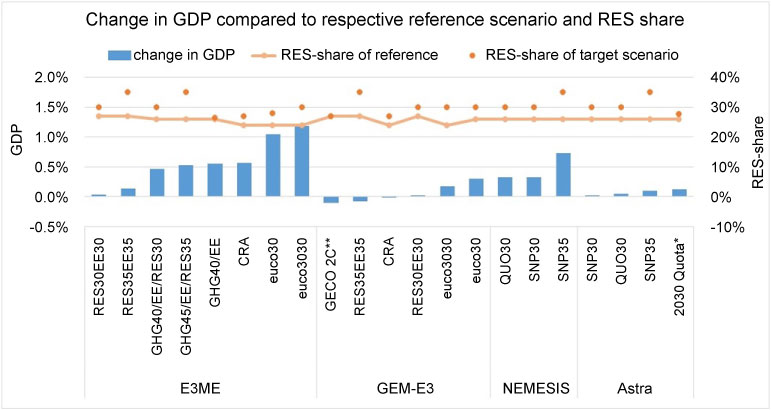
Figure 1 shows the different results of the assessments with GEM-E3 and E3ME, and NEMESIS and Astra. In the impact assessment of the EC macroeconomic impacts are assessed with GEM-3E (general equilibrium model) and E3ME (econometric model). They state substantial differences regarding the GDP and employment in all scenarios. Similar, model outputs of NEMESIS and Astra also show differing results (compare Figure 1). Due to these uncertainties the use and comparison of different macroeconomic models is recommended.
Critical input factors influencing the RE share and energy system costs
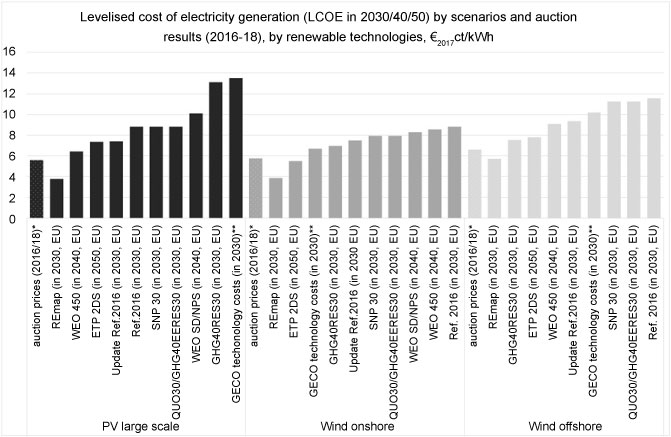
Levelised cost of energy (LCOE): The relative development of costs of conventional and RE generation, energy efficiency and CCS technologies influences the cost-effectiveness of renewables. If costs of renewables decline faster than costs of alternative technologies for energy conversion, the RE share will be higher under a cost-minimising approach. Although prices proposed by auctions do not necessarily reflect pure costs (LCOEs), they serve as an orientation for specific LCOEs. Auction prices are the result of several aspects, such as expected future market prices and technology costs when the bids are calculated, the degree of current market competition, firm strategies regarding market-entry or penalties. However, recent auction results for solar and wind are significantly lower than costs for RE electricity production anticipated in the models. PV in Germany was auctioned at 4.33 €c/kWh and 4.91 €c/kWh on average in the most recent auction rounds in February 2018 and October 2017after a steady decrease from 9.2 €c/kWh in April 2015 [57,58]. The French PV auction in March 2017 resulted in a comparable support level of 6.3 €c/kWh [59]. In comparison to these results, the assumptions of the EC [48] with 9.5€c/k Whin 2030 for PV, and even those of the EC's update [5] are very high. The differences between current auction results for onshore and offshore wind and LCOE for 2030 are of a similar magnitude.
Figure 2 illustrates assumed LCOE from wind and solar power in 2030/40/50 of EU scenarios and compares them to recent average auction results (2016/17/18) of PV and wind power in the EU. The lowest LCOE are assumed in the REmap scenario [8]; for PV and wind onshore they are even lower than recent auction results. In other scenarios, the LCOE for wind power are about 50% higher than in the REmap scenario, for PV even higher. The IEA study 14 assumes a decrease in LCOE of wind onshore of about 15% (2030) in a number of regions, which reduces LCOE to about 4.9 €ct/kWh in 2030 when assuming today's auction results. This value were above the LCOE in the REmap case far but below that of the updated values in the Non-Paper [5]. Germany, Italy in 2016/17/18; LCOE represent approximate values, depicted for 2030/40/50.
Discount rates: As explained before, under a cost minimisation approach discount rates have a twofold impact on model results, they
• Influence the resulting technology mix, as discount rates are used in the calculation of annual costs for each technology.
• Determine total energy system costs, i.e. how expensive energy use is with the given technology mix.
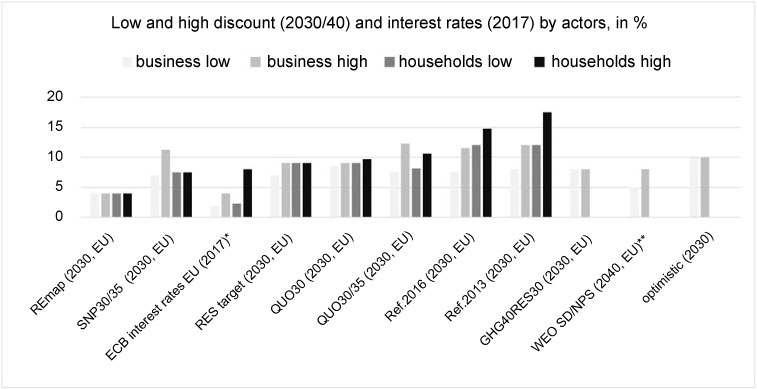
Social discount rates are applied to assess whether a specific energy system is preferential from a societal point of view. It is typically lower than private discount rates as, among others, the interests of future generations are included in the social evaluation, especially when regarding long term developments. Social discount rates are typically set between 1-7% [60].
Private discount rates reflect opportunity costs, e.g. returns and risks. They differ between actors. For industrial and commercial actors, discount rates correspond to the respective company's expected return whereas the level of suitable discount rates for households is more contested. On the one hand, households usually expect a lower rate of return to investment than commercial or industrial investors, on the other hand they might have strong time preferences, are often risk-averse and face non-economic barriers (such as a lack of information) when undertaking investment decisions.
In energy system models [4,7,10,14,16,51,61,62], typically diversified discount rates are used for different actors or sectors, depicting the individual assessment and preference of investment choices. Thus, the results represent the development of the energy system based on investment decisions by individuals and companies from different sectors.
Figure 3 depicts the minimum and maximum interest rates of medium/long-term lending for corporations and households of EU countries in 2017, which are published by the European central bank (ECB). The rates differ mainly due to the different degree of creditworthiness of EU countries. The project DIA-Core [63] analysed these country risks and found even larger deviations with rates between 3.5% to 4.5% in Germany and 12% in Croatia and Greece in 2015. Moreover, RE energy policies impact financing risks. The studies [63] and [64] show differences in the WACC of around 1.5 percentage points (wind) due to different RE policy designs. Both report that feed-in tariffs entail low risks for investors, while risks are high under fixed premiums or capacity based support schemes. If technology risks and investment barriers are low, the discount rates applied in the scenarios should be close to ECB rates (2%-8%). In Green-X modelling [12,14,53], the scenarios (SN30/35 or QUO30/30) include a standard discount rate of 7.5%, which is however adapted to prevailing policy and technology risks. In Enertile modelling [49], a flat discount rate of 7% is used while in Remap [8] 4% are applied to account for the social perspective of sustainable energy use. In [48] and [65] the private investments are calculated based on individual rates between 7.5% (business) and 14.75% (households to account for non-economic barriers) whereas a uniform discount rate of 10% is used to annualized energy cost of final consumers in 2016. In 2013, the same interest rates are used for both, cost discounting and investment decisions.
Availability of technologies: Regarding availability, the most contested technologies in the electricity sector are CCS and nuclear energy. In the case of CCS, the high costs of existing pilot projects make its wider use uncertain and therefore more "unlikely" while recent announcements [66,67] about political support for CCS makes its future deployment more likely. While nuclear energy has no carbon emissions, there are other environmental issues, e.g. radioactive waste, which also implies high costs. In the wider energy sector, the necessity and availability of hydrogen may also play an essential role for future energy supply. Also, the future availability of unconventional resources, such as shale gas, is heavily disputed. This uncertainty in the future availability of technology options which are currently not mature make it necessary for modellers to set some assumptions about their future development which can then have significant impact on resulting energy outcomes.
For example, in previous versions of the World Energy Outlook, the role of CCS was assumed to be much more prominent than in current versions [17]. On the contrary, shale gas forecasts from the U.S. Energy information administration (EIA) decreased substantially between 2011 and 2013 [68]. The energy (r)evolution scenario [21] assumes a high share of hydrogen and electricity in the transport sector, thus achieving a RES share in transport of around 60% in 2040.
In addition, as energy system modelling often extends far into the future, some technology options that are likely to develop by 2030 and beyond are subject to high uncertainty, one example for such technologies being nuclear fusion. Others might not yet be known and, therefore, not included in the modelling.
Fossil fuel prices: Due to the historic price volatility of fossil fuel prices, assumptions regarding their future development have significant uncertainties. This translates into high uncertainties regarding the cost-effectiveness of renewables and deployment levels calculated with the various models.
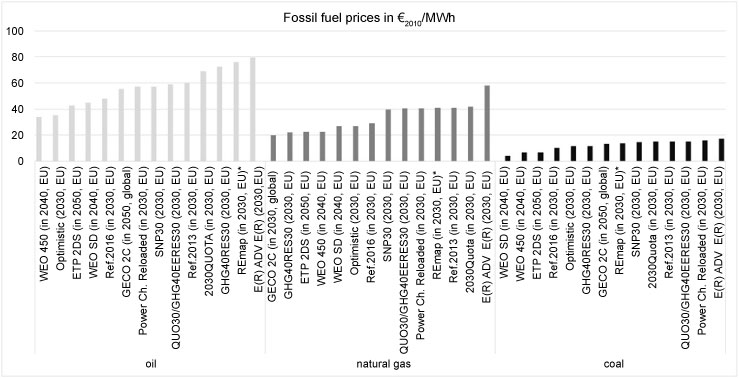
The reference scenario 2016 of the EC [4] assumes lower fossil fuel prices (see Figure 4) than that of 2013. The changes occurring between the modelling rounds illustrate the high uncertainties regarding the cost of fuel. The same is true for other repetitive studies like, for example, the World Energy Outlook (see Figure 5, WEO 450 and SD). The reload of the Eurelectric Power Choices Scenario [40] was among others conducted due to unexpected changes in international fuel prices. In general, the assumed fuel prices in the Reference scenarios [2,3] are slightly higher than those calculated in the World Energy Outlook of the IEA [17]. The differences are most pronounced when the policy scenario (450 ppm) is compared to input data of [2]. As a consequence, higher RE shares might be reached in the European Commission model. Similarly, the energy revolution and the Remap [8] scenario display high fossil fuel prices (see Figure 5) and high RE shares while fossil fuel prices are low in the GECO 2C [23] and optimistic scenarios [7]. Because higher fossil fuel prices make RE relatively cheap, RE shares are higher and costs at the system level are lower in those scenarios and vice versa.
Applying exogenous fossil fuel prices across different scenarios relies on the assumption that changes in the scenario do not impact global demand for fossil fuel. For European studies, this assumption might hold if only the EU realises measures for GHG reduction and other world regions follow business-as-usual pathways. The potential change in fuel costs is considerable if countries globally act for climate mitigation (e.g.) [10,16,23].
Targets and Impacts of Higher Renewable Shares
Depending on the modelling approach and input factors, the impacts of different RE shares differ substantially between the studies assessed. In this Section, we give an overview of the different results.
Targets and achieved RES shares
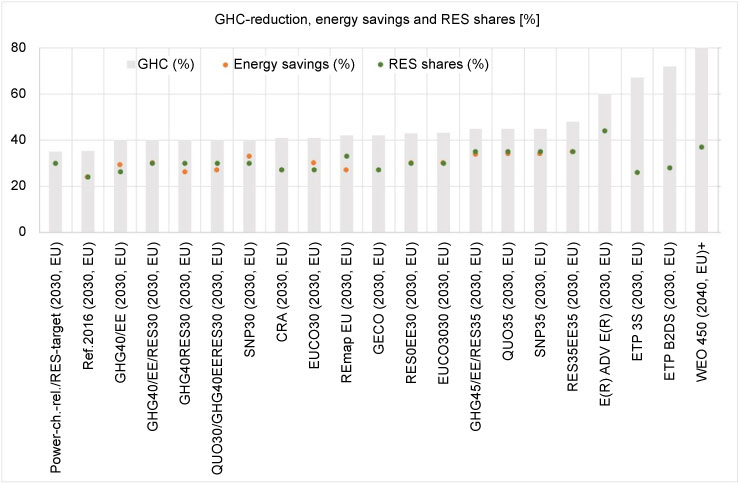
Figure 5 illustrates the GHG emission targets, energy savings and renewable energy share (RES share) of scenarios that include the EU, showing the targets and shares for the year indicated in the scenario name. Global scenarios in studies such as the WEO or the ETP strive for ambitious emission targets which are in line with RES shares around or above 27%. It is noteworthy that, in some studies, the results for 2030 are only interim results. There are several scenarios that focus on the EU and display a RES share of 30% or higher, such as the REmap EU(IRENA) case, the QUO/SNP30/35 scenarios (TU Vienna/Fh-ISI), GHG40RES30 (Enerdata), euco3030 and GHG40/EE/RES30/35 (PRIMES), and E(R)a (Greenpeace). As can be seen in Figure 5, there is a slight correlation between GHG, RES shares and energy savings in EU scenariosb, displaying consideration of target interactions.
aBased on primary energy demand.bRE targets represent a constraint in the modelling approach such as a minimum RE level. RES shares are the results the applied measures (reflect achievement) and are not necessarily identical with RE targets. Here: the RES share is equal or larger than the RE target.
Macro-level impacts
The impacts of the deployment of RE on GDP and employment are disputed as they depend strongly on the underlying model philosophy. Figure 1 depicts impacts on GDP modelled by the E3ME and GEM-E3 models with a limited capital availability and crowding out effect, respectively. For the impact assessment of the European Commission (2016) [3], the results of a 30% RE target (euco3030) assessed by two models indicated a decrease of +0.2% of GDP (GEM-E3) versus an increase of +1.2% of GDP (E3EM). The non-paper study [5] with its updated technology costs reports very small positive changes for a 30% RE share, while for 35% RE share, the differences become more pronounced between the two models (GEM-E3: -0.08%, E3EM +0.14%). There is another study [13] with a dedicated impact assessment of higher RE targets commissioned by the EC, which forecasts an increase in GDP by 0.3% for a target of 30% (SNP30) and by 0.7% for a target of 35% (SNP35) with the NEMESIS model, while the results of the Astra model are lower, 0.02% and 0.1% respectively. The GECO-study of 40 reports very small negative or zero impacts for the EU if revenues from CO2 taxes are redistributed accordingly.
Moreover, Figure 1 indicates the RE shares of the scenarios and the respective references. However, most of the scenarios do not only differ by their RE share but also by their GHG-reduction target and EE target. Therefore, changes in GDP cannot directly attributed to increases in RE shares.
Three messages can be drawn from Figure 1:
(1) The impacts on GDP depend on the type of model applied. This becomes evident by two comparisons the same bundle of scenarios, one assessed by E3ME and GEM-E3, and the other assessed by NEMESIS and Astra.
(2) An ambitious RE target of 30% or 35% results in an increase in GDP in all models except for the GEM-E3, which displays very small negative impacts.
(3) Increasing the RE share to 30% increases GDP except for GEM-E3. The scenarios GHG40/EE (26.5% RE share) and GHG40/EE/RES30 (30% RE share) as well as euco30 (27% RE share) and euco3030 (30% RE share) only differ by their RE share while the two other targets are kept constant. In addition, the reference scenario of RES30EE30 only differs by its RE share. Subsequently, the difference between these pairs of scenarios can be assigned to renewables. It is positive for the "euco-scenario" and the RES30EE30 in the E3ME and slightly negative in the GEM-E3 model. In the other scenarios, further targets in addition to the RE target change as well.
In summary, the impact of RE use on GDP is small, mainly positive but highly dependent on the employed model type. Thus, an RE share of 30% or 35% seems to be feasible without negative impacts on GDP.
Regarding avoided GHG emissions, the reviewed studies all use scenarios with a reduction of GHG emissions of at least 40% in 2030 compared to 1990 (see Figure 1). Some scenarios go beyond this target, e.g. REmap, SNP/QUO35, GHG45/EE/RES30 or RES35EE35.
The reduction of fossil fuels imports is considered as benefit as it reduces import dependencies and increases value added, and hence GDP. Studies with a RE target of 30% or more result in significant reductions of fossil fuel imports. They report savings ranging roughly between 20 bn€2010 and 78 bn€2010. Import reductions increase with increasing RE shares and EE targets [2,4,10-12,14,21,23]. Import reductions also tend to be higher in scenarios with rising fossil fuel prices. However, this is not always the case: the Enerdata study shows significantly higher reductions in fossil fuels imports than the IRENA-REmap study, albeit higher fossil fuel prices and RE share in the REmap study.
The impact of RE on the reduction of health costs are assessed only in [2,8,10]. They do not differ substantially between the different studies as they are mostly linked to the GHG emission reductions (at least 40% reduction target). In the respective impact assessment they vary between scenarios (40% GHG target) by about 10-46bn €2010, and within the scenarios up to 37 bn €2010.
Impacts on energy-system level
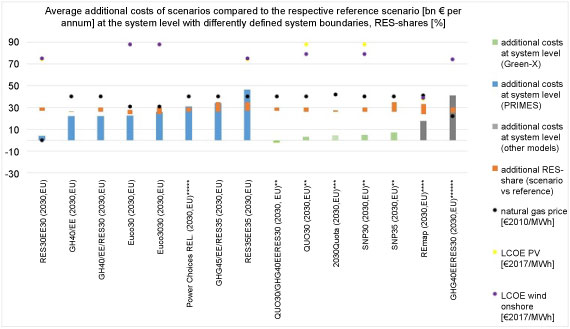
In many studies, energy system costs are not clearly defined and therefore, cannot be compared easily. Some scenarios include all energy system related expenditures such as conventional and RE generation, production, transmission, distribution, infrastructure, consumption, others exclude some of them. Figure 6 illustrates the additional costs at the system level and contrasts them by their model inputs regarding fossil fuel prices, LCOE for PV and wind onshore and RE shares of the scenarios and their references. Figure 6 reveals three main messages:
First, additional costs at the system level highly varies among the studies. While some scenarios with RE shares of 30% report high additional costs (euco3030), others report low costs, for example RES30EE30 or even savings, for example REmap. However, the latter excludes some cost components such as investments into infrastructure, flexible demand and supply.
Second, technology costs have a significant impact on the energy system costs: A comparison between the Remap [8] and GHG40RES30-scenario [10] does support the rational that low technology costs and discount rates as well as high fossil fuel prices result in low (system) costs of RE expansion or even savings. In addition, in 2018, the EC has published a non-paper [5] presenting modelling results with updated technology costs. As all other assumptions were kept constant compared to [4], the resulting difference between the euco3030 and the RES30EE30 scenario in Figure 6 illustrates the huge effect of cost assumptions.
Third, a comparison between five pairs of scenarios (euco30/3030 [4], GHG40EE/RES30 [2], GHG40/GHG40RES30 [10], Power choices /RE target [11], RES27EE30/RES30EE30) [5], in which only RE shares of the scenario increase while GHG and EE targets remain constant, displays in three of them no or a small increase in energy system costs. Accordingly, a 30% share in RE deployment is possible without further energy system cost increases.
With respect to energy prices of final consumers, the impact of higher RE shares on consumers depends, among others, on their impact on electricity prices. Whether they increase with increasing RE shares depends on the RE policy design and on the assumed technology costs. Even lower electricity prices than today are feasible if the levelised cost of energy and cost of capital are sufficiently low (e.g. REmap). Regarding competitiveness, two rationales exist. First, a higher RE share implies higher installation rates of RE energies in the European Union(EU) countries. This could have a positive impact on the profitability and competitiveness of the European manufacturing and service industry in the REsector. Second, higher energy prices in industries, especially in energy intensive industries, push product prices and hence weaken the position of the European industry. None of the analysed studies explicitly addressed this issue.
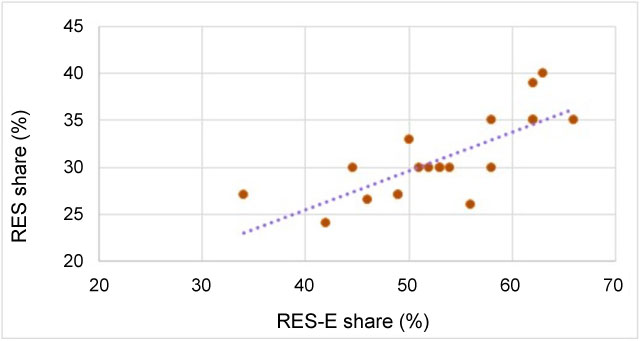
When increasing the RE share of final gross energy consumption, the share in final electricity consumption and production increases as the reviewed studies show (Figure 7). Higher renewable energy electricity shares (RES-E) call for an increasingly flexible electricity system. Subsequently, security of supply, i.e. system adequacy in the electricity sector needs to be closely monitored due to increased need for flexibility to ensure that demand and supply are met at all points in time.
Conclusions and Recommendations
Based on these analyses, we conclude that a more ambitious RE target up to 35% appears to be a feasible objective for 2030 as it would not have negative economic and societal impacts in the EU. We found that (1) The impacts of a higher RE share on GDP and health are projected to be positive and (2) Overall energy system costs display a small or no increase at all.
• The additional costs at the system level vary between scenarios with high RE shares predicting high additional, low or no costs, but it becomes clear that increasing RES shares do not necessarily go hand in hand with increasing system costs. They are driven by fossil fuel prices, discount rates and technology costs. But it should be noted that energy system costs indicate how much and how efficiently resources are spent at the system level to achieve the energy targets. They are a kind of efficiency indicator. Therefore, we suggest a strong transparency in the selection of the three main input factors and their rational.
• The effect of increased RE on reducing health costs is only assessed in a few studies and they do not differ substantially between the different studies as they are mostly linked to GHG emission reductions. Thus, GHG emission reductions could be used as a proxy.
• Impacts on the economy (GDP) depend on the type of model applied as the restriction on available capital for investments is decisive but vary by model type. Therefore any modelling approach should report explicitly how capital constraints are included in the model.
• Albeit many critics, GDP is the criterion that best reflects all the changes, i.e. in fossil fuel imports, prices, additional domestic generation and investments, and shows the resulting impacts on welfare in monetary units. Complemented with health impacts and avoided emissions, it is an appropriate set of indicators that is so far available.
• Further, our findings strongly support our statement that the assessments, on which the EC based its decision of the RE target, rely on some restrictive assumptions regarding input factors and modelling issues. The analysed modelling results are determined by fossil fuel prices, technology costs, discount rates, which all vary greatly between these studies.
• For example, low fossil fuel prices make conventional energy sources more attractive, and in combination with high discount rates and technology costs, the attractiveness of RE declines even more as compared to conventional sources. Especially, assumption regarding the oil and gas price vary across the scenarios and studies showing a low high share of RES apply low fuel prices. As fossil fuels are globally traded we suggest a simple approach: using one plausible global price development for a strong RE deployment scenario.
• Another example is the selection of a suitable discount rate. It depends on the objective of the study: (1) Fore valuating the benefit of energy systems based on renewables for society, social discount rates are applied. (2) For modelling individual investment decisions and the effects of different policy settings on the technology mix of a system, individual discount rates are applied. A good proxy for these discount rates are opportunity costs based on costs of capital, including risk aversion and non-economic barriers. (3) For assessing the costs of an energy system that is based on renewables, also individual discount rates accounting for opportunity costs and investment risks but not for non-economic barriers are used. We found that the applied discount rates vary across the assessments reflecting different levels of cost of capital, risks or barriers. As investments in mature RE technologies such as wind onshore or solar power are low risk investments that require high upfront capital expenditures, the use of high discount rates discriminates RE. Our review shows that 1) Discount rates of mature technologies such as wind and solar power are significantly above the current lending rates and 2) Studies with low discount rates report high feasible RES shares. We suggest to specify in the studies the reasons for the selected discount rates (social, private, system) and apply discount rates for mature technology close to long-term lending rates.
• Technology costs depend on assumptions made regarding diffusion and technological learning as well as other factors such as availability of land, other resource costs, market development and degree of market competition. The review shows that 1) Studies with low LCOE report high feasible RES shares, and 2) The assumed future LCOE are in many studies above the current prices of wind or solar power submitted in auctions. Assumptions on future prices are crucial, because declining prices in combination with the availability of technology, for example hydrogen in the transport sector, significantly contributes to an increase of the renewable energy share in the transport sector. And in light of the increasing significance of electricity for heating/cooling and transport in the scenarios, RE will play a crucial role in the power sector. As wind power is likely to be the largest contributor to RE electricity generation in the EU, its cost development is especially important. Thus, a lower electricity production cost of wind power might considerably affect total energy system costs. We therefore suggest taking into account recent auction prices as one among other proxies.
Increasing RES shares call for a close monitoring or the system adequacy in the electricity sector. A higher RE target in terms of final energy consumption leads to a substantial share of variable renewables in the electricity sector. Even though a very high share of renewables is technically feasible, the system might need time and additional flexibility to adjust to higher RE shares. According to a recent studies [56], the flexibility of the EU member states' power system has been sufficient in 2016.
Although industrial competitiveness and energy poverty are generally not considered in the studies, these need to be taken into consideration when designing support policies and burden sharing regulation. An appropriate burden sharing or redistribution might positively affect GDP. Some studies [23,69,70] include in their macroeconomic modelling distributional aspects, and find that a redistribution of burdens of households positively contributes to economic growth.
There are two rationales with regard to competitiveness: First, a higher share of RE implies higher installation of RE in the European Union (EU) countries. This could positively influence the profitability and competitiveness of Europe's manufacturing and service industry in the RE sector. Second, higher energy prices for industry, especially in energy-intensive sectors, have a knock-on effect on product prices and therefore weaken the competitiveness of European industry. However, none of the analysed studies addressed this issue explicitly.
Finally, a significant increase in the RE target without adapting the GHG target can decrease efforts in energy efficiency and other investments in decarbonisation. Thus, if adjusting the RE target, the other targets should also be reassessed. Subsequently, we are in line with [71] and call for a coordination of targets for GHG reduction, RE and EE.
Acknowledgement and Disclaimer
This research is based on a review done for the European Parliament. The views expressed in this review are in the sole responsibility of the authors and do not necessarily reflect the views of any institutions engaged in renewable energy issues.
References
- Olivier JGJ, Janssens-Maenhout G, Muntean M, et al. (2016) Trends in global CO2-emissions. 2016 Report, The Hague.
- European Commission (2014) Impact assessment accompanying the communication. A policy framework for climate and energy in the period from 2020 up to 2030.
- European Commission (2016) Accompanying the document proposal for a directive of the european parliament and of the council amending directive 2012/27/EU on energy efficiency.
- European Commission (2016) Impact assessment accompanying the document proposal for a directive of the european parliament and of the council on the promotion of the use of energy from renewable sources (recast).
- European Commission (2018) Non-paper on complementary economic modelling undertaken by DG ENER regarding different energy policy scenarios including updated renewable energy technology costs in the context of Council and parliament discussions of the recast of the renewable energy directive and the revision of the energy efficiency directive.
- Fraunhofer ISI, Frauhofer ISE, IREES, et al. (2017) Energy Economics Group, Vienna, TEP Energy GmbH. Mapping and analyses of the current and future (2020-2030) heating/cooling fuel deployment (fossil/renewables): Final report on: Work package 3 - Scenarios for heating & cooling demand and supply unteil 2020 and 2030; Work package 4 - Economic Analysis. prepared for European Commission, DG Ener.
- Kema Consulting GmbH (2014) Integration of renewable energy in europe: Final report.
- Irena (2018) Renewable energy prospects for the European Union.
- Iea, Irena (2017) Perspectives for the energy transition: Investment needs for a low-carbon energy system.
- Enerdata (2014) Costs and benefits to eu member states of 2030 climate and energy targets.
- Capros P, Vita A de, Tasios N, et al. (2018) Power choices reloaded: An update of the power choices study with updated assumption and a new set of variant scenarios analysing the effects of deviations from the cost-optimal pathway.
- Fraunhofer Isi, Eeg, Ecofys, et al. (2016) Policy Dialogue on the assessment and convergence of res policy in eu member states: Final report. IEE.
- Duscha V, Fougeyrollas A, Nathani C, et al. (2016) Renewable energy deployment in Europe up to 2030 and the aim of a triple dividend. Energy Policy 95: 314-323.
- Fraunhofer Isi, Energy Economics Group, Vienna, et al. (2014) Employment and growth effects of sustainable energies in the European Union: Final Report. DG Ener.
- Fraunhofer ISI, Fraunhofer ISE, EEG, et al. (2014) Estimating energy system costs of sectoral RES and EE targets in the context of energy and climate targets for 2030: Report; federal ministry of economic affairs and energy.
- IEA (2017) World energy outlook paris.
- IEA (2016) World energy outlook, Paris.
- IEA (2016) Energy technology perspectives. OECD Publishing.
- IEA (2015) Energy Technology perspectives 2015. OECD Publishing.
- IEA (2017) Energy technology perspectives.
- Greenpeace International (2015) Energy [R]evolution: A Sustainable world energy outlook 2015 - 100% renewable energy for all. (5th edn).
- Greenpeace (2014) Roadmap for Europe: Towards a sustainable and independent energy supply: The Energy (R)evolution for the EU 28.
- Kitous A, Keramidas K, Vandyck T, et al. (2016) Global energy and climate outlook road from paris: Impact of climate policies on global energy markets in the context of the unfccc paris agreement.
- Keramidas K, Kitous A (2017) Global energy and climate outlook 2017: Greenhouse gas emissions and energy balances: Supplementary material to "Global Energy and Climate Outlook 2017: How climate policies improve air quality".
- Bekun FV, Agboola MO (2019) Electricity consumption and economic growth nexus: Evidence from maki cointegration. EE 30.
- Bekun FV, Alola AA, Sarkodie SA (2019) Toward a sustainable environment: Nexus between CO2 emissions, resource rent, renewable and nonrenewable energy in 16-EU countries. Sci Total Environ 657: 1023-1029.
- Bekun FV, Emir F, Sarkodie SA (2019) Another look at the relationship between energy consumption, carbon dioxide emissions, and economic growth in South Africa. Sci Total Environ 655: 759-765.
- Emir F, Bekun FV (2018) Energy intensity, carbon emissions, renewable energy, and economic growth nexus: New insights from Romania. Energy & Environment.
- Itodo IA, Safaeimanesh S, Bekun FV (2017) Energy use and growth of manufacturing sector: Evidence from Turkey. Academic Journal of Economic Studies 3: 88-96.
- Breitschopf B, Held A, Resch G (2016) A concept to assess the costs and benefits of renewable energy use and distributional effects among actors: The example of Germany. Energy & Environment 27: 55-81.
- IRENA, CEM (2014) The Socio-economic benefits of solar and wind energy.
- Fraunhofer ISI, Gesellschaft für Wirtschaftliche Strukturforschung mbH (GWS) (2010) Einzel- und gesamtwirtschaftliche Analyse der Kosten- und Nutzenwirkungen des Ausbaus Erneuerbarer Energien im deutschen Strom- und Wärmemarkt: Studie im Auftrag des Bundesministeriums fur Umwelt, Naturschutz und Reaktorsicherheit.
- Hirth L, Ueckerdt F, Edenhofer O (2015) Integration costs revisited - An economic framework for wind and solar variability. Renewable Energy 74: 925-939.
- Lehr U, Lutz C, Edler D (2012) Green jobs? Economic impacts of renewable energy in Germany: Energy Policy 47: 358-364.
- Ortega M, Rio Pd, Ruiz P, et al. (2015) Employment effects of renewable electricity deployment. A novel methodology. Energy 91: 940-951.
- IRENA (2018) REmap - Renewable Energy Roadmaps: Regional and global analyses.
- Burgos-Payan M, Roldan-Fernandez JM, Trigo-Garcia, et al. (2013) Costs and benefits of the renewable production of electricity in Spain. Energy Policy 56: 259-270.
- Wei M, Patadia S, Kammen DM (2010) Putting renewables and energy efficiency to work: How many jobs can the clean energy industry generate in the US? Energy Policy 38: 919-931.
- Breitschopf B, Nathani C, Resch G (2013) Employment impact assessment studies - Is there a best approach to assess employment impacts of ret deployment?: Renewable energy law and policy review 93-104.
- Barbose G, Bird L, Heeter J, et al. (2015) Costs and benefits of renewables portfolio standards in the United States. Renewable and Sustainable Energy Reviews 52: 523-533.
- Grave K, Breitschopf B, Ordonez JA, et al. (2015) Prices and costs of eu energy: Final report. DG Ener.
- Grave K, Hazrat M, Boeve S, et al. (2015) Electricity cost of energy intensive industries: An international comparison.
- Sensfub F (2008) Assessment of the impact of renewable electricity generation on the German electricity sector. An agent-based simulation approach. VDI Verlag, Dusseldorf.
- Cludius J, Hermann H, Matthes FC, et al. (2014) The merit order effect of wind and photovoltaic electricity generation in Germany 2008-2016: Estimation and distributional implications. Energy Economics 44: 302-313.
- Krozer Y (2013) Cost and benefit of renewable energy in the European Union. Renewable Energy 50: 68-73.
- Cludius J, Forrest S, MacGill I (2014) Distributional effects of the australian renewable energy target (ret) through wholesale and retail electricity price impacts. Energy Policy 71: 40-51.
- Dg ener. metis (2016) Modelling the European Energy System - Energy - European Commission.
- European Commission (2016) EU Reference Scenario 2016: Energy, transport and GHG emissions. Trends to 2050.
- Fraunhofer ISI. Enertile (2018) Computational analysis of Electricity markets and infrastructures.
- Enerdata (2018) POLES model: Global energy supply, demand, prices forecasting model.
- E3MLab (2018) Primes model, Version 6, 2016-2017: Detailed model description.
- E3 Modelling (2018) E3 Modelling 2014.
- Energy Economics Groups (EEG) (2015) Fraunhofer ISI. Background report on costs and benefits of RES in Europe up to 2030.
- Breitschopf B, Nathani C, Resch G (2011) Review of approaches for employment impact assessment of renewable energy deployment.
- Mercure JFA, Knobloch F, Pollitt H, et al. (2016) Policy-induced energy technological innovation and finance for low-carbon economic growth. Study on the macroeconomics of energy and climate policies. Report.
- Observ'ER, Renac, ECN, Fraunhofer ISI (2018) The state of renewable energies in Europe, 2017. Observ'ER, Paris; 2018.
- Bundesnetzagentur (2018) Ausschreibungen 2015 und 2016: Ergebnisse der sechsAusschreibungsrunden fur PV.
- Bundesnetzagentur (2018) Ausschreibungen 2017 - Ergebnisse der Ausschreibungsrunden fur Solar-Anlagen 2017; 2018.
- http://taiyangnews.info/markets/france-awards-520-mw/.
- Stern N (2006) The Economics of climate change: The stern review. Cambridge University Press.
- Capros P, Paroussos L, Fragkos P, et al. (2014) European decarbonisation pathways under alternative technological and policy choices: A multi-model analysis. Energy Strategy Reviews 2: 231-245.
- Despres J (2015) Modelling the long-term deployment of electricity storage in the global energy system.
- Boie IB, Breitschopf A, Held M Ragwitz, et al. (2016) Policy dialogue on the assessment and convergence of res policy in eu member states: Final report of DIA-CORE.
- Giebel O, Breitschopf B (2011) The impact of policy elements on the financing costs of RE investment - the case of wind power in Germany.
- European Commission (2013) EU reference scenario 2013: EU energy, transport and GHG emissions, trends to 2050.
- Rathi A (2018) Trump was forced to sign a bill supporting technologies to fight climate change.
- Waltzer K (2018) The role of 45q carbon capture incentives in reducing carbon dioxide emissions: fact sheet and analysis. Cleanair task force.
- EIA (2013) Technically recoverable shale gas and shale oil resources: An assessment of 137 shale formations in 41 countries outside the united states.
- Da Silva Freitas, Lucio, Flavio (2016) The distributional effects of emissions taxation in Brazil and their implications for climate policy: Energy Economics 59: 37-44.
- Labandeira X, Labeaga, Jose M, et al. (2009) An integrated economic and distributional analysis of energy policies. Energy Policy 37: 5776-5786.
- Schlomann B, Eichhammer W (2014) Interaction between climate, emissions trading and energy efficiency targets. Energy & Environment 25: 709-731.
- European Commission (2016) Proposal for a Directive of the European Parliament and of the Council amending Directive 2012/27/EU on Energy Efficiency.
- European Commission (2016) Proposal for a Directive of the European Parliament and of the Council on the promotion of the use of energy from renewable sources (recast) IA EED 2016.
- Employ RES (2014) Employment and growth effects of sustainable energies in the European Union. Final report.
- Fraunhofer ISI (2016) Mapping and analyses of the current and future (2020 - 2030) heating/cooling fuel deployment (fossil/renewables).
- GECO (2016) Global Energy and Climate Outlook 2017: Greenhouse gas emissions and energy balances.
Corresponding Author
Barbara Breitschopf, Competence Center Energy Policy and Energy Markets, Fraunhofer Institute for Systems and Innovation Research ISI, Breslauer Str. 48, 76139, Karlsruhe, Germany.
Copyright
© 2019 Breitschopf B, et al. This is an open-access article distributed under the terms of the Creative Commons Attribution License, which permits unrestricted use, distribution, and reproduction in any medium, provided the original author and source are credited.