Earth Diseases, Exploding Stars & Sea Ice Footprints - Part One
Abstract
The Supernova and Nova Impact Theory, SNIT, has purposed that pandemic diseases occur on Earth due to exploding star debris streams impacting our planet. A number of cases involving this phenomenon have been mentioned in papers by the author on internet. New information concerning the SNIT has become available as new papers were published. The new information is used in these results involving average velocity of debris streams between exploding star remnants and Earth. The locations of sea ice melts at both poles versus month and nova or supernova maximum hotspots have been analyzed for nova WZ Sagittae. Proof of changing WZ Sagittae average Alaskan temperatures verify SNIT model.
Keywords
Warming, Global, Supernova, Nova, Pandemics, Sea ice, Black plague
Introduction
In the beginning of the SNIT, it was assumed that the average velocity of an exploding star between the remnant and our planet was the same for all cases being studied. The mathematical relationship used to predict the impact time for debris stream of an exploding star is
ETA = Constant ΔTL + TL (1)
Where
ETA = Year of Impact
ΔTL = Light years from Earth to remnant
TL = Age of remnant or year visible light of the explosion was seen
The knowledge of the average velocity between supernova, SN, 1006 and Earth became known due to many temperature records being set on Earth in the year 2012. The Constant in equation (1) for SN 1006 is 0.13337. The average velocity between Nova WZ Sagittae and Earth became known due to the recent impact of the 2001 major outburst of WZ Sagittae that was flagged by a Martian dust storm, an extensive ice melt at both poles, and extreme high temperatures in the Barents Sea. The Constant in equation (1) for this case of the WZ Sagittae major outburst is 0.119. The average velocity is higher when the distance between our planet and the remnant is a minimum. This is simple physics because the shorter distance of travel provides less resistance for the velocity of the debris stream.
It is possible to assume the constant of equation (1) varies linearly with distance for any exploding star being considered.
Constant = (0.13337-0.119) (NRD-142)/(7543-142) + 0.119 (2)
Where
NRD = New remnant Distance
Case 1 exploding star R Aquarii
An explosion occurred on the star R Aquarii about 190 years ago that created a debris stream directed toward our solar system from a distance of 710 ± 40 light years [1,2]. Using equation (2) for this case
Constant = 0.1201
The correction to the time the explosion was seen is
Constant ΔTL = 85.27 ± 4.8 years
Giving
ETA = 190-85.27 ± 4.76 years
ETA = 104.73 ± 4.76 years ago
ETA = 2018-104.73 ± 4.76 years ago = 1913.27 ± 4.76 years ago
The 1918 influenza epidemic lasted from January 1918 to December 1920, the period of time that particles from the R Aquarii explosion where causing the disease upon earth. The disease affected 500 million people and 3 percent of the world's population was destroyed [2].
Case 2 exploding star WZ Sagittae
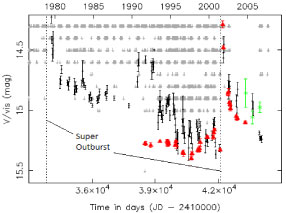
The exploding star WZ Sagittae is a recurrent nova. It has super and normal outbursts that have occurred at various time intervals as shown in Figure 1 [3].
The nova WZ Sagittae is 142 light years from Earth on the constant for equation (1) is 0.119. The oubursts of WZ Sagittae impact Earth 16.9 years after they are seen; so, 16.9 years must be added to the times of the outbursts in Figure 1 to obtain the impact years. Figure 1 came from reference [3] and shows different visible outburst times for Nova WZ Sagittae between 1978 and 2001 super outbursts. There is a recorded super outburst in 1946, but it appears the debris stream does not form or impact Earth.
The location of the western terminus longitude of WZ Sagittae is 65 degrees east and it has a CAM date of July 20 [4]. The eastern terminus is 115 degrees west longitude and it has a CAM date of January 20 [4]. The western and eastern termini are the points of maximum debris particle densities and the CAM dates are the times they occur.
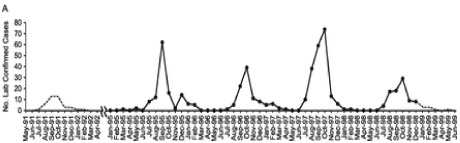
Figure 2 [5] shows the bubonic or black plague cases for Madagascar caused by nova WZ Sagittae for various years all starting in July. The CAM date of July 20 and Longitude of 65 degrees east certainly fit Madagascar.
The eastern terminus for WZ Sagittae at 115 degrees west longitude places the black plague in the western USA. The CAM date of January 20 should be near the time of the western USA cases, but the author does not have this information. The western USA and Madagascar locate the latitudes for the northern and central tine for Satan's pitchfork on different dates for this case.
The SNIT theory proposes that the Leonids meteor storms originate from the explosions of WZ Sagittae and therefore outbreaks of plague should be a result that correlates with large Leonids meteor showers [6].
Case 3 exploding star Vela Jr
The distance to supernova Vela Jr is 652 light years. The Constant in equation (1) is 0.12 and the correction term is 78 years. The explosion was seen at 1250 AD giving the impact time as 1328 AD. The fourteenth century Black Death was in India in 1334 AD. In places in Europe, the Black Death killed 50 percent of the population.
The western and eastern termini for the debris stream of supernova Vela Jr in 1328 AD are 114 west and 66 east longitude, respectively (Table 1 pg 139). The Black Death should be most severe at these locations in the northern hemisphere because solar gravity focusing produces maximum particle density at these points. The high particle density point moves from west to east and back to west between the longitudes of the termini. The western hemisphere near St. Louis, USA and India in the eastern hemisphere fit these longitude locations.
The disappearing culture of Cahokia, an ancient city near the location of St Louis in North America could be explained by the Black Plague of the 14th century [7]. The location matches the longitude of the western terminus of the Vela Jr supernova.
The high debris particle point also moves north to south in 11 year cycles due to the varying magnetic field of the Sun. Table 2 [6] lists European, India and China plagues attributed to supernova Vela Jr. Notice the latitude range in Table 1 and Table 2 is much smaller than the longitude range.
The two impacts in Table 2 in the year 1334 are frontal and zonal. The frontal impact is in China when the debris stream is making contact with the planet. Frontal impacts are not restricted to the 180 degrees between the western and eastern termini. The zonal impact is in India when the planet is moving into the existing zone of the eastern terminus of the debris stream. It must be remembered that the high density longitude is a circular area that may be 30 degrees wide and not a point.
Case 4 exploding star SN 1054
The distance of SN 1054 is 7,175 light years. Using equation (2) with thee known distance gives a constant for equation (1) of 0.13267. The time the light was seen 1054 AD. The correction term is 952 years. Using equation (1) gives the impact time of 2006 AD.
The plague cases maximize as shown in Figure 3 [8] in the year 2006. Since SN 1054 is so far away the correction term is large and the accuracy is extraordinary.
When studying the calving of glaciers in Antarctica, The deflection area, DA, of SN 1054 was found to match the longitudinal degree range for the moose die off in the northern USA. It is safe to say the plague cases match the same DA zone with some variation in longitude and latitude degrees due to the times of death being in different years in the USA.
When discussing the region of maximum debris stream particle density, WT, DA, and ET are east, central, and west longitudinal locations and north, central, and south tines of Satan's pitchfork are north south locations that occur at all focal points.
The DA area of SN 1054 caused the USA extensive flu outbreak in 2017 and is expected to repeat in 2020. Other years of large flu outbreak are predicted for the USA [9].
Case 5 wz sagittae mumps outbreak in Alaska
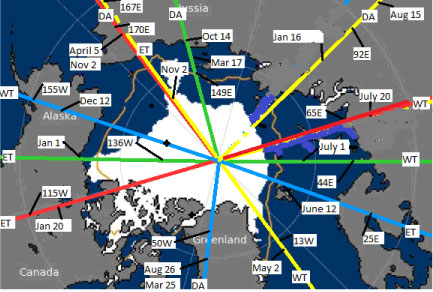
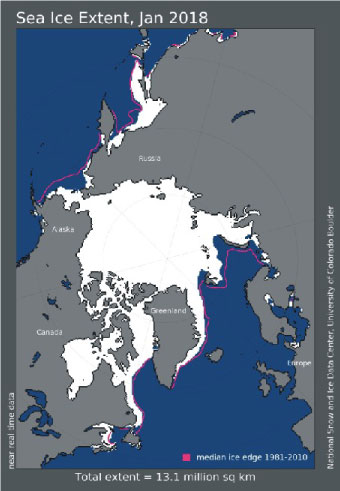
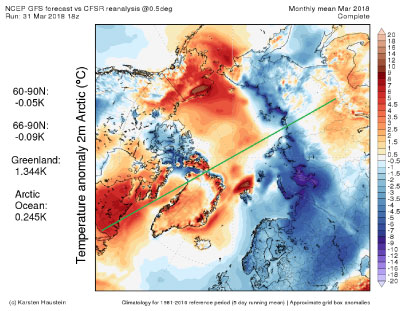
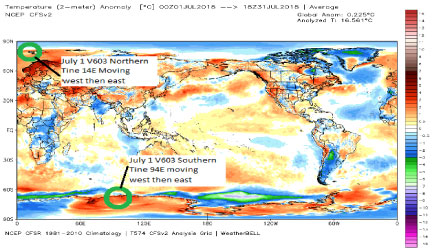
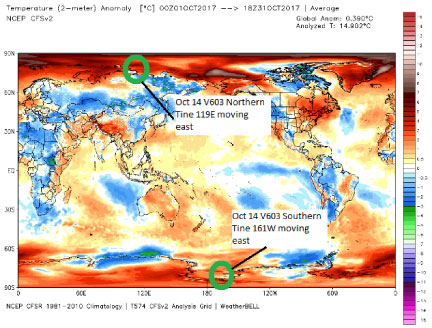
The northern tine of the eastern terminus of WZ Sagittae produces a mumps outbreak in Alaska starting in 2017 and continuing into 2018. Figure 4 shows the western terminus, deflection area, eastern terminus, and longitudinal locations with CAM dates for the four active energy sources, exploding star debris streams, that are causing global warming. The data are plotted on the Arctic minimum sea ice background for 2018.
Since each line represents a maximum incoming particle density, each line also represents a location of incoming maximum kinetic energy which will be converted to heat that will melt sea ice. The equations for L, longitude, and RA, right ascension, on page 136 of reference [4] are used to generate all the data in Figure 4. The only independent variable required is the right ascensions for the four exploding stars.
The calculation assumes the earth is simply a sphere orbiting the sun and does not consider the earth's magnetic field. The magnetic field density of the earth increases as either pole is approached. The higher values of magnetic field density closer to the poles cause the incoming charged particle debris stream to be deflected and the longitudes vary from the calculated values shown in Figure 4 and Table 3. Any heat transfer expert can see the warm lines need to be rotated 30 degrees clockwise to match the sea ice melt pattern shown in Figure 4. Using the concept of a symmetric magnetic field and knowing the magnetic field is in the opposite direction at the South Pole provides a rotation of 30 degrees in the counter clockwise direction at the South Pole. Simply stated incoming charged debris streams will rotate 30 degrees west at the North Pole and 30 degrees east at the South Pole. These simple rules will be used to show polar sea ice melts match the predicted locations of hotspot storms created by the incoming debris streams from the four exploding stars.
The data in Figure 4 are color coded and the red line tagged as 115W, Jan 20, and ET is the eastern terminus of nova WZ Sagittae. Rotating this line 30 degrees west gives a west longitude of 145 degrees. The west longitude for Anchorage, AK is 150 degrees.
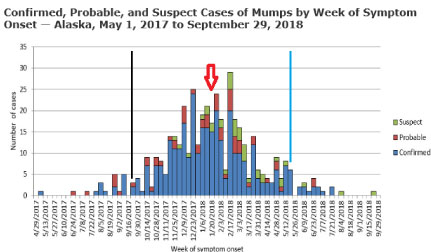
Figure 5 shows 391 cases of mumps that happened in Alaska and 351 cases occurred in Anchorage, AK [10]. The red arrow shows the CAM date of January 20 when the maximum disease particle density will be near Anchorage. The black line date indicates the approach of the focal point of maximum density from the east and the blue line indicates the direction of the dates when the focal point of maximum density returns to the west. The occurrence of mumps cases maximize when the eastern terminus of WZ Sagittae is over Anchorage, AK near CAM date January 20, 2018.
There are more examples of this disease debris transmitted phenomenon from exploding stars in the referenced papers of the author. One exceptional example is the death of thousands of oblong nosed antelope in Asia in May of 2014. The cause of death was attributed to internal ruptured organs. The deflection area zone's longitude of SN 1006 was correlated with the kill zone of the antelopes and a large sea ice melt region in Antarctica.
Supernova 1006 & 1054 and Nova WZ Sagittae & V603 Aquilae Focal Point Locations
Table 3 shows the calculated CAM dates, longitudes, ET, DA, and WT for the active debris streams of the four exploding stars bombarding our planet. The color on the name in the first line of Table 3 matches the color for the debris stream in Figure 4. The yellow lines in Figure 4 are for supernova, SN, 1006. The lines are the calculated longitudes for the hottest locations on the globe, but the focal points shown in Table 3 are at continuous longitudinal locations as they cycle between western and eastern termini locations. The January 20 eastern terminus location used in the mumps disease case is in the fourth line of the table. Each exploding star has two different dates for crossing DA locations, but only one date for an eastern or western terminus which are lines that are not crossed.
V603 aquilae sea ice footprints
The four maximum incoming stream density times will be studied next for nova V603 Aquilae.
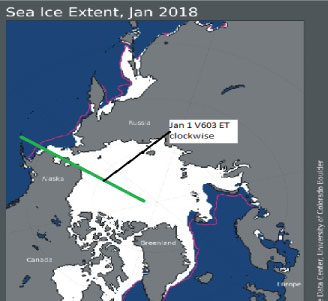
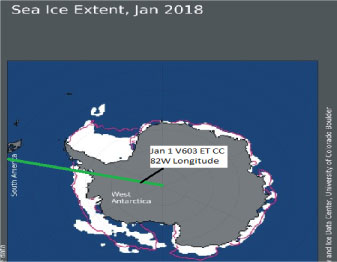
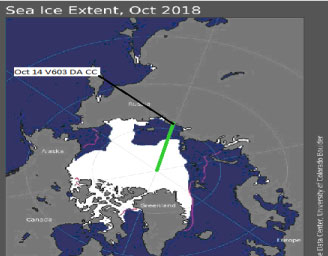
V603 January 1 sea ice melt
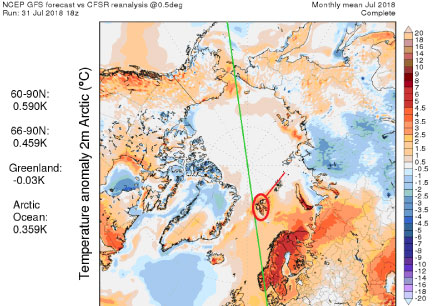
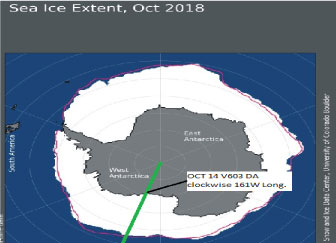
From Table 3 nova V603 Aquilae should show a specific sea ice melt January 1, 132W, eastern terminus. Looking at Figure 1, it should be noted the hotspot is traveling clockwise after January 1 or to the west from the corrected position 162W that results from the addition of the 30 degrees to the calculated value 132W. The green line in Figure 6 traces the 162 west longitude line and one would assume, the lost sea ice due to the clockwise motion of the hotspot from the eastern terminus in the month of January 2018 is shown by the blue area between the red line and the white area of sea ice south of the Bering Strait [11].
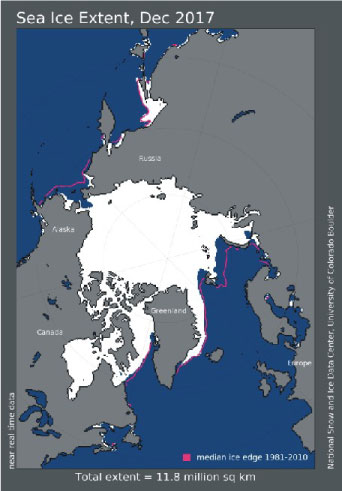
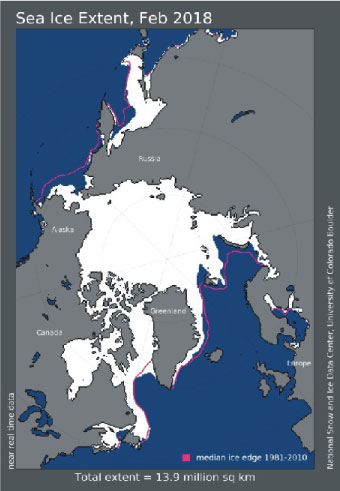
By observing the sea ice slides for December 2017, January, and February 2018 shown as Figure 6A and Figure 6C; it can be seen that the freezing and heating energy fluxes are nearly equal because the edge of the sea ice barely moves for the maximum heating date.
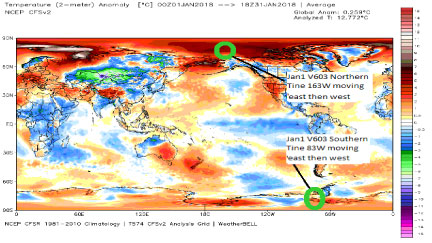
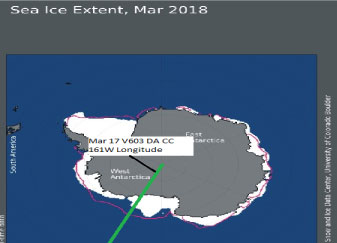
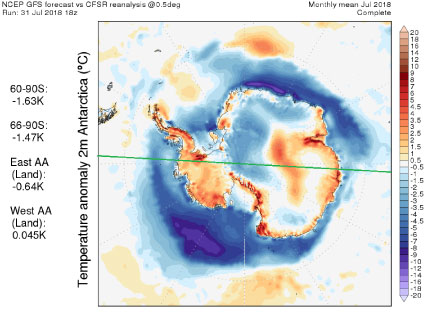
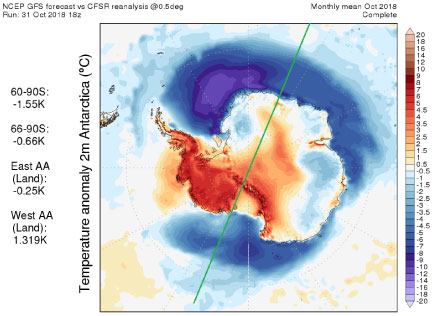
The January 1 location for the hotspot of V603 Aquilae at the South Pole is shown in Figure 7 as the green line. The green line is tracing the 102W -20 = 82W longitude line due to the subtraction of 30 + 20 degrees from the calculated value of 132W from Table 3. When the Longitude equation was derived, the plague longitude in the USA was used. Since the longitude of an incoming debris stream varies from north to south an additional 20 degrees needs to be added for the shift to the east for the southern tine. Since the motion of the hotspot at the North Pole in Figure 6 is clockwise or to the west, the motion of the South Pole hotspot will be counter clockwise or to the east. There is no blue open water in Figure 7 east of the green line indicating a hotspot storm has not occurred at this location. The data of Figure 8 agree with the fact that no southern hotspot exists [11].
Figure 7A shows a small melt between Jan 1 and Feb 1 that may be due to V603 Aquilae or WZ Sagittae hotspot from DA location of November 2.
Notice the match of hot spots on both sides of the pole in Figure 8A with green line. Sea ice melting should occur at both locations at different sides of the pole [12]. This indicates that the incoming debris stream is split into two different heating zones and the green circle of Figure 8A shows where melting should occur on the opposite side of the pole (compare Figure 6B and Figure 6C).
There is no sea ice melting indicated at 83W longitude due to V603 debris stream in Figure 8B (Janurary) [13].
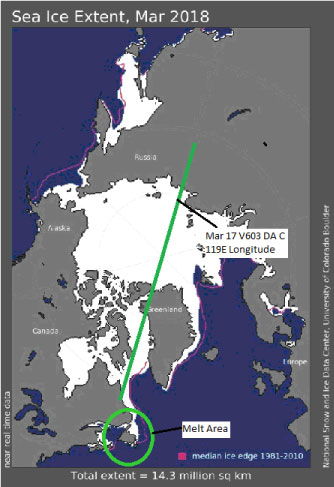
V603 March 17 sea ice melt
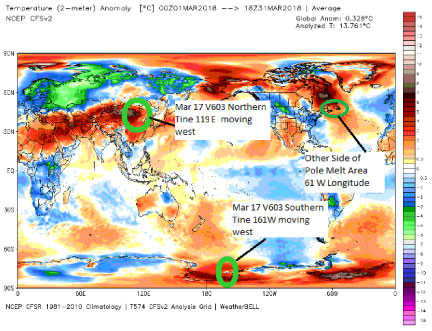
The major sea ice melt occurs in the green circle of Figure 9 where the solar and V603 DA fluxes are both working [11]. The sea ice melt is on the other side of the pole as indicated in Figures 10A and Figure 10C where the heating occurs shown in red. The heating area for the northern tine's latitude shown in Figure 10 is too low to melt sea ice at North Pole, Figures 9 and Figure 9A.
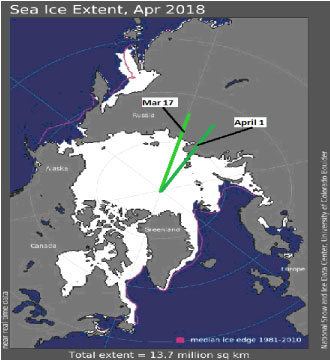
This slide is the comparison of the following month, April, to bracket the March 17 date. It denotes no visible significant change, but does not show possible sea ice thinning between the green lines of Figure 9A related to July ice melt.
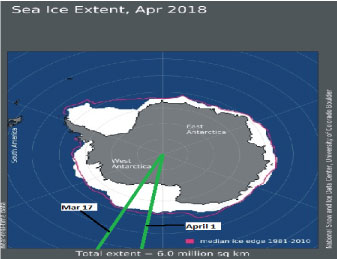
Southern tine which is a deflection area, DA, appears to be correctly predicted by green bar being right of center in loss sea ice area and moving from west to east or counter clockwise in Figure 10 [11]. Loss Sea ice area continues to grow in the correct direction, counter clockwise, after March 1 Figure 11A. Normally the loss of sea ice's beginnings will always be shown in the Climate4u sea ice Figure on the first day of the month containing the CAM date of the maximum hotspot; so, following months will no longer be shown in this paper. The reader may check following months if interested.
The green line in Figure 10A is extended to the other side of North Pole on the 60W longitude line where the solar heat flux unites with the incoming energy of the V603 debris stream to cause the sea ice melt in the Gulf of St. Larence [12].
Figure 10B agrees with Figures 10 and Figure 10A sea ice melts. The melt is due to a DA zone and the hotspot does not change direction when it encounters the green line [13].
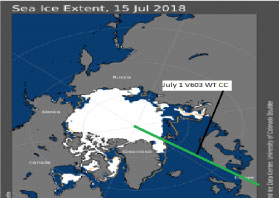
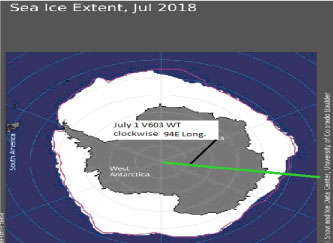
V603 July sea ice melt
Since this case is a western terminus and the counter clockwise, CC, rotation indicates the hotspot is headed east after touching the green bar on July 1st, it has already been over sea ice loss area shown in Figure 12 before July 1 [14]. Figure 12 is for July 15th; so, the hotspot has traveled 15 longitudinal degrees to the east away from the green line and increased the blue water area between the yellow line and the white area of ice above the green line shown in Figure 12.
The hotspot has been over the sea ice loss area before the location of the July 1st green line traveling counter clockwise and overflows the bar slightly before reversing direction and moving clockwise or east as shown in Figure 13 [11]. July is a freezing month in the Antarctic so the freezing and heating fluxes are near equal and competing with each other making the sea ice loss area small.
The locations of the northern and southern debris stream focal points or hotspots shown in Figure 14 agree with the derived values from Table 3 except where corrections are noted. It is obvious the southern tine has done some melting to the east before July 1 [12].
The important part of the hotspot is indicated by the red circle in Figure 14A and it moves down the red line to the green line and back. The motion is along the sea ice edge [13].
The hotspot in Figure 14B at 94E longitude on the eastern shore of Antarctica and rebounding clockwise is in agreement with Figure 13 [13].
V603 October sea ice melt
The melt of the sea ice before and after the green bar deflected area, DA, can be seen in Figure 15.
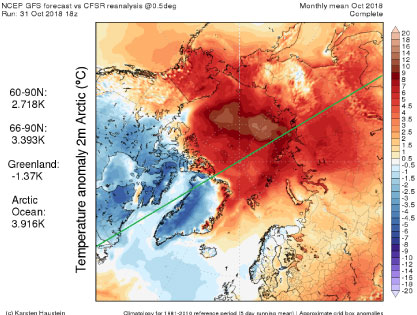
The very large hotspot shown in Figure 16A [12,13] shows melts on both sides of green line near Asian shore shown in Figure 17 [11]. Heat is added to Laptev Sea unfrozen water in October to delay normal freezing time.
The DA hotspot traveling clockwise of Figure 16B [13] agrees with sea ice melt in Figure 15 again allowing for October to be a freezing month for the Antarctic.
V603 sea ice melts summary
The V603 melting sea ice longitudinal locations agree with derived theoretical values at both poles. The North Pole melt of July 1 is extraordinary and results due a double pass over of the melt area by the V603 hotspot. The theoretical values of Longitude for lines of maximum incoming heat flux must be shifted 30 degrees west at the North Pole and the resulting North Pole longitudinal value must be shifted 80 degrees east to find the correct South Pole longitudinal location. The shift of the theoretical values at both poles is due to the effect of the Earth's magnetic field.
November and December Bering Sea Pause in Sea Ice Extent
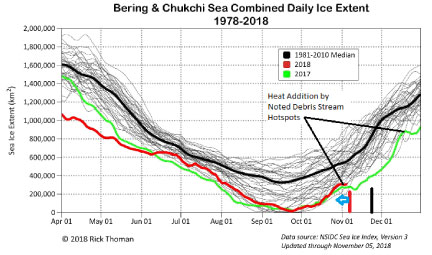
The motion of the SN 1054 hotspot in Figure 4 shows the hotspot was over 166W longitude, 175E (revolve 155W 30 degrees west) minus 166W degrees, before December 12 (one degree equals one day) or 19 days on the date of November 24. The hotspot is moving east and the vertical black line in Figure 18 shows the date for the center of the hotspots location at 166W. The center of the hotspot touches the area where sea ice extent is being measured at 180W shifting the date when the effect of the hot spot would be felt 14 days to the vertical red line [15]. The hotspot is not a point but it is a large circular area where the blue arrow in Figure 18 represents the radius of the hotspot circle in days. The conclusion is that the November 1 decrease of increasing sea ice extent is due to the SN 1054 hotspot.
The red line of WZ Sagittae's eastern terminus in Figure 4 is to be shifted west 30 degrees to 145W on January 20. The central location of 166W occurs in 21 days with the hotspot of WZ Sagittae moving west giving the date of February 10. Since the right ascension values of the exploding stars have not changed, the longitude locations and dates of incoming energy should be the same for the red line and green line, 2017 and 2018 of Figure 18 [15].
Double or Triple debris stream hotspot phenomena
The January 1 green line for V603 Aquilae in Figure 4 also locates the hotspot for WZ Sagittae on January 1 that is traveling toward its eastern terminus. The WZ Sagittae hotspot is not at its maximum incoming energy that occurs on January 20, but it contributes at the same location as the V603 maximum forming a maximum incoming total energy location. If this double hotspot location is moved 30 degrees west to correct the calculated value to the real value, the double hotspot is located at 166W longitude in the Bering Sea (January point Figure 16A). The hotspot for SN 1054 is also at the 166W longitude location on January 1 giving a triple hotspot. The maximum hotspot value for WZ Sagittae occurs January 20 and moves to the 166W location through 21 degrees longitude in 21 days giving the date February 10 for the unusual 8 day melt in the Bering Sea (February point Fig 16A) [16,17]. If the V603 Aquilae hotspot is not thermally effective January 1, WZ Sagittae and SN 1054 still provide a double hotspot at 166W longitude on the noted date.
The reason the double and triple hotspots are formed is because of the small variation of the right ascension, RA, values of the three exploding stars. The right ascension value for WZ Sagittae is 20h 07m 36.5s. The right ascension value for V603 Aquilae is 18h 48m 54.6s. The difference of the two values is 1h 18m 42.9s giving 19.7 degrees longitude as the distance between the red and green lines of Figure 4. The unusual melt in February 2018 in the Bering Sea was not caused by the double hotspot of V603 Aquilae and WZ Sagittae, but was caused by the WZ Sagittae hotspot after thinning by other exploding star incoming energies.
It was noted that February 1989 showed a similar decline of sea ice in the Bering Sea. WZ Sagittae being a recurring nova was actively impacting the planet in 1989 at the same longitude as today [16]. It will be interesting to calculate the impact date of nova V606 Aquilae that was visibly exploding in 1899 and 700 ± 86 light years away from our planet [18]. The right ascension value of V606 Aquilae is 19h 20m 24.3s. The difference of the RAs between V606 Aquilae and WZ Sagittae is 47m 12.2s giving 11.8 longitude degrees difference. The nearness of the RA values means the effect of impact will be near the same longitude. The constant from equation (2) is 0.1200. The correction term is 84 ± 19.32 years. The impact time of V606 Aquilae is 1983 ± 19.32 years which includes 1989. Therefore, there was a good chance of another double hotspot attack on the Bering Sea in 1989 by the nova WZ Sagittae and V606 Aquilae.
Nova WZ Sagittae has been selected as the impacting heat source for early February melts in Bering Sea 2018 and 2019, but the late February melts heat source is unknown as shown in Figure 16B [17]. A number of cataclysmic variable stars are available but the real unknown source must have a right ascension, RA, near 20.75h to produce a Bering Sea ice melt near March 1.
The calculation begins with the equation, RA = 24(DOY-79)/365 (2) [3].
The Veil Nebula's RA is 20h 45m 38s and can be expressed in decimal form as 20.76h [19]. The declination, DEC, of the Veil Nebula is +30 degrees in the northern hemisphere's sky [19]. The result from equation (2) is DOY equals 30, January 30. To calculate the longitudinal location for the Western Terminus, L, maximum heat input location use the equation, L = 13W + 360(15-RA)/24 (3) [4]. When the remnants location is greater than 15 the location of 13W longitude is shifted to the east. The location of the Western Terminus is 73E longitude. The value of the longitude of the Eastern Terminus is on the other side of the Earth or 180 degrees away at 107W, the theoretical value that would be plotted in Figure 4. Rotating the theoretical value 30 degrees due to the earth's magnetic field at the North Pole gives 137W longitude. For the hot spot to move to 166W, 29 degrees are required. Using the SNIT theory rule of one degree per day we add 29 days to the CAM date of January 30 to produce the date of March 1 for the melt of sea ice by the Veil Nebula debris stream, yearly.
Shorthand for the same calculation for SS Cygni RA = 21h 42m 43s = 21.712h DEC = +43 [20] DOY = 44 = Feb 13 Rotated and Eastern Terminus = 122W Theoretical value = 92W for the hotspot to move to 166W takes 44 days = Mar 29. The variable star SS Cygni debri stream appears to cause the last Reduction of Bering Sea ice extent before summer in the northern hemisphere. See Figure 17B.
The important factor in sea ice melting may be the period of time elapsed after initial impact of the exploding star debris stream.
Conclusions
For the simple case of the Spanish Flu and R Aquarii, it can be observer that the impact time could have been in error by 85 years and it would have been impossible to connect the epidemic to the exploding star 710 light years from our planet.
This is the first time that deep space astronomy has produced a significant effect on Earth's biosphere. Astronomers should be given the task to see if the author has missed any recent or near future debris stream impacts of importance.
Currently it is the opinion of the author that the GK Persei explosion's impact may destroy the society of the USA and Western Europe beginning in the year 2083. Hopefully mankind will learn how to protect our planet from incoming exploding star debris streams before that date.
The theoretical Locations if polar sea ice melts and hotspot storms do not always agree exactly as can be seen in the numerous Figures, but a high percentage of the cases do agree to a reasonable accuracy. The assumption of a constant longitude for incoming debris storms has been changed to a eschewed distribution resulting in a 30 degree shift to the west for the Arctic melts and storms and a 50 degree shift to the east for Antarctic melts and storms. Storms that occur at the extremes, eastern or western termini, of the 180 degree sector for the longitudinal travel of a debris stream, will change east west direction at the terminus location.
Sea ice melts can occur in warm polar months that were the result of ice thinning in cold polar months.
The pattern of ice melts could vary in latitude for following years for the western terminus and deflection area, but eastern terminus sea ice melts should reoccur at the same time and location yearly.
To date doctors are doing a great job stopping pandemics with inoculations. If the debris particles could be stopped from impacting Earth's atmosphere, many lives could be saved an Earth could become paradise free of disease. It is sad that we spend so much effort inventing methods to destroy others when we should be researching how to protect everyone from death.
The discovery of the Veil Nebula supernova melting sea ice in the Bering Sea means a number of other active debris streams are impacting Earth. The Veil Nebula supernova explosion was visible 3000 years ago and has been actively adding heat to our planet for over 2000 years at regular times in our orbit. If you have ever looked at the thermal model of our planet you can surmise what a bubble gum and bailing wire job it is and how many heat sources are keeping us from becoming a snowball planet.
Addendum
References [21-24] would be helpful to those interested in predicting polar ice melts, studying global warming, and understanding the SNIT theory. You may also search for MYSTERIOUS LAPTEVAREA UNFROZEN SEA OCTOBER 2018 that is currently unpublished.
References
- https://en.wikipedia.org/wiki/R_Aquarii.
- https://en.wikipedia.org/wiki/Spanish_flu.
- https://www.academia.edu/37476540/Earth_Diseases_and_Exploding_Stars.
- Sokeland WP (2017) Supernova and nova explosion's space weather: Correlated megafauna extinctions and biosphere meg-disturbances-global warming. Journal of Earth Science and Engineering, 136-153.
- http://mbio.asm.org/content/4/1/e00623-12.full.
- Sokeland WP (2017) WZ Sagittae: Space weather- global warming. Journal of Earth Science and Engineering 154-174.
- http://westerndigs.org/epic-fire-marked-beginning-of-the-end-for-ancient-culture-of-cahokia-new-digs-suggest/.
- https://www.cdc.gov/plague/maps/.
- Sokeland WP (2018) SN 1054, SN 1006, & Nova WZ sagittae calving antarctic ice cap - Global warming & moose die off longitude relationship deflection area in antarctica and usa - WZ Sagittae Impact and Martian Dust Storms. Journal of Earth Science and Engineering 103-121.
- http://dhss.alaska.gov/dph/Epi/id/Pages/Mumps-surv.aspx.
- http://www.climate4you.com/SeaIce.htm.
- http://models.weatherbell.com/temperature.php.
- http://www.karstenhaustein.com/climate.
- http://nsidc.org/arcticseaicenews/2018/07/.
- https://twitter.com/AlaskaWx.
- https://www.usatoday.com/story/news/nation/2018/02/23/unprecedented-bering-sea-loses-half-its-sea-ice-over-two-weeks/368006002/.
- https://twitter.com/AlaskaWx/status/1072509494129770499.
- https://en.wikipedia.org/wiki/List_of_stars_in_Aquila
- https://en.wikipedia.org/wiki/Veil_Nebula.
- https://en.wikipedia.org/wiki/SS_Cygni.
- Sokeland WP (2017) WZ Sagittae, SN 1054, SN 1006 Space Weather - Global Warming. Journal of Earth Science and Engineering 194-216.
- Sokeland WP (2018) Global warming and cooling: friend and foe to mankind. Journal of Environmental Risk Assessment and Remediation.
- Sokeland WP (2018) Snit theory: Effects of supernova g11.2-0.3: Current events sn 1054 & 1006 and cholera environment entry. Journal of Environmental Risk Assessment and Remediation.
- Sokeland WP (2019) November Dead Fish New Zealand - Poor Florida and Alaska, Pollution. Bioremediation & Biodegradation Journal Chembio Publishers.
Corresponding Author
William Sokeland, Retired, Heat Transfer Expert, Spacecraft and Turbine Engines, Oakland City, Indiana 47660, USA.
Copyright
© 2019 Sokeland W. This is an open-access article distributed under the terms of the Creative Commons Attribution License, which permits unrestricted use, distribution, and reproduction in any medium, provided the original author and source are credited.