Analysis of Multiple Factors of Forest Cover Change in a Peri-urban District in Ghana
Abstract
The objective of the paper is to model forest cover change (FCC) from perceived land use and land cover changes in the Bosomtwe district of the Ashanti region, Ghana. Questionnaire and interviews were administered and conducted among 270 proportionately sampled respondents respectively, from 14 communities, on the basis of their respective populations. The quantitative data was analyzed using inferential and descriptive statistical tools in SPSS v.16. Results show that a χ2 = 91.855, df = 26 and probability value of p = 0.000 was indicated for perceived FCC among respondents. The logistic regression model reported confidence intervals (CIs) of 1.218 ≤ CI ≤ 4.234, for three main predictors of the outcome; perception of deforestation, cause of forest cover change and patterns of land use change with (EXP)β > 1, ranging between 1.079 and 2.271. The Odds of respondents being more likely to indicate that forest cover loses is 'high' than its being 'low' is about 2 times. This implies that the peri-urban land uses other than agriculture and agroforestry such as commercial and residential land uses were dominantly the main drivers of forest cover depletion in the district. The Bosomtwe district assembly should strictly monitor FCC in line with human land uses.
Keywords
Multiple factors, Forest cover changes, Perception, Peri-urbanization, Logistic regression, Bosomtwe, Ghana
Introduction
Forest cover change modeling has received considerable research attention over the past two decades [1-4]. This is particularly so because of the alarming rate of forest resources depletion from human incessant footprints, exhibited in different land use and land cover changes (LULCC) activities. For instance, Fisher [5] has analyzed that currently, deforestation in Africa is still largely driven by commercial 'timberization', small-scale subsistence agricultural activities and expansion in settlement into cities [5,6]. In peri-urban fringes, where there is a melting pot of urban and rural socioeconomic complexities at play [7], in trying to establish a spatial equilibrium, Allen, et al. [8] posit that the situation of vegetation cover conservation against its degradation, is of particular interest in ensuring a sustainable urban expansion. This peri-urbanisation which usually assumes a lateral expansionary encroachment into rural landscapes, need to be contained, in order to ensure the appropriate balance between the rural landscape degradation and peri-urban area conversions into urban core are achieved [9].
According to Busck, et al. [10], the expansion of urban areas into the surrounding landscape entails the transformation of the rural agricultural and forest land uses, increasing human population densities as well as preponderance of commercial infrastructure. In this regard, Hosonuma, et al. [3] have espoused the imperative need to study these domains using quantitative and comparative models ranging from human agent-based modeling [11], economic based modeling [12] to a combination of cellular automata and equation based models [4], to ascertain the degree of transformation of the rural and forest landscape frontiers, due to human land use decisions.
As economic growth increases, demand for lands meant for construction of industries, infrastructures and residential developments also increase [13,14]. This in essence has effects on productive forest lands serve as the sources of the wood and fibre raw materials needed for construction, as well as the lands required for their conversion into these development structures. In addition, following from low returns from agriculture activities, smallholder farmers have invariably also moved to engage in other economic activities which are purportedly achieving immediate livelihood goals as compared to agriculture returns [15]. This trend is likely to continue in considerable years to come as economic growth continues to double, eventually leading to a decline in agriculture activities [16]; which does not hold adequate potential for the promotion of agroforestry enterprises.
In Ghana, the clearing of virgin forest for additional crop cultivation, tend to encroach onto ecologically sensitive forest areas [17]. In furtherance of this plight, the Food and Agriculture Organization (FAO) has reported that changes in forest cover, shows a disturbing picture. According to data from Global Forest Watch, the forested portion of Ghana with major tree cover comprises approximately 6.9 million hectares, have depleted substantially. Out of that, more than 500,000 hectares were cleared for various land use operations, from 2001 to 2013 [18]. In other words, in just over a decade, the country lost more than seven percent of its forest cover. In a study by Peprah, et al. [19], land use change trajectories in the direction of human settlements, are particularly responsible for the forest cover conversions from high forest to low and grassland vegetation in Ghana. In the Bosomtwe district of the Ashanti region, one would wonder why one of the densely settled towns is called Esereso (meaning, savanna grassland) in a purely deciduous forest zone. This is arguably supported by the aforementioned studies that present the FCCs in the country in general.
In conceptualizing the relationship between peri-urban land use and agriculture and forest land use (AFoLU), a trade-off scenario is presented. In this regard, attempt to augment the supply of a particularly human services, compromises the supply of other ecological services; thus, other services are traded-off [20]. Vegetation cover trade-off is akin to ecosystem services trade-off, which reduces the supply of particularly regulatory and provisioning services, in order to augment a socio-cultural supply of other services [21]. This concept has therefore been juxtaposed on forest land cover trade-off in the peri-urban areas and has been found to show a perfect fit. In support of this Adanu, et al. [22] in their study of deforestation in Ho municipality in Ghana, reported that human activities resulting in the depletion of closed canopy forests into open forest, cultivated lands and build up areas are occurring at different degrees of expansion at the expense of forest cover.
According to Masanja [23], there are two major driving forces for conversion of forest cover in the peri-urban peripheries; these are, demands for housing for the growing population and the deteriorating housing conditions and inadequate urban services [24]. Also, another reason for the conversion of vegetated land was discovered by Webster [25], as being the result of higher economic gains over the agriculture returns. With rationality of the farmers and land owners, they would rather opt for, by engaging or leasing for other land use activities with higher earnings [12], other than agroforestry. In the end, a subtle endorsement of forest cover depletion could present potential consequences for local climate variability and change, with implications for food insecurity.
The preponderance of research on forest cover changes in urban and rural areas notwithstanding, little research attention seems to have been given to the perceptual perspectives of local peri-urban communities and how they perceive the FCCs. These local actors and agents live in close proximity to the forest resources as their livelihood sources. They are therefore active partakers and recipients of the perpetual repercussions of the changing dynamics of forests. Yet, it is usually posited that the causes of forest cover depletion are more of policy driven than socioeconomic in nature, contrary to the main argument of this study. In this regard, the focus of this paper, as our point of entry into the literature, as far as FCCs in peri-urban areas are concerned, is to use a logistic regression approach to model, from respondents perspectives the perceived processes of FCC dynamics in the Bosomtwe district of the Ashante region, with implication for other forest cover change dimensions in Ghana and sub-Saharan Africa.
Material and Methods
The study area
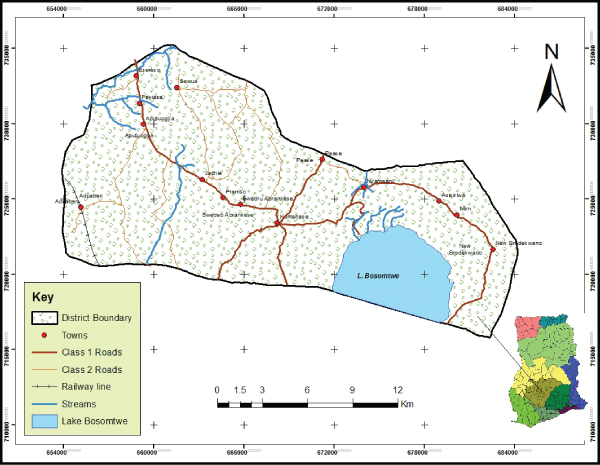
The Bosomtwe district is located in the central part of the Ashanti region. It lies within Latitude 6°28'N-Latitude 6°40'N and Longitudes 1°2'W-Longitude 1°37'W. Kuntanase is the district capital. It spreads over a land area of 718 km2 (Figure 1). The district is bounded to the North by Atwima Nwabiagya and Kumasi Metropolis and to the East by Ejisu-Juaben Municipal. The southern section is bounded by Amansie West and East districts, all in the Ashanti Region of Ghana [26].
Lake Bosomtwe, the largest natural (crater) lake in Ghana is located in the district. With the exception of the Lake which has an outer ridge that maintains a constant distance of 10 km from the center of the lake and stands at an elevation of 50 to 80 m, the rest of the district has other varying unique topographical features. The drainage pattern of rivers and streams draining the Bosomtwe district is dendritic and centripetal in outlook. Around Lake Bosomtwe, there is an internal drainage where the streams flow from surrounding highlands into the lake in a centripetal fashion. The streams form a dense network due to the double maxima rainfall regime. Notable rivers in the district are rivers Oda, Butu, Siso, Supan and Adanbanwe (Figure 1).
The district falls within the equatorial zone of climate with a rainfall regime typical of the moist semi-deciduous forest zone of the country. There are two well-defined rainfall seasons. The main season occurs from March to July and September to November with mean annual rainfall of about 1400 mm. The mean monthly temperature is about 32 ℃ with a relative humidity of between 60 to 85%.
The district falls within the Moist Semi-Deciduous Forest zone where different species of tropical hard woods with high economic value can be found. The trees species found in the district include; Wawa (Triplochiton scleroxylon), Denya (Cylicodiscus gabunensis), Mahogany (Khaya ivorensis), Asanfena (Aningeria spp.) and Onyina (Ceiba pentandra). In certain parts of the district, however, the original forest cover has been turned into secondary forest and grassland through indiscriminate exploitation of timber and inappropriate farming practices such as the slash and burn system and illegal gold mining activities.
The physical growth of settlements in the district is influenced by distance between the settlement and the Kumasi Metropolis. Further, the presence of infrastructure, socio-economic activities, the tourism sector improvements are all value additions to various land uses and cover, making the district one of the boisterous in the Ashanti Region.
Sampling design, instruments and data analysis
The study used a mixed method approach, which complements the relative strengths and weaknesses of the quantitative and quantitative methods [27,28] to analyzed land use conversion potentials and their resulting effects on FCCs, based on the land use decision of respondents. The views were proportionately sampled from 14 adjoining peri-urban communities to the main Kumasi, in the Bosomtwe district of the Ashanti region of Ghana [29]. The respondents were to demonstrate their perceived rate of forest cover depletion given the conditions that influence their land use decisions in the district. A sample size of 270 household respondents, aggregated by gender was randomly sampled and data solicited from them.
The sample size was determined using the formula n = N/1 + N(e)2 where, n is the sample size. N is the total number of people in the twelve selected communities and e is the margin of error [30,31]. With a 5% margin of error (95% confidence level), from a total population of 45,525 the sample size was 270. The respective proportionate samples (p) allocation by quota to the 14 selected communities, were then determined by the proportionate sampling method given by [p = (p/100)270].
Using a structured partially pre-coded questionnaire, we administered proportionately to the communities based on their respective population sizes according to the 2011 district assembly's Scalogram, which is the detailed schedule of the district assembly's infrastructure programme for a period.
The quantitative data gathered were subjected to Logistic regression analysis, the Pearson's Chi-square, Cramer's V statistics, Nigelkerke's tests of association, strength and correlations coefficient explanations respectively, all embedded in the statistical package for social sciences (SPSS) version 16 and results displayed in tables, charts and graphs. A non-parametric test (One-Sample Kolmogorov-Smirnov Z- Test) was carried out to establish whether there is a significant difference between the peri-urban land uses and vegetation cover depletion in the district. The diagrams generated in the SPSS, were exported to excel for editing for better visual presentation. Open-ended qualitative responses were categorized into themes and integrated in the discussions under the various thematic treatments, with direct quotes at some sections of the paper.
Using the logistic model
The study sought to experiments with the extent to which multiple statistical data analysis methods are amenable to socioeconomic parameters. In a purely environmental discourse, the use of inferential statistics was meant to attempt a parametric analysis of non-parametric variables that are embedded in the socioeconomic data. Using a log transformation of the probability p-values to a log distribution makes it possible to relate the bi-variate regression model to the normal regression model. The log transformation of the probability p is called the logit of p or logit(p) [32]. This predicts the logs of the rate of success as against the rate of failure. The Logit(p) is the log (to base e) of the odds ratio or the likelihood ratio that the dependent variable is 1. Mathematically, the logit(p) model is expressed as:
Whereas p can only range from 0 to 1, logit(p) scale ranges from negative infinity to positive Infinity (-∞ ≤ logit(p) ≤ +∞) and is symmetrical around the logit of 0.5 (which is zero). The model eqn. 1, can be rewritten in the form of the normal linear regression model (y = a + b1X1 + b1X2 �etc.), as shown in eqn. 2
Instead of the least-squared deviations criterion for the best fit, in normal regression, the logistic regression uses a maximum likelihood approach that maximizes the probability of getting the observed results, given the fitted regression coefficients derived by the analytic model in this case, the SPSS version16. A as a result, the goodness of fit and overall significance statistics used in logistic regression are different from the ones used in linear regression. The probability, p can be calculated by rearranging Equation. 2, as;
Where,
p = The probability that a case is in a particular category for the response variable,
exp = The base of natural logarithms (approx. 2.72),
a = The constant of the equation a particularly explicit in step-wise models, and
β = The coefficient of the predictor variables.
Results
Respondents' perceptions of forest cover loss in the district
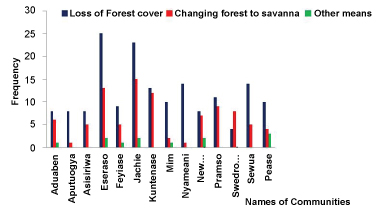
Considering various degrees of reasons that have been given for the continuous changes in the land use and land cover changes (LULCC) generally [4,33,34], the study sought from respondents' views on the trends of vegetation cover depletion (deforestation) processes in the Bosomtwe district. This was expedient, and in consonance with the intention to correlate with geo-information assessment of the land use and land cover changes including vegetation changes in the district. From all the 14 communities, various perceptions were expressed as guided in the pre-coded questions posed to them. They were to identify with the district's forest cover losses in terms of the complete primary and secondary forest losses, the conversion of the forest into Savannah, and any other means perceived as a trend of vegetation losses in the district.
The results show that a whopping 61% of the respondents cumulatively from the communities were of the view that deforestation could be expressed in their observed forest cover losses over the years. Out of this percentage, Esereso and Jachie's proportions are 15% and 14% respectively (Figure 2). On the other reasons, 34% and 5% respectively from these two communities responded that the process has been caused by the conversion of forest to Savannah. It presupposes why a community in the district bears the name Esereso, which means a Savannah grassland area; although it is not found in the northern Guinea or Sudan savanna ecological zones, but rather in a semi-deciduous forest ecological zone.
Forest losses in the district have different interesting ethno-cultural accounts. One of such account was a scenario narrated by an 80-year-old female respondent at Feyiase as follows;
"In the olden days, several years ago, the oral tradition handed down to us have it that a fetish priest ordered the chief of the community to authorize the clearing of the forest cover, otherwise, the local deity cannot operate" (In-depth interview, female farmer, May 2014).
This, according to the woman has been the main reason why the community is devoid of any meaningful forest cover. Coupled with the expansion in residential and commercial land uses, the vegetation cover could completely be degraded and lost (Figure 2).
Test of the relationship between peri-urban land use changes and vegetation depletion
In response to the null hypothesis (H0) that there is no significant relationship between peri-urban land use and land cover dynamics and forest cover reduction in the district, a chi-square test of association was run in SPSS to ascertain the degree of association. The results showed that there is indeed a strong relationship between the peri-urban land uses and vegetation cover loses. At a significant level of 0.05, a chi-square value of χ2 = 91.855 was realised at a degree of freedom, df = 26 with a probability value of p < 0.000. The Cramer's V test of strength of association, indicated a strong association between the two nominal variables at V = 0.412.
To test the hypothesis, a non-parametric test (One-Sample Kolmogorov-Smirnov Test) was carried out in the software. The test statistics indicated that there is significant relationship between peri-urban land use and land cover dynamics and vegetation cover reduction district, as the alternative hypothesis (H1) sought to maintain. The test was significant at α = 0.05 with a p-value, p < 0.000 with the most extreme differences at an absolute values of 0.276 and 0.30, positive values of 0.276 and 0.301 and negative values of -0.260 and -0.218, with the Kolmogorov-Smirnov-Z values of 4.529 and 4.938, for the causes of vegetation changes in response to peri-urbanization and main uses of peri-urban lands respectively (Table 1).
The result of the test warranted the rejection of the null hypothesis with higher certainty (Table 1). There is, therefore, significant relationship between the peri-urban land uses and forest cover losses. This means that the process of urban sprawl is encroaching on the green areas of the rural peripheries. In view of this therefore, the rural landscape is substantially experiencing the process of urbanization [35]; this is occurring at the expense of pristine agricultural and forest land uses (AFOLU).
Fitting the logistic model to the rates of forest cover change
In determining respondents perceived rates of forest cover depletion, respondents' opinions of rating the trend as high and low were used in a non-categorized step-wise logistic regression modeling. This was done to determining the effects of independent variables (IVs) identified as: the name of respondents' perception of deforestation; causes of vegetation cover reduction and an estimated rate of vegetation cover losses per year. The dichotomous responses to the dependent variable "what in your opinion, is the rate of vegetation cover losses in this community?" They were to respond as 1 = "High rate" and 0 = "Low rate", with no intermediate (moderate) view point. These were predicted by the conditional statements of the independent variables as: What if there are changes in the location to a different community; their perception of deforestation; causes of vegetation cover loses and the estimated rates of vegetation cover lose by the respondents, as the independent variables. The analysis was conducted using a case-wise binary logistic regression in the software, to ascertain the likelihood of respondents the opinion of either a high or low rate in the loss of vegetation cover. These actions were taken in the form of the probability of the action occurring successfully or failing to occur as either 1 or 0 in binary logistic modeling [32].
From the earlier analysis of the logistic regression model, to the outcome of the data in the logistic regression Table 2, is fitted to the model, to determine the probability of opinionated rates of vegetation cover losses, given the various independent variables. It is also to determine which of the predictor variables has the highest degree of influence in predicting the outcome of the dependent variable. Again, by using the logistic regression model to the variables from Eqn. 3, we calculated the respective odd ratios of the independent variables in predicting the outcome.
During the analysis, the null hypothesis stated that without the independent variables the model is a good fitting model. Alternatively, the other hypothesis was that the model is not a good fit without the inclusion of the independent variables in the model. At the case step 0, which is the beginning method the overall predicted percentage is 78%; this is a measure of the fitness of the model when y = the constant. The overall significance of the model without the independent variables was p = 0.000. However, with the inclusion of the independent variables (location to a different community; their perception of deforestation; causes of vegetation cover loses and the estimated rates of vegetation cover lose), the overall significance of the model was also p = 0.000 at a chi-square value of 39.080, at 6 degrees of freedom.
The overall percentage predictive accuracy of the step 1 model is 80.4% as against the 78% null model. The model with the variables was better than the null hypothesis by just 2.4%; this means there is not much significant difference between the null hypothesis and the alternative hypothesis. All the four independent variables were however, significant in predicting the outcomes of household respondents, with probably values of p = 0.006, p = 0.008 and p = 0.010 and p = 0.012, are significant at α0.01 and α0.05 respectively.
In spite of these levels of significance, the model however was unable to explain this prediction to any appreciable percentage, at only 20.7%, of the Nagelkerke (a quasi-coefficient of determination in nominal analysis), R2 = 0.207. The reason is that, considering the predictive rate of the null (constant) model, in comparison to the equation (variables) model, there may, therefore, be other inherent explanations beyond the scope of the model to explain. Possible reasons could be that, the predictor variables predicting the response variables, are not measured as categorically as the dependent variable in a ratio and/or interval scales to yield the exact numeric predicted outcomes, for which the model can succinctly explain.
The confidence intervals of (CIs) of 1.218 CI ≤ 4.234, 1.221 ≤ CI ≤ 3.373 and 1.227 ≤ CI ≤ 3.899, lower and Upper respectively, for the three main predictors of the outcome, and a (EXP)β > 1, ranging between 1.079 and 2.271. These statistics mean that the Odds of respondents indicating a high rate of vegetation cover losses were more likely to occur than low rate. This is based on the further assumptions that there are changes in the location to a different community; their perception of deforestation; causes of vegetation cover loses and the estimated rates of vegetation cover lose in the district. The probability of conversion is about 2 times when any of the main predictor variables increase by one unit.
The assumption is that if the perception of deforestation remains as defined by the respondents, and the pattern of land use conversion remains the same, considering the rate of vegetation cover change, any change in a unit of these independent variables would be responded be a unit change in the dependent variable, pare paso. The probability of the case outcome of vegetation loss being high as predicted by the independent variables can be expressed in the general logit(p) equation from Eqn. 3 as follows:
The Odds for the likelihood of a change in any of the independent variables in predicting the dependent category can thus be determined from the odds ratio or the logit of probability (p) function above and determined by the (EXP)β in Table 2. With references to the odds ratio, the likelihood of a change in any of the independent variables in predicting the dependent category can thus be determined from the number times respondents expect the forest cover to change (reduce) in any degree of rarity of occurrence. The perception of deforestation (Def); Causes of vegetation cover loss (Cveg); Rates of vegetation cover losses (Rloss), have significant determining influences on the forest cover being changed into others, such as agriculture, residential, and commercial land uses. The probability (p) function above indicates about 2 times in the event of occurrence of forest cover reduction, as would be anticipated by the respondents in the district. The verifiability of the results of vegetation cover change to any degree of accuracy requires further assessment using remote sensing and geographic information science techniques. That notwithstanding the focus of the paper in assessing the perceived rate of vegetation cover changes using logistic regression is supported by a similar study by Augustin, et al. [36] who ascertained the transitions probability of vegetation cover in classified pixels in the north-east Scotland's semi-natural forests.
Discussions
The results have far-reaching implication on the FCC, as perceived by the respondents in the Bosomtwe district. Land use and land cover changes have resulted from dynamic human activities which require conscious streamlining. From a perceptual perspective, forest cover is depleting in the interest of other land uses and land covers (LULC) in the district; particularly residential and commercial activities. Peri-urbanization as the name suggest, is the development of urban peripheral into urban areas. Since he people in the district have intricately become an integral part of this setting, their household decisions align with the most immediate rational reactions, all things being equal, to convert land into other uses from their original, in most cases agriculture and forest land uses (AFoLUs).
Direct causes of forest cover removals have their basis in human-induced activities [3]. These directly affect the loss of forests projections required for setting forest reference levels as indicated by the Unite Nations Framework Convention on Climate Change (UNFCCC 2011) and cited in Hosonuma, et al. [3]. There is need to base underlying causes on the knowledge of specific human drivers or activities, for deforestation and degradation processes [15]. It is broadly acknowledged that spatial land use planning has a strong role to play in the development of climate change adaptation responses [37,38].
Processes linking to the development and use of peri-urban lands in Ghana are highly influenced by spatial planning. Ultimately, the conversion of forest land cover into peri-urban land uses [39], has become the new trend. This therefore reduces the amount of forest cover available to mitigate greenhouse gases (GHGs) emissions in the rural to the peri-urban periphery [40]. The consequential effects of this will be food insecurity Zasada, et al. [13], as subsistent rain-fed agriculture would be hit by the negative impacts of local climate variability and change caused by anthropogenic activities [41,42].
Arguably, as agroforestry has becomes not so lucrative due to climate variability, smallholder farmers in the Bosomtwe district are looking for alternative livelihoods from their land, not in terms of intensive cultivation, but from their land use modification and complete conversions into the most readily demanded land use in the district. In a related way, Adjei [43] observed that incomes accrued from lease of lands to private and estate developers are generally higher than for agricultural or agroforestry purposes; hence, the preference of landowners to lease out lands for purposes other than agriculture and forestry ventures.
As speculative demand for land in the wider Kumasi Metropolis is directed toward the urban periphery including the Bosomtwe district, vegetation cover changes are expected to be rapid. The rapidity in the rate of reduction would be better determined from a geo-information modeling of the vegetation change detection scenarios in a time serial analysis [26]. However, the fact that the local people, most of whom have been in the community for decades have acquired ecological knowledge ample enough to perceive the depletion of the vegetation cover. Observable credence is given to these perceptions in the study district, by the pointers of human land use activities. The identified human land use activities such as farming, wood fuel energy extraction, residential expansion, sand mining etc., have the potential to alter original vegetation covers in the district. The business as usual situation and the scramble for land for residential developments, in most cases by lateral expansion, would definitely have consequential degrading effect of the forest cover in the district.
Another cause of forest degradation is the clandestine operations of illegal logging activities through chain saw milling of timber in the district [44]. The district assembly contends that this problem is indeed a challenge worth dealing with, in safeguarding the forests. This is especially so, when the only natural lake, Lake Bosomtwe radial streams that feed into the depression take their headwaters from the forested highland zones. Illegal gold mining, also called galamsey and sand mining are also identified as other avenues of forest degradation, rampantly practiced in some parts of the district. In the absence of adequate jobs for the youth in the district, the activity of sand mining and illegal gold mining have become lucrative livelihood activities, supporting household incomes, as both on-and-off-farm activities.
Forest cover depletion is a function of a myriad of human and naturally-induced activities and processes respectively [5]. What this study has revealed is the dominant human activities that drive forest cover depletion in the Bosomtwe district. The rates of vegetation cover change, expressed in the perceived forest cover losses, are amply expressed in the motivating factors that would drive the processes of deforestation in the area [26]. The logistic regression model results present a clearer picture of the various salient socioeconomic driving factors that make the people alter their vegetation cover. This was identified to be perpetrated through various human land uses that have direct, and to an extent, immediate benefits to the land owners and other stakeholders.
The Bosomtwe district assembly has recently undertaken a number of developmental activities. However, these developments have had little recourse to stringent forest cover and land use controls management. The district assembly's plans of natural resource conservation in the face of the increasing peri-urban and urban sprawl are subsumed by the greater Kumasi urban planning scheme. In the face of seeming funding challenges facing the central and the municipal governments, there seem not to be any concrete guarantees of the successful take-off and implementation of the broader planning scheme, in order to pull along, the Bosomtwe district plans. The district assembly's policy focus should be geared towards the protection and regulation of prime agricultural and forest lands; as physical development cannot be avoided entirely. It is in this context that, the Bosomtwe district assembly should step-up LULC monitoring efforts in tandem with their lay-out land use planning schemes.
Conclusion
There are a number of factors that influenced peri-urban populace in the Bosomtwe district to convert their lands to other uses, including forested lands. It is clear from the study that economic reasons are major factors. Little income earned from agriculture produce has made the sector less lucrative, deterring smallholder farmers from remaining to engage in agriculture. In all these assertions, the connotations of peri-urbanization pertaining to the Bosomtwe district revealed that the rural landscape is rapidly being transformed in the face of changing demographic structure and infrastructure in the urban periphery.
As a result of urbanization, characterized by increasing population, demand for land, and the conversion of forest and agricultural lands to other land uses particularly, built-up environments (residential, commercial and recreation) as was observed, was high in the Bosomtwe district. Agriculture as an economic activity is gradually losing its profitability among peasant households. The conversion of agriculture forestry and other land uses (AFOLU) into residential and commercial uses has become more lucrative in the short term than subsistence agriculture. These outcomes have perceived negative implications for climate variability and food productivity in the district.
Acknowledgment
The authors are grateful to the German Federal Ministry of Higher Education and research (BMBF), as well as the West African Science and Service Centre of Climate Change and Adapted Land Use, for the financial support for this study. We thank Jemimah Abena Nyamekye for proof-reading the manuscript for language and grammatical coherence. We finally thank the anonymous reviewers for their constructive critique of this paper.
References
- Turner II BL, Skole D, Sanderson S, et al. (1995) Land-use and land-cover change science/research plan. IGBP Global Change Report 35/HDP Report 7, Stockholm, Sweden, and Geneva, Switzerland.
- Geist H, Lambin E (2001) What drives tropical deforestation? A meta-analysis of proximate and underlying causes of deforestation based on sub-national case study evidence. Land-Use and Land-Cover Change (LUCC) Project.
- Hosonuma N, Herold M, De Sy V, et al. (2012) An assessment of deforestation and forest degradation drivers in developing countries. Environmental Research Letters 7.
- Mayfroidt P, Carlson KM, Fagan ME, et al. (2014) Multiple pathways of commodity crop expansion in tropical forest landscapes. Environmental Research Letters 9.
- Fisher B (2010) African exception to drivers of deforestation. Nature Geosciences 3: 375-376.
- DeFries RS, Rudel T, Uriarte M, et al. (2010) Deforestation driven by urban population growth and agricultural trade in the twenty-first century. Nature Geosci 3: 178-181
- Marshall F, Waldman L, MacGregor H, et al. (2009) On the edge of sustainability: Perspectives on peri-urban dynamics. STEPS Working Paper 35, STEPS Centre, Brighton, 1-72.
- Allen A, Davila JD, Hofmann P (2006) The peri-urban water poor: Citizens or consumers? Env Urbn 18: 333-351.
- DeFries RS, Foley JA, Asner GP (2004) Land-use choices: Balancing human needs and ecosystem function. Fron Eco Env 2: 249-257.
- Busck AG, Kristensen SP, Praestholm S, et al. (2006) Land system changes in the context of urbanization: Examples from the peri-urban area of Greater Copenhagen. Danish J Geography 106: 21-34.
- Agrawal M, Singh B, Rajput M, et al. (2003) Effect of air pollution on peri-urban agriculture: A case study. Environ Pollut 126: 323-329.
- Irwin EG, Geoghegan J (2001) Theory, data, methods: Developing spatially explicit economic models of land use change. Agric Ecos Env 85: 7-23.
- Zasada I, Fertner C, Piorr A, et al. (2011) Peri-urbanization and multi-functional adaptation of agriculture around Copenhagen. Danish J Geography 111: 59-72.
- Ravetz A (2013) Remaking Cities (Routledge Revivals) Contradictions of the recent urban environment. Routledge Publications, London.
- Appiah DO, Osman B, Boafo J, et al. (2014) Land use and misuse; human appropriation of land ecosystems services in Ghana. International Journal of Ecosystem 4: 24-33.
- Seto KC, Kaufmann RK, Woodcock CE (2000) Landsat reveals China's farmland reserves, but they're vanishing fast. Nature 406: 121.
- Domson O, Vlosky RP (2007) A strategic overview of the forest sector in Ghana. Louisiana Forest Products Development Center, 1-17.
- Ogutu J (2014) Can it be stopped? Ghana's forests could completely disappear in less than 25 Years'.
- Peprah K, Yiran GB, Owusu BA (2014) Land use trajectories, FCC and the consequential land degradation in the Asunafo forest, Ghana. Int J Innovative Research Studies 3: 488-503.
- Rodriguez JP, Beard TD, Bennett EM, et al. (2006) Trade-offs across space, time, and ecosystem services. Ecol Soc 11: 28.
- Holling CS, Meffe GK (1996) Command and control and the pathology of natural resource management. Conservation Biology 10: 328-337.
- Adanu SK, Van Garderen EA, Lalley J, et al. (2010) Forest cover change in Ho municipality of the Volta region, Ghana. Int J Geosciences 4: 2014.
- Masanja AL (1999) Rationalization and sustainability of land use activities in peri-urban environment: The case study in Kumasi City, Ghana. Unpublished MSc, Thesis Report, University of Science of Technology, UST, Kumasi, Ghana.
- Doos BR (2002) Population growth and loss of arable land. Global Environmental Change 12: 303-311.
- Webster D (2002) On the edge: Shaping the future of peri-urban East Asia. Shorenstein APARC Publications, Stanford, USA.
- Appiah DO, Schroder D, Forkuo EK, et al. (2015) Application of geo-information techniques in land use and land cover change analysis in a peri-urban district of Ghana. International Journal of Geo-Information 4: 1265-1289.
- Heyvaert M, Maes B, Onghena P (2011) Mixed methods research synthesis: Definition, framework, and potential. Qual Quant.
- Creswell JW (2007) An introduction to mixed methods research. SSP, University of Nebraska-Lincoln, USA, 1-43.
- Yamba S, Appiah DO, Pokuaa-Siaw L, et al. (2017) Smallholder farmers' livelihood security option amidst climate variability and change in rural Ghana. Scientifica 2017.
- Singh AS, Masuku MB (2014) Sampling techniques and determination of sample size in applied statistics research: An overview. Int J Econ Comm Magmt 2: 1-21.
- Yamane T (1967) Statistics, an introductory analysis. Harper and Row, (2nd edn), New York, USA.
- King G, Zeng L (2001) Logistic regression in rare events data. Society for Political Methodology 137-163.
- Lambin EF, Geist HJ, Lepers E (2003) Dynamics of land-use and land cover change in tropical regions. Annals of Reviewed Environmental Research 28: 205-241.
- Bajocco S, De Angelis A, Perini L, et al. (2012) The impact of land use/land cover changes on land degradation dynamics: A mediterranean case study. Environ Manage 49: 980-989.
- Afriyie K, Abass K, Adomako JAA (2013) Urbanization of the rural landscape: Assessing the effects in peri-urban Kumasi. Int J Urban Sustainability Dev 6: 1-19.
- Augustin NH, Cummins RP, French DD (2001) Exploring spatial vegetation dynamics using logistic regression and a multinomial logit model. J Applied Ecology 38: 991-1006.
- NBlanco H, Alberti M, Olshansky R (2009) Shaken, shrinking, hot, impoverished and informal: Emerging research agendas in planning. Progress in Planning 72: 195-250.
- Davoudi S, Crawford J, Mehmood A (2010) Planning for climate change: Strategies for mitigation and adaptation for spatial planners. Earthscan, London.
- Deng X, Huang J, Rozelle S, Uchida E, et al. (2005) Cultivated Land Conversion and Potential Agricultural Productivity in China. Land Use Policy 23: 372-384.
- Djurfeldt AA, Jirstrom M (2013) Urbanization and changes in farm size in Sub-Saharan Africa and Asia from a geographical perspective, a review of the literature. Independence Science and Partnership Council.
- Stocker BD, Feissli F, Strassmann KM, et al. (2014) Past and future carbon fluxes from land use change, shifting cultivation and wood harvest. Tellus B.
- Brovkin V, Boysen L, Arora VK, et al. (2013) Effect of anthropogenic land-use and land-cover changes on climate and land carbon storage in CMIP5 projections for the twenty-first century. J Climatology 26: 6859-6881.
- Adjei RS (2010) Effects of action aid ghana land reclamation programme on food production in the GA west municipality of the greater accra region, Ghana. Unpublished MSc Dissertation, University of Cape Coast.
- Acheampong E, Marfo EK, Addo-Danso S (2014) Chainsaw operators, alternative livelihoods options and climate change mitigation. Tropenbos International, Wageningen, The Netherlands.
Corresponding Author
Divine O Appiah, Department of Geography and Rural Development, Kwame Nkrumah University of Science and Technology, Kumasi, Ghana, Tel: +233-201-332-538.
Copyright
© 2018 Appiah DO, et al. This is an open-access article distributed under the terms of the Creative Commons Attribution License, which permits unrestricted use, distribution, and reproduction in any medium, provided the original author and source are credited.