Feasible Magnetic Induction Tomography for Determining Parkinson’s Disease by Biomarker Imaging
Abstract
In order to support patients suffering from Parkinson’s disease caused by irregular aggregation of alpha-synuclein in the brain, an economically affordable and diagnostically effective modality such as magnetic induction tomographyis proposed to differentiate normal and Parkinson’s disease brain tissues based on imaging. MIT technology has been applied in various medical fields due to its advancement in the diagnosis of diseases. It is sensitive to conductivity, permittivity, and permeability of biological tissue. This work focuses on the virtual simulation by COMSOL Multi-physics for the design and development of non-invasive and contactless MIT system that emphasized on 16 channels for Parkinson’s disease detection using primary coils to induce electromagnetic fields in the brain tissue and measured the signals at the receivers. The new horizon can be reached by developing tracers that specifically bind alphasynucleinat different places in the brain (cerebellum and hypothalamus). The simulation model comprises sixteen sensor coils, one act as a transmitter and others are receivers at one period with total of 240 data readings generated. The readings of the receivers and 240 data obtained based on sensitivity of matrices calculation are used for the reconstruction of the images of the non-aggregated and aggregated alpha-synuclein using a linear back projection algorithm.
Keywords
Magnetic induction tomography, COMSOL Multiphysics, Parkinson’s disease, Alpha-synuclein
Introduction
Parkinson’s disease is a chronic neurological disease caused by irregular aggregation of alpha-synuclein in the brain. It remains as a critical disease on account of the recurrence with elderly people which leads to a psychiatric disorder [1]. Computed tomography scan, magnetic resonance imaging, ultrasound, and X-ray are used to detect Parkinson’s disease. Though, they are costly and not effective enough in imaging the brain for Parkinson’s disease detection [2]. The detection of Parkinson’s disease is very challenging and it is essential to determine the subsequent treatment [3]. The medical imaging modalities that are in practice have greater limitations, for instance, γ-ray, X-ray, and computed tomography scan, they use ionizing radiation and which may be hazardous to the patients [4]. Therefore, cheap and reliable method has been developed in order to reduce the difficulties as well as enhance the imaging technique. Furthermore, medical imaging devices, such as ultrasound, electrical impedance tomography, electrical capacitance tomography, and MRI, have some limitations that encouraged the requirements of a modality that iscontactless, cost effective, and do not emit radiation and powerful magnetic field that will harm the patients [5]. For these reasons above, MIT is proposed Parkinson’s disease detection based on the analysis of non-aggregated and aggregated alpha-synuclein inside the brain [6]. Therefore, the objective of this project is to determine the feasibility of MIT for the detecting Parkinson’s disease by using sixteen channels as it is low-cost, non-invasive and not emit ionizing radiation. MIT is a new system which comprises of primary magnetic fields produced by the transmitter coils for inducing eddy current in the biological specimen such as brain tissues [7]. This eddy currents will produce the secondary magnetic field that will be measured by receiver coils [8]. This begins with analysis, verification and validation phases in order to generate 2D brain model with sixteen channels MIT with different coil configurations.
Materials and Methods
The transmitter coil of MIT causesthe primary magnetic field to be produced in to the brain tissue, thereby current will be generated by receiving coils and serves as the magnetic induction mechanism [9]. The excitation coils (primarily coils) induce eddy currents to be measured by receiver coils. The variation of coil design and arrangement are important in developing transmitter and receiver coils. The parameters considered in designing the system are the number of turns in a coil and the coil radius [10]. The higher numbers of turns in a coil are resulting into incrementing the strength of magnetic field at the transmitter coil and inducethe electromagnetic field (e.m.f) at the receiver coil [11]. Furthermore, increasing number of turns will cause the system to be sensitive with mechanical and temperature variations [12]. Resonant frequency at the receiver coil was used to overcome the system being sensitive to both matters [13]. Another parameter that is playing the important roles in the system is the coil radius. Higher partial resolution will be generated from the smaller coil radius at the receiver to measure e.m.f [8].
The current research is based on reconstruction of image of brain tissue modeled to image non-aggregated and aggregated alpha-synuclein for Parkinson’s disease identification by understandingthe electrical conductivity distribution on the biological tissue and phase shift differences of the normal and Parkinson’s disease brain tissues. Using 16 channels MIT, data collection for investigating phase shift in identifying Parkinson’s disease of the body tissue is based on finite Element Analysis (FEA) on normal patient and Parkinson’s disease patient models was followed by reconstructing 2D images of MIT with non-aggregated and aggregated alpha-synuclein. To start with, a sinusoidal AC current with a typical frequency of 10 MHz will flow through the coil excitation and generate a primary magnetic field; It is produced by the transmitter coils to induce eddy currents in the object (brain).
Measurement system in MIT
MIT is operated using the principles of mutual inductance theory for its imaging system [12]. Magnetic induction tomography has 16 coils and are used as transmitters and receivers during the imaging process. Magnetic flux is set up after a sinusoidal current is established [14]. Then, the sinusoidal magnetic flux induces a voltage across the sensor terminals in accordance with mutual inductance theory. If the conductivity distribution between the transmitter and receiver coils is changed, then the induced voltage at the sensing coils will be perturbed. By observing this perturbation, tomographic system will be established after solving the forward and inverse problems [15].
2D Image reconstruction algorithm using MIT
Magnetic induction tomography is sensitive to conductivity, permittivity and permeability of the biological tissue [16]. The conductivity is dominant compared to the permittivity and permeability in biological tissues. Permittivity for biological tissues is smaller than the conductivity at the frequency ranges of (10 kHz-10 MHz) [16]. Magnetic induction tomography consists of a transmitter and receivers, when the eddy current generates the primary magnetic field in the transmitting coil, then the transmitter coil will send the information to the receivers for the reconstruction of the images [17]. General properties of biological tissue and their structures (Figure 1a).
MIT measurements system validation
Magnetic induction tomographic systemincludesinductive coils, a unit for data acquisition, a host computer for data analysis, and image reconstruction site. To enhance the signal level, frequencies ranging from 1-10 MHz were used and this will enable the excitation coils to be driven (Figure 1b). Phantoms of the simulated data were used to study the feasibility of magnetic induction tomography in image reconstruction process. This is because, using magnetic induction tomography, it is simple to produce phantoms of numerous sizes, shapes, and conductivities. In this regard, simulation results can simply be validated against the experimental results in order to compare the simulation and experimental results for the determination of better method of Parkinson’s disease detection based on aggregated alpha synuclein.
COMSOL multiphysics
This section describes the concepts and mathematical equations used in the simulation of 2D models for imaging non-aggregated and aggregated alpha-synuclein for Parkinson’s disease identification based on the mechanism of sixteen channels MIT system. The simulation system is obtained by using COMSOL Multi-physics software based on FEM method, simulated by using numerical method in order to validate analytical solution [18]. The simulation was performed based on the locations, depth and diameter of the material used in the COMSOL Multi-physics software. Then, the study of the output result was analyzed to get the information of the 16 channel magnetic induction for biological tissue (Figure 1c).
Magnetic induction tomography
MIT is used to reconstruct images that are of low resolution with the conductivity as the dominant parameter of the measurement. According to the previous studies, magnetic fields are the fundamental mechanism that converts energy from one form to another by a wire carrying current in the area around it [19]. Then the eddy currents produces secondary magnetic field and it will be measured in the receiver coils (Figure 2). The sensitivity map of MIT 2D image is constructed and then generated in MATLAB. The following are the steps for conducting the sensitivity map: Step 1: Sensors will be excited and the data obtained from CONSOL after the simulation in forms of magnetic vector potential of 128 × 128 pixels grid are saved, Step 2: Dot product of 16 transmitters × 15 receivers = 240 matrix will be conducted, Step 3: The results obtained from the dot product of step two are combined; Step 4: The sensitivity matrix will be normalized after the matrix is divided by its maximum pixel. Sensitivity map changes with respect to the conductive distribution or any others passive electromagnetic properties are due to their material properties background. The sensitivity matrix is the fundamental part in which image vectors can be obtained. The secondary voltage in the two sensing coils is not equal because of the different separations.The geometry of excitation will determine the shape of the sensitivity map in MIT.
16-channels MIT with human brain tissue model
Image reconstruction is used to obtain a good image and to get successful result. This part explains the sixteen channel magnetic induction tomography system setup and the finite element method and criteria of simulation that are involved. MIT and its feasibility for the detection of abnormal accumulation of alpha-synuclein for the detection of Parkinson’s disease are also described.
Numerical simulation model
Numerical simulation model comprises of 16 sensor coils of circular shapes with one coil acts as a transmitter and it is excited by 1A and others act as receivers. The rectangle act as an insulator or air, while the two ellipses represent human brain, two circles (big and small) represent the body and skin and one smallest circle represent fat and two smallest squares represent the accumulated alpha-synuclein (Figure 3a and Figure 3b).
Finite element method (FEM) and simulation criteria
Finite element model was used to conduct finite element analysis of the MIT system [20]. The parameters of this study are presented. Ten MHz frequency was used in the simulation process and β scattering region was chosen because this is where mostly the pathological changes occur. CONSOL Multiphysics software was used for the simulation. Various parameters were chosen for this simulation inside the CONSOL Multiphysics software. Equation (3.1) is used in CONSOL Multiphysics software to generate the distribution of magnetic vector potential for the model. Magnetic induction tomography (MIT) with sixteen channel was applied on the brain tissue by primary magnetic fields that are produced by the transmitter coils to induce eddy currents in the object. This eddy current will produce secondary magnetic field that will be measured by the receiver coils.
(2.1)
µ is the permeability of the medium (henry/meter) and e is the permittivity of the medium (farad/meter), ϭ is the conductivity of the medium (siemens/meter), ω 2 is the angular frequency, J e is the current density (ampere/meter 2 ) and A is the magnetic vector potential (A). The finite element method is a numerical method used for solving problems of electromagnetic and structural analysis problems [21]. The method proves the approximate values of the unknowns at discrete number [21]. It divides large problem into smaller parts called finite elements (Figure 4).
Fundamental principles of MIT
Magnetic induction tomography utilizes inductive coils to map the electromagnetic properties of an object (brain). The fundamental principle of MIT can be explained by using the basic mutual inductance and eddy current theories. By passing an alternating current into an excitation coil, a primary magnetic field can be generated, which induces an electric field that can be detected by the measuring coils.
Resolution (RES)
The width and the height of the images define the resolution. Resolution processes the reconstructed of the alpha-synuclein with respect to the entire medium.The equation of the resolution is expressed as:
(2.2)
A q represents the number of pixels of the reconstructed alpha-synuclein and A o represents the number of pixels of the whole medium of reconstruction.
Magnification (MAG)
The purpose of using the magnification is to compare the size of the reconstructed aggregated alpha synuclein, RES ( q ) with the original size of the aggregated alpha synuclein, RES ( t ). If magnification is equal to 1, therefore, the size of the reconstructed image is identical to the original image, refer to equation (2.3).
(2.3)
Position error
Position error determines the images of the reconstructed accumulated alpha-synuclein in such a way that the alpha-synuclein represents the target location. As shown below:
(2.4)
r t Represents the reconstructed of the brain model with accumulated alpha-synuclein and r q represents the position from the centroid of the whole image (region of interest (ROI)).
Shape deformation (SD)
Shape deformation is used to measure the extent to which a reconstructed aggregated alpha synuclein follows the shape of the circular target. This can be achieved when the number of reconstructed aggregated alpha synuclein pixels, A o outside a circle, which is of corresponding area, with the number of pixels covering the entire reconstructed aggregated alpha synuclein’s region, A q . An image with better quality has a low and uniform SD, refer equation (2.5).
(2.5)
Phase shift measurement
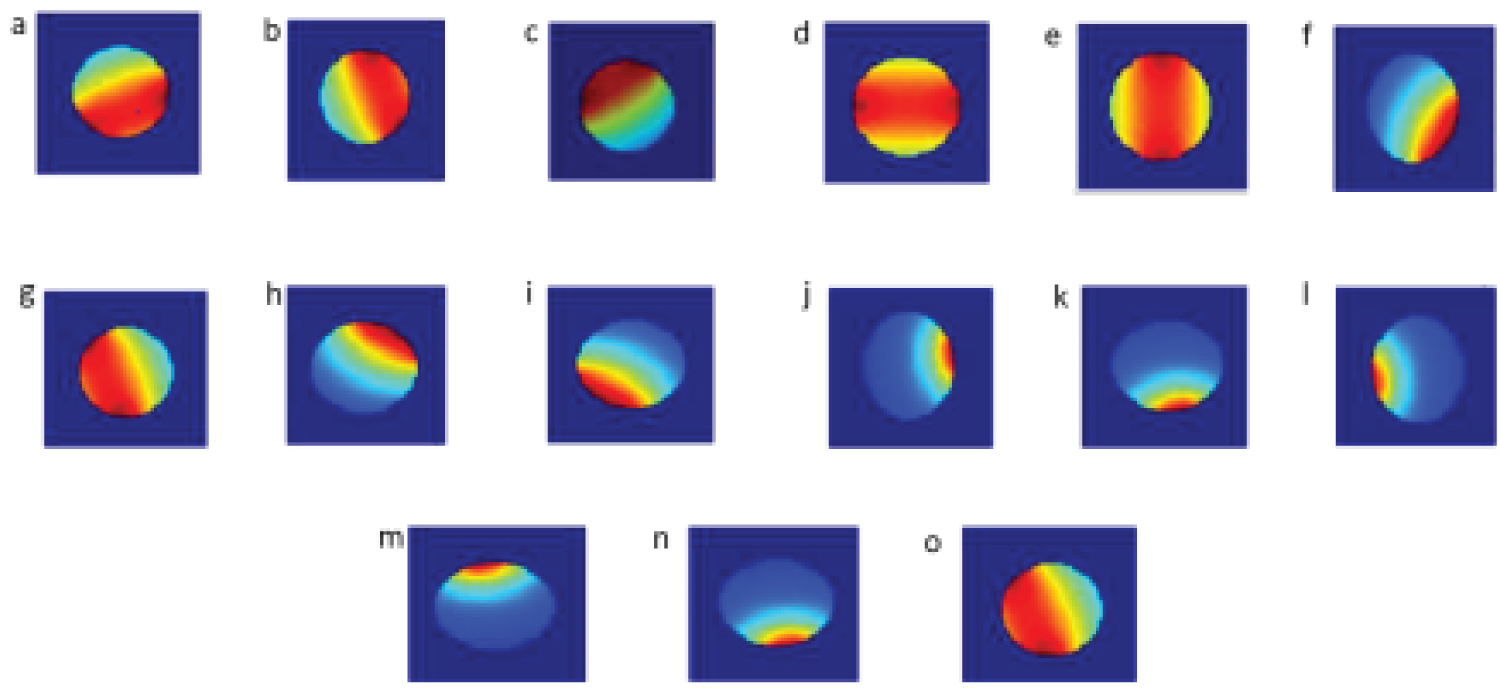
This technique is important to investigate the disease such as Parkinson’s disease. Through the result of the inductive phase shift, it can be able to detect the accumulated alpha-synuclein in the brain tissue. Inductive phase has the ability to differentiate the normal body tissue and the infected body tissue. The resulting phase shift depends on the divergence of the induced current density received by the receiver coil (Figure 5, Figure 6 and Figure 7). Sensitivity matrix will be used for the image reconstruction. The quality of the reconstructed images is analyzed by using GREIT Standard in Matlab. This experiment determines the qualities of the reconstructed images.
Results and Discussion
Image reconstruction algorithm and analysis
After the simulation experiment was conducted, the images of the simulated results were reconstructed by using LBP (Linear Back Projection) and followed by image analysis based on resolution and position error.
Sensitivity map of MIT 2D image
Due to the previous simulation studies in image reconstruction algorithm, sensitivity map is an essential part of some image reconstruction algorithm [22]. The ‘x’ and ‘y’ are the particular detector elements response to the position of a small perturbation in object material properties, which is under the defined excitation conditions. Thus, the map will be released by the sweeping perturbation over the entire of object space (Figure 8). The geometry of excitation can determine the shape of the sensitivity map in MIT. Further, sensitivity map is form of magnetic field and electrical field that created directly from the eddy current or magnetic field itself [23]. Also, the sensitivity map change with respect for a conductive distribution or any others passive electromagnetic properties are due to their material properties background [24]. Researches revealed that sensitivity maps can be used to invert the MIT data to two-dimensional images, which describes the response of the system to every pixel, for every detection coil, with every excitation coil energized in turn [25].
Image quality assessment (RES and PE)
The GREIT Standard is known as Graz consensus reconstruction algorithm for the electrical impedance tomography. This GREIT standard is used to define the quality of image as well as enhances the image quality, the size, location and shape for a material tested. For a pilot study, it is sufficient to observe an initial outcome of an image reconstruction algorithm by using parameters in GREIT standard for instance resolution (RES) and positioning error (PE). Sensitivity function of an array describes about the degree to which a small change in the resistivity of a section of the subsurface that can influence the electric potential measured by the particular array. The higher the value of the sensitivity function, the greater is the influence of the subsurface region on the measurement. Some array provides better response over the vertical changes while other provides better resolution for horizontal changes.
MIT employs inductive coils for mapping the electromagnetic properties of an object. The fundamental principles of MIT can be explained by using the basic mutual inductance and eddy current theories by passing an alternating current into an excitation coil, a primary magnetic field can be generated, which induces an electric field that can be detected by a measuring coil. From this field the induced voltage can be measured. Thus, the MIT problem is essentially an eddy current problem; hence it is also called eddy current tomography. Note that in the context of this research, the electrical conductivity of the object (brain) is the focus of the passive electromagnetic properties. All the results were processed in Matlab software in order to reconstruct image after the simulation in COMSOL Multi-physics. The results are shown based on the reconstructed image corresponding with the simulated image of the non-aggregated and aggregated alpha-synuclein.
LBP based reconstructed brain MIT images
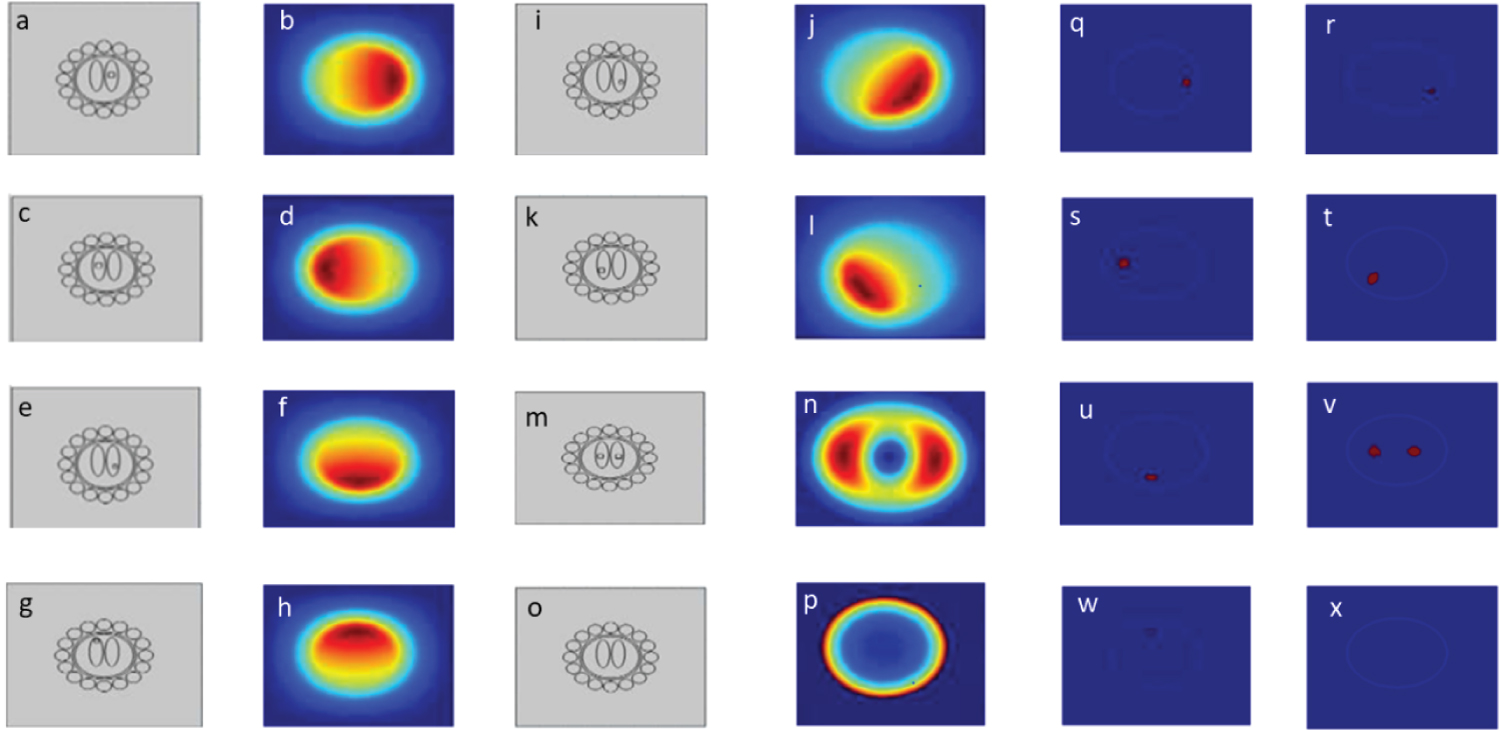
In this study, a linear back projection was used as a basis image reconstruction algorithm and 24 images are presented (Figure 5). The linear back projection algorithm used multiplication of matrix to reconstruct the images. In order reconstruct image, sensitivity matrix is multiplied by its resultant sensor reading. Non-aggregated and aggregated alpha-synuclein images have been modeled using MIT system of COMSOL Multiphysics with different sizes at different coordinates, (a) Magnetic induction system of COMSOL model of brain with biomarker alpha-synuclein at right position (0.031,-0.015), (b) Simulated result of biomarker alpha-synuclein at right position, (c) Magnetic induction system of COMSOL model with biomarker alpha-synuclein at left position (0.03,-0.02), (d) Simulated result of biomarker alpha-synuclein at left position, (e) Magnetic induction system of COMSOL model with biomarker alpha-synuclein at lower position (0.035,-0.027), (f) Simulated result of biomarker alpha-synuclein at lower position, (g) Magnetic induction system of COMSOL model with alpha-synuclein at upright position (0.032,-0.01), (h) Simulated result of alpha-synuclein at upper position, (i) Magnetic induction system of COMSOL model of alpha-synuclein at inferior position, (0.033,-0.03), (j) Simulated result of alpha-synuclein at inferior position, (k) Magnetic induction system of COMSOL model with alpha-synuclein at lateral position (0.034,-0.014), (l) Simulated result of alpha-synuclein at lateral position, (m) Magnetic induction system of COMSOL model of alpha-synuclein at right and left positions (0.036,-0.013), (n) Simulated result of alpha-synuclein at right and left position T1R14, (o) Magnetic induction system of COMSOL model of normal person (0.0325,-0.04), (p) Simulated result of normal person, (q) Reconstructed image of aggregated alpha-synuclein at right position, (r) Reconstructed image of aggregated alpha-synuclein at lateral position, (s) Reconstructed image aggregated alpha-synuclein at left position, (t) Reconstructed image aggregated alpha-synuclein at angular position, (u) Reconstructed image ofaggregated alpha-synuclein at lower position, (v) Reconstructed image of aggregated alpha-synuclein at right and left positions, (w) Reconstructed image of aggregated alpha-synuclein at upper position, (x) Reconstructed image of non-aggregated alpha-synuclein in brain tissue (Figure 8). Based on the images obtained by using MIT, the proposed MIT system is feasible and successful in locating and identifies the position of accumulated alpha-synuclein in the brain, however, not precisely identified. The contactless nature of this type of tomography makes the technique of interest for non-invasive and non-intrusive applications. The technique was operated when passing an alternating current through the excitation coil(s) produced by the primary magnetic field. When this magnetic field interacted with the conductive object, a secondary magnetic field was created. The sensing coils detected the secondary field (Figure 9).
Measurement of phase shift
Measurement of phase shift is important for the measurement of an induced voltage of the biological tissue. The voltage differences can be determined using this phase shift technique. The figures above show the investigation of the phase shift to identify the normal and infected brain with PD by induced voltage phase shit reading with 15 coil configuration based on Finite Element Method. This new method of alpha synuclein detection for Parkinson’s disease identification could predict an unknown size of alpha-synuclein in the brain. Location was varied for each alpha-synuclein size. When the alpha-synuclein was moved from the centroid of the brain, some changes can be observed in the inductive phase shift readings.
Conclusion
Abnormal accumulation of alpha-synuclein is a disease caused as a result of PD. Imaging of abnormal accumulation of alpha synuclein for the identification of Parkinson’s disease has been successfully conducted by using 16 Channels Magnetic Induction Tomography coupled with COMSOL Multi-physics. The developed system was able to reconstruct the images of non-aggregated and aggregated alpha-synuclein. A simulation of 16 channels MIT is proposed to prove of this concept by using the method to reconstruct image in biological tissue without constructing a more complicated hardware system. The 16 channelled sensing coil, Tx1-Rx15 is used to detect the aggregated alpha-synuclein for Parkinson’s disease. This system is suitable since the reconstructed images of the non-aggregated and aggregated can be differentiated based on sizes and locations. Based on the image quality assessment results, the smallest detectable infection radius is 0.12 cm. The current research has successfully developed and reconstructed the non-aggregated and aggregated images of the brain model by using simulation method of magnetic induction of tomographic system of COMSOL Multiphysics supported by Matlab software. For future work, the simulation has to consider in dynamic experiment tissue with multi sizes and shape as in real applications because the human brain consists of multi-layer of biological tissues. Further, the 2D version of the human body tissue and the numerical model could cause aggregation of error data. In order to solve these problems, the next project should create a 3D magnetic induction tomography system.
References
- Zou W, Pu T, Feng W, et al. (2019) Blocking meningeal lymphatic drainage aggravates Parkinson’s disease-like pathology in mice overexpressing mutated α-synuclein. Transl Neurodegener 8: 1-17.
- Pagano AG, Niccolini F, Politis M (2016) Imaging in Parkinson’s disease. Clin Med(Lond) 16: 371-375.
- Bruno L, Repasky M, Beuming T, et al. (2019) Improved docking of polypeptides with glide. Journal of Chemical Information and Modeling 53: 1689-1699.
- El-Gamal FEZA, Elmogy M, Atwan A (2016) Current trends in medical image registration and fusion. Egyptian Informatics Journal 17: 99-124.
- Excitations M. Electrical Impedance Tomography. 1-19.
- Mier W, Mier D (2015) Advantages in functional imaging of the brain. Frontiers in Human Neuroscience 9: 1-6.
- Mansor MSB, Zakaria Z, Balkhis I, et al. (2015) Magnetic induction tomography: A brief review. Jurnal Teknologi 73: 91-95.
- Ma L, Soleimani M (2017) Magnetic induction tomography methods and applications: A review. Measurement Science and Technology 28.
- Gruber B, Froeling M, Leiner T, et al. (2018) RF coils: A practical guide for nonphysicists. J Magn Reson Imaging 48: 590-604.
- Feldkamp JR, Quirk S (2019) Internal magnetic induction tomography using a single coil. Progress in Electromagnetics Research 164: 97-107.
- Smith RT, Jjunju FPM, Young IS, et al. (2016) A physical model for low-frequency electromagnetic induction in the near field based on direct interaction between transmitter and receiver electrons. Proc Math Phys Eng Sci 472: 20160338.
- Xiang J, Dong Y, Zhang M, et al. (2019) Design of a magnetic induction tomography system by gradiometer coils for conductive fluid imaging. IEEE Access.
- Jeon J, Son H (2017) Design improvement of magnetic induction tomography using the extended Distributed Multi-Poles and equivalent circuit modeling. IEEE/ASME International Conference on Advanced Intelligent Mechatronics, AIM 940-945.
- Software CM. Software : A review on its applications.
- Heil K, Schmidhalter U (2019) Geophysical Sensor EM 38.
- Narayanamurthy V, Padmapriya P, Noorasafrin A, et al. (2018) Skin cancer detection using non-invasive techniques. RSC Advances 8: 28095-28130.
- Li F, Soleimani M, Abascal J (2019) Planar array magnetic induction tomography further improvement. Sensor Review 2: 257-268.
- Zakaria Z, Rahim RA, Mansor MSB, et al. (2012) Advancements in transmitters and sensors for biological tissue imaging in magnetic induction tomography. Sensors 12: 7126-7156.
- Seo JK, Woo EJ (2014) Electrical tissue property imaging at low frequency using MREIT. IEEE Trans Biomed Eng 61: 1390-1399.
- Tan C, Wu Y, Xiao Z, et al. (2018) Optimization of dual frequency-difference MIT sensor array based on sensitivity and resolution analysis. IEEE Access 6: 34911-34920.
- Olaiju OA, Hoe YS, Ogunbode EB (2018) Finite element and finite difference numerical simulation comparison for air pollution emission control to attain cleaner environment. Chemical Engineering Transactions 63: 679-684.
- Plevris V, Markeset G (2018) Educational challenges in computer-based Finite Element Analysis and design of structures. Journal of Computer Science 14: 1351-1362.
- Cui Z, Wang Q, Xue Q, et al. (2016) A review on image reconstruction algorithms for electrical capacitance/resistance tomography. Sensor Review 36: 429-445.
- Klein M, Erni D, Rueter D (2020) Three-dimensional magnetic induction tomography: Improved performance for the center regions inside a low conductive and voluminous body. Sensors 20: 1306.
- Dekdouk B, Ktistis C, Armitage DW, et al. (2016) Absolute imaging of low conductivity material distributions using nonlinear reconstruction methods in magnetic induction tomography. Progress in Electromagnetics Research-pier 155: 1-18.
Corresponding Author
Subash CB Gopinath, Institute of Nano Electronic Engineering, Universiti Malaysia Perlis (UniMAP), Perlis, Malaysia; Faculty of Chemical Engineering Technology, Universiti Malaysia Perlis (UniMAP), Perlis, Malaysia.
Copyright
© 2023 Adam H, et al. This is an open-access article distributed under the terms of the Creative Commons Attribution License, which permits unrestricted use, distribution, and reproduction in any medium, provided the original author and source are credited.