Research on Drag Reduction Characteristics of Wind Turbine Airfoil Surface Microstructure
Abstract
The objective of this work is to investigate the effect of the bionic microstructure surface on DU21 aerofoil. The motivation behind this study is to investigate the effect of the bionic microstructure parameters including the location, interval between two microstructures, groove sizes of microstructure under different working conditions in order to improve the drag reduction characters. The numerical simulation is performed on the bionic microstructure model using the RNG k-ε model. It is found that: when the groove size is less than 0.15 mm, the drag can be reduced with any inflow speeds. When the groove size is 0.2 mm or 0.3 mm, the drag reduction effect can be achieved only when the inflow speed is relatively small. The resistance increases with any inflow speed when the groove size is up to 0.5 mm. The viscous resistance gradually increases, and the differential pressure resistance gradually decreases with the interval size increasing. There is a minimum resistance value when the groove depth h = 0.075 mm and the maximum drag reduction rate is up to 3.62%. Drag reduction mechanism of the microstructure was also studied. When the fluid passes through the microstructure, a stable reverse vortex flow is formed inside the groove, so that there is no direct contact between the fluid and the wall surface, thereby achieving a drag reduction effect. The vorticity values inside the grooves of the microstructure are smaller than that of the smooth airfoil and the turbulent kinetic energy and turbulent dissipation rate at the bottom of the groove are very small.
Keywords
DU21 Airfoil, Bionic microstructure, Drag reduction mechanism, Boundary layer
Nomenclature
c: Chord length; CF: Friction stress coefficient: d: Horizontal spacing; F: Total resistance on the smooth surface; : Total resistance on the ridged surface; : Total resistance on the smooth surface; : Total resistance on the ridged surface; Fx: X-direction component of the external force; Fy: Y-direction component of the external force; Fz: Z-direction component of the external force; h: Microstructural height; h+: Dimensionless height of microstructure; p: Pressure value on the micro-element; s: Microstructural spacing; s+: Dimensionless spacing of microstructure; Sk: User-defined turbulent kinetic energy; Sε: Turbulent dissipation terms; : Incoming flow speed; : The wall tangential stress velocity; y: The height from the wall; y+: The dimensionless distance from the wall; : Dynamic viscosity coefficient; : Density of the fluid; - Tangential wall stress; γ: Total drag reduction rate; γs: Total drag reduction rate; : The kinematic viscosity coefficient
Introduction
Energy has become the material basis for the survival and development of human society. Energy issues play a decisive role in national security, social progress, and economic development. As a kind of clean and renewable energy, wind energy is paid more and more attention by countries all over the world. In order to further improve the efficiency of wind turbine power generation, many efforts have been made in the direction of drag reduction. The way of drag reduction gradually develops from large scale (reducing body resistance) to small scale and even to micro scale (reducing friction resistance). Inspired by bionics, Biomimetic microstructures can effectively improve the turbulent boundary layer structure and reduce the friction resistance on the surface of objects. At present, researchers have done a lot of exploratory research on biomimetic microstructure and made a lot of achievements. Chen, et al. [1] proposed a new type of bionic humanoid groove through quantitative analysis of the structural parameters of pigeon feathers. It is found that the maximum drag reduction rate can reach 16%, and the maximum shear stress is mainly concentrated around the herringbone groove tip. Pu, et al. [2] found that the maximum drag reduction rate of bionic shark skin is up to 12.5%, which is higher than the corresponding maximum drag reduction rate of membrane material with a smooth surface. Luo, et al. [3] established the precise digital models of the shark surface microstructure and carried out the detailed numerical simulation to the microstructure surface flow field. They found that the microgrooves on the shark skin could increase the viscous bottom layer and have a significant role in inhibiting turbulence and reducing wall viscosity resistance. Wen, et al. [4] studied and analyzed the flow characteristics of microgrooves along the vertical, longitudinal and spread directions, and found that the non-closed structure of the microgrooves would lead to the interaction with external fluids. Daeian, et al. [5] observed that increasing the spacing and depth of grooves could further achieve drag reduction by adding micro-structure grooves to the wall of two-dimensional parallel plate channels. Bixler, et al. [6] arranged the non-smooth microstructure in the closed pipe, which proved that the non-smooth microstructure could reduce the pressure during the flow process and thus achieve drag reduction. Yang, et al. [7] found that grooves can change the spatial morphology and scale of coherent structures and reduce the dynamic energy exchange between the near-wall fluid and the outer zone. Rastegari, et al. [8] used lattice Boltzmann algorithm (LBM) to simulate the drag reduction effect on the surface of the forward-facing micro groove, the spreading micro groove and the micro column. The microstructure surface can reduce the turbulent kinetic energy in the boundary layer and make the flow more stable. Bai, et al. [9,10] studied four kinds of micro-groove surface, V groove, rectangular groove, zigzag groove and dome groove, which showed that good drag reduction effect, could be obtained on the surface of V groove and groove structure parameters have significant influence on drag reduction performance. Martin, et al. [11] used numerical simulation to explore the influence of factors such as groove depth, groove width and groove spacing on drag reduction effect. The vortex structure generated on the surface of the trench is observed and the effective drag reduction rate of 10% is obtained. Raayai-Ardakani, et al. [12] simulated the drag reduction effect of sinusoidal groove surface in laminar flow state, and explored the influence of width to depth ratio, surface length and other factors on the drag reduction effect. Wang, et al. [13] conducted an experimental test on the resistance of the transverse trench in the high-speed water tunnel and obtained a drag reduction rate of about 13%. Gu, et al. [14] numerically simulated the flow field on the surface of inclined microstructures with the Reynolds stress model (RSM). The influence of the flow direction and the inclination angles was investigated. It showed that the viscous resistance decreases significantly when the speed and inclination angle increase. Wu, et al. [15] researched the drag-reduction characteristics of the bionic surface with delicate water-trapping microstructures of fish with experimental method. Gu, et al. [16] analysed the influence of the jet aperture, the jet angle and the rotational velocity coupled with the jet velocity on the friction torque acting on a jet surface model by using a jet surface drag reduction testing experimental platform. Schrader [17] explored possibilities of reducing skin-friction drag by the compliant surface which delay the transition from laminar to turbulent flow.
In recent years, applying the microstructures to the airfoil surface has gradually increased. Chamorro, et al. Chamorro, et al. [18] carried out experimental research by attaching grooves to the back half of turbine blades. It is found that the drag reduction is determined by the change of groove height. Domel, et al. [19] arranged the printed shield scale structure on the airfoil surface and found that the printed bionic structure can effectively reduce the resistance and improve the lift effect. Zhang, et al. [20] carried out the experiments and computational research for aero engine blade with micro-texture in order to explore the drag reduction performance. The comparison results show that the established drag reduction model of textured blade has better drag reduction performance than that of un-textured blade and verify that the proposed methods to determine the placement position of micro-texture on blade surface and to optimize drag reduction performance of textured blade are satisfied. Zhang, et al. [21] studied the function of dragonfly wing microstructure during glide flight, showing that zigzag wing structure can reduce drag during glide flight. Sidhu, et al. [22] studied the drag reduction performance of airfoil coated with V-shaped micro-groove film through experimental and theoretical analysis. It is found that the resistance reduction rate is 6.6%, and 3.5 resistance points are reduced by calculation. Faisal, et al. [23] conducted experimental research on shape modification of NACA0018 airfoil and found that relatively good performance is achieved even in stall conditions, while increasing the maximum lift coefficient. Ghazali, et al. [24] attached the triangular groove to the upper surface of NACA0026 symmetrical airfoil. Experiments and fluid simulation jointly proved the role of the triangular patch. Sasahara, et al. [25] processed a series of microgrooves on the surface of the airfoil by using sharding milling technology. The results show that crescents and discontinuous ridges effectively reduce the laminar separation zone, thus reducing the drag on the airfoil.
In most of the previous studies, the researches on the drag reduction effects of the bionic microstructure are based on the plate surface. The effects of the sizes parameters, shape characteristics have mostly been studied respectively, but not interactively. In addition, there are few studies on the drag reduction effects of the location of microstructures and the interval between two microstructures on aerofoil surface. As part of efforts to fill the knowledge gap, the model of the V-shaped microstructure is established. The numerical simulation carried out using the RNG model. Research has focused on the following areas: (1) Drag reduction effects of the location of microstructures on aerofoil surface; (2) Effects of parameters of microstructures and the interval between two microstructures on drag reduction with different velocities; (3) The mechanism of microstructural drag reduction is also explored.
The remainder of the paper is organized as follows: Section 2 briefly reviews the establishment of biomimetic microstructure model and fundamentals of numerical simulation. In Sections 3, the drag reduction effects of the location on the aerofoil surface, different shape parameters and size of microstructures are presented and discussed. In Sections 4, the mechanism of microstructure drag reduction is discussed. Finally, the findings of the present study are summarised.
Establishment of Governing Equations and Models
Aerofoil model and the design of the biomimetic microstructure
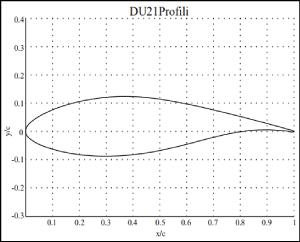
Compared with traditional wind turbine airfoils, DU series airfoils have higher maximum lift, lift-to-drag ratio, slow stall characteristics at large an attack, lower roughness sensitivity and lower noise. Therefore, the DU21 airfoil is selected as the research object in this paper. The maximum relative thickness of the airfoil is 20.94%, which is located at 31.4% chord length. The maximum curved surface is 2.3%, which is located at 69.7% chord length; The relative leading-edge radius is 2.3%. The geometric characteristic curve of the airfoil is shown in Figure 1.
For wind turbines, the frictional resistance generated by the viscosity during fluid flow is a crucial factor affecting its aerodynamic performance. A large number of experiments have been done on the wall microstructure of different cross-sectional shapes, and the results show that the V-shaped micro groove has the best drag reduction effect [26-28]. In this paper, the V-shaped microstructures are applied to the surface of the airfoil in order to reduce the flow loss caused by the fluid flowing on the surface of the wind turbine blade. The geometric parameters of V-shaped microstructures are shown in Figure 2. For the convenience of explanation, the microstructures that are higher than the airfoil line are called riblets (Figure 2a), and the microstructures that are lower than the airfoil line are called grooves (Figure 2b). In the Figure 2, h is the vertical height from the vertex of the V-shaped microstructure to the airfoil surface, s is the projection width of a single microstructure on the airfoil surface, and d is the projection distance on the airfoil surface between the two microstructures. In this paper, the grooves are used to investigate the effect of the bionic microstructure parameters.
The dimensionless height h+ and the dimensionless distance s+ of the microstructures are defined as:
Where
Where can be obtained according to the empirical formula:
The dimensionless height and spacing of the microstructures can be estimated as
The height h of the bionic microstructure surface and the width s of the bionic microstructure surface are important factors that affect the drag reduction effects. According to Walsh, et al.'s conclusion of experimental study on drag reduction effect of micro-structure, the surface of micro-structure has good drag reduction effect at dimensionless height and spacing [28] .Therefore, the bionic microstructures will be designed using this conclusion in this paper.
Basic governing equation and turbulence model
Computational fluid dynamics is the numerical simulation of fluid motion under the control of the basic equations of mass conservation, momentum conservation and energy conservation. The outer flow field of the airfoil is usually regarded as a turbulent flow in adiabatic, incompressible and isothermal state, and there is no energy exchange with the outside, so the energy equation can be ignored in the solution process.
Mass conservation equation:
Momentum conservation equation:
In the formula: p is the pressure value on the micro-element: are the components of the viscous force generated between fluid molecules; Fx, Fy and Fz are all external forces on the micro-element.
The core function of the turbulence model is to connect the newly generated unknowns with the known average velocity gradient. The simulation results depend on the accuracy of the turbulence model. The RNG k-ε model is used in this paper. RNG k-ε is derived from the transient N-S equation. Compared with the standard k-ε model, there are many improvements: the RNG model adds a condition to the ε equation and considers the turbulent vortex, which improves the calculation accuracy.
The equations of turbulent kinetic energy k and turbulent dissipation ε of the RNG k- ε model are as follows:
Where
Meshing and boundary conditions
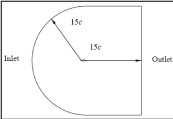
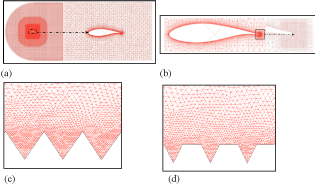
Figure 3 shows the external flow field of the DU21 aerofoil. The chord length c of the aerofoil is 100 mm. The distances from the leading edge of the aerofoil to the inlet of the flow field and from the tailing edge of the aerofoil to the outlet of the flow field are both 15 times the chord length. The unstructured grids are used to divide the flow field. The mesh layout adopted in this study is shown in Figure 4a. To ensure calculation accuracy, mesh refinement is performed at a distance of 2c around the airfoil shown in Figure 4a and mesh refinement is also performed near the trailing edge shown in Figure 4b. The number of grids at positions far away from the airfoil should be reduced as much as possible when the accuracy requirements are guaranteed in order to speed up the calculation process. Meshing of some trench models is shown in Figure 4c (which is for the microstructure s = h = 0.5 mm, d = 0, and Figure 4d which is for the microstructure s = h = d = 0.3 mm). Note that, in order to predict the mean properties of the turbulent boundary layer with a reasonable accuracy, the first layer of the grid height with relative to the aerofoil surface is about 3.5 μm for all of cases, which typically results in the wall-unit of y+ < 1 at the microstructure region.
The boundary conditions of the computation zone are set as follows: The velocity profile is used as the inlet boundary condition for the left side, upper and lower sides of the computation zone. In the following calculations, if there is no special indication, the inflow velocity is 30m/s, Reynolds number is 2 × 10⁵. The pressure outlet boundary conditions are used for the right side of the computation zone. The aerofoil surface is set as a non-slip solid wall boundary condition. The turbulence condition is set as the turbulence intensity and length scale. The turbulence intensity is set to 0.2% according to the standard of common wind tunnel turbulence, and the turbulence length scale is set to 0.007m.
The pressure-velocity base coupling solver and the Least Squares Cell Based for the gradient in the spatial discretization are used. The solution method adopts SIMPLEC for the discrete analysis, the centre interpolation and separation dispersion format for the pressure, and the second-order upwind format for the discrete conditions of momentum, turbulent dissipation rate and turbulent kinetic energy. In the under-relaxation factor setting, the pressure is 0.3, the density is 1, the volume force is 1, the momentum is 0.6, the volume fraction is 0.6, the turbulent flow energy is 0.6, and the turbulent dissipation rate is 0.8. The reference area and the reference length are set in the reference value, which are set as 0.1 m2 and 0.1m respectively. The residual monitor is set to 10-4 at first, and the calculation stops after 1000 steps meet any of the above, then, the residual is modified to 10-8.
Grid independence verification
The number of grids in the computational domain not only affects the accuracy of numerical simulation results, but also affects the duration of simulation process. In order to reduce the error caused by the number of grids and improve the computing efficiency, the grid independence verification is carried out. In order to reduce the calculating time for grid independence verification, the suction surface and pressure surface of the aerofoil DU21 is divided equally into 5 parts according to the chord length respectively. The position distribution is marked as C1, C2, C3, C4 and C5, as shown in Figure 5. The microstructures are only placed at the C2 position of the suction surface. Grid refinement is performed on the location where the microstructure is placed, and the grids at the remaining locations are consistent with the grid number of the smooth surface airfoil.
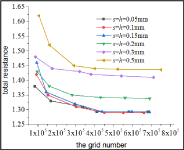
Six different grid density defined as the total number of grid nodes are calculated under the condition that the y+ < 1 is met at the aerofoil surface. Table 1 shows the number of grids of some cases of microstructures to prepare for the following grid independence verification. Figure 6 shows the total resistance under different grid numbers using the turbulence model RNG k-ε. It is found that the drag force is relatively stable when the grid number is more than 35 × 105. In order to have a more effective use of the computational time, the numerical grid scheme is chosen as follows: for the case d = 0, s = h = 0.05 mm, the grid number is 41.2 × 10⁴, for the case d = 0, s = h = 0.1 mm, the grid number is 45.5 × 10⁴, for the case d = 0, s = h = 0.15 mm, the grid number is 43.8 × 10⁴, for the case d = 0, s = h = 0.2 mm, the grid number is 43.8 × 10⁴, for the case d = 0, s = h = 0.3 mm, the grid number is 39 × 104, for the case d = 0, s = h = 0.5 mm, the grid number is 40.7 × 10⁴. Note that the number of microstructure models for grid independence verification is huge, and the number of meshes for different models is not the same. We will not list them all here.
Validation of turbulence model
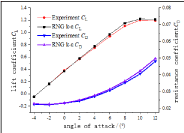
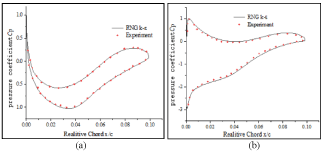
In order to verify the calculation accuracy of the turbulence model, the lift and drag coefficients of the aerofoil with smooth surface at different attack angles are calculated. Comparison of lift and drag coefficients with experimental results is shown in Figure 7. It shows that the maximum error of the lift coefficient is 4.2% at attack angle 10°, and the maximum error of drag coefficient is 3.8% at attack angle 12°. Lift and drag coefficient obtained by numerical simulation are slightly larger than than the experimental results, but it is within an acceptable range. The comparison of pressure coefficients obtained by numerical simulation with experimental results at two attack angles is shown in Figure 8. It shows that the gap between the pressure coefficient obtained by numerical simulation and the experimental results is very small. The calculated value and the test value fit perfectly at small attack angle. However, there is a slight gap at attack angle 10°, but the gap is also within a reasonable and acceptable range.
Results and Discussion
This section will present numerical simulation results pertaining to the resistance reduction by the microstructures. The huge data set from the calculation cannot be fully presented here. Thus, only selected results are given that allow to assess the influences of the microstructure parameters on the resistance reduction.
The effect of the groove location on the drag reduction
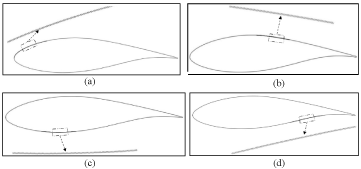
This section investigates the variation of the resistance with varying the location of the grooves on the aerofoil surface. The airfoil suction surface and pressure surface are divided into 5 parts respectively, as shown in Figure 5. The schematic diagram of the grooves position arranged on the suction or pressure surfaces is shown in Figure 9.
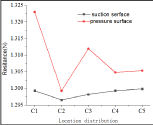
When the grooves are arranged at different positions on the suction or pressure surface of the airfoil, corresponding resistance values are shown in Figure 10. It found that the resistance value obtained by arranging the groove on the suction surface is less than arranging the groove on the pressure surface. When the grooves are arranged at the position C2 on the suction surface, the resistance value is the smallest. However, when the grooves are arranged at the position C1 on the pressure surface, the maximum resistance value is obtained. In fact, the grooves are arranged at the position C2 on the pressure surface; the resistance value is relatively small. It shows that arranging microstructures at position C2 has a better drag reduction effect, whether it is on the suction or pressure surface of the aerofoil. Therefore, the grooves are arranged at the C2 position on the suction surface in the following research.
The effect of the groove depth on the drag reduction
Compared with a smooth airfoil, when fluid flows through the groove structures, a higher static pressure area will be generated at the windward side of the groove, while there is lower static pressure at the leeward side of the groove. Due to the front and rear distribution of high and low pressure, a pressure differential resistance opposite to the incoming flow speed will be generated. Therefore, for the aerofoil with grooves, the total resistance includes two parts, viscous resistance and differential pressure resistance. The drag reduction effect of the groove is calculated by comparing the total resistance value of the smooth reference airfoil and the grooved airfoil under the same working condition. Generally, the drag reduction rate is used to indicate the effect of drag reduction, the equation is as follows:
Where, F is the total resistance on the smooth surface; is the total resistance on the ridged surface, is the total drag reduction rate. is the total resistance on the smooth surface; is the total resistance on the ridged surface, is the total drag reduction rate.
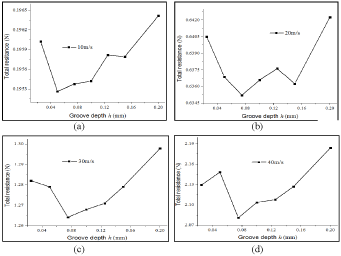
In order to investigate the effect of the groove depth on airfoil drag, the groove width and the Distance between grooves are fixed, only the sizes of the groove depth h is changed. Here, let the groove width s = 0.1 mm, d = 0, the groove depth h = 0.025 mm, 0.05 mm, 0.075 mm, 0.1 mm, 0.125 mm, 0.15 mm and 0.2 mm. Total resistance changes with groove depth at different velocities are shown in Figure 11. It is found that when the groove depth h = 0.05 mm, the total resistance of the aerofoil is up to the minimum value with the inflow velocity = 10 m/s. However, the minimum values of the total resistance are obtained when the groove depth h = 0.075 mm with the inflow velocity = 20, = 30, = 40 m/s. It shows that the drag reduction effect of the microstructure is not only related to the groove depth, but also depends on the inflow velocity. Maximum drag reduction rate of microstructure at different speeds is summarized in Table 2. It shows that there is the maximum drag reduction effect when the depth of the grooves is h = 0.075 mm with the inflow velocity = 30m/s. The maximum drag reduction rate reaches 3.14%.
The effect of the groove spacing size on the drag reduction
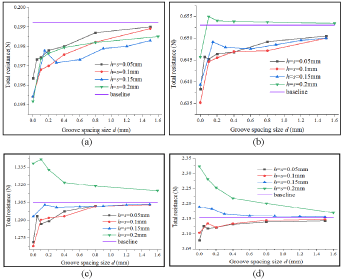
In order to investigate the effect of the groove spacing size on airfoil drag, seven kinds of groove spacing sizes (d = 0, 0.05 mm, 0.1 mm, 0.2 mm, 0.4 mm, 0.8 mm, 1.5 mm) are discussed for four cases (h = s = 0.05 mm, 0.1 mm, 0.15 mm, 0.2 mm). Total resistance changes with groove spacing size at different velocity are shown in Figure 12. It shows that the total resistance of the aerofoil increases with the increase of inflow velocity, no matter smooth aerofoil or non-smooth aerofoil with grooves. For the case h = s = 0.05 mm or 0.1 mm, the resistance of a micro-structured aerofoil is always less than that of a smooth aerofoil at any inflow velocity. However, for the case h = s = 0.15 mm or 0.2 mm, micro-structured aerofoil can reduce drag at a low-speed while can increase drag at a high speed. In addition, when the micro-structure airfoil is in the drag reduction state, the drag reduction effect decreases and gradually approaches the drag value of the smooth aerofoil as the groove spacing size increases. When the micro-structure airfoil is in a state of increasing resistance, the effect of increasing resistance decreases and gradually approaches the resistance value of a smooth airfoil with the groove spacing size increase.
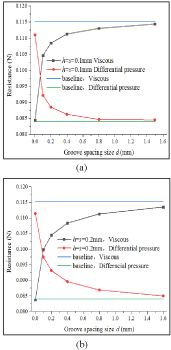
Resistance changes with groove spacing size at = 10 m/s is shown in Figure 13 for cases h = s = 0.1 mm and h = s = 0.2 mm. It shows that the differential pressure resistance of the grooved structure aerofoil is always greater than that of the smooth aerofoil, while the viscous resistance of the grooved structure aerofoil is always less than that of the smooth aerofoil. When the groove spacing size is less than d = 0.4 mm, the change of the groove spacing size has a great influence on both the viscous resistance and the differential pressure resistance. The resistance value of a grooved structure aerofoil almost equal to that of a smooth aerofoil when the groove spacing size is d = 1.5 mm. Compared with the resistance of a smooth aerofoil, the increase in differential pressure resistance of the grooved structure aerofoil is always smaller than the decrease in the viscous resistance. This is the reason why the total resistance of the grooved aerofoil can be less than that of the smooth aerofoil.
Drag reduction rate of three typed of the grooves at different speeds with the spacing size d = 0 is summarized in the inflow speed increases for the cases h = s = 0.05 mm and h = s = 0.1 mm. When the groove size h = s = 0.1 mm, the maximum total drag reduction rate can reach about 2.86% at the inflow speed = 30 mm/s. For the cases h = s = 0.05 mm, the viscosity drag reduction rate increase as the inflow speed increases while the total drag reduction rate increase first and then decrease. The total drag reduction rate is even negative when the inflow velocity is up to = 40 mm/s.
Analysis of Drag Reduction Mechanism of Microstructure
In this section, the near-wall parameters of the microstructure (including velocity distribution, vorticity and turbulence parameters) is explored in order to find out the drag reduction mechanism of the microstructure in the form of groove structure. The formation process of the swirling vortex in the grooves is also discussed.
Velocity distribution on airfoil surface
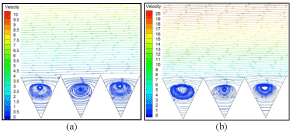
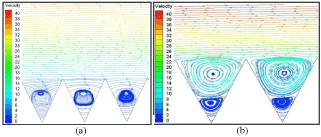
The influence of different groove sizes and different incoming flow speeds on the velocity distribution near the wall is discussed. The velocity streamline near-wall for the case h = s = 0.1 mm, d = 0 at the speed = 10 and 20 m/s are shown in Figure 14. It shows that the stable reverse vortex flow is formed inside the groove. The change of inflow velocity has little effect on the size and position of the vortex inside the groove. The velocity streamline near-wall for the case h = s = 0.05 mm, d = 0 and h = s = 0.5 mm, d = 0 with the speed = 40 m/s are shown in Figure 15. It shows that the rotating vortex in the large-size groove is larger, and the intensity is higher compared with that of smaller groove at the same inflow velocity.
Generally, the micro-groove structure mainly affects the velocity distribution inside and near the wall of the groove and has little effect on the external flow field. The reverse vortex flow formed inside the groove makes the inflow not directly contact the wall surface, thus forming an air cushion effect between the fluid and the wall surface. The reverse vortex flow creates a viscous resistance in the groove opposite to the total resistance; therefore, the viscous resistance of the air flowing through the top of the groove is greatly reduced, thereby effectively suppressing the total resistance.
Vorticity distribution on airfoil surface
The vorticity is used as a parameter to measure the strength and direction of the vortex. As the vorticity increases, the strength of the vortex also increases. The larger the vorticity value, the more small-scale vortices are generated in the vortex, and more energy is consumed at the same time. Therefore, the energy loss of the boundary layer can be intuitively reflected by the vortex value.
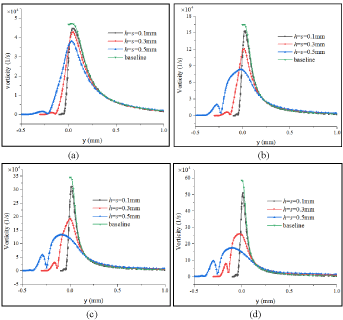
The vorticity distribution of the smooth aerofoil and the aerofoil with grooves in the vertical direction of the surface with different inflow speeds is shown in Figure 16. Noted that the groove is selected at the position 0.3 c, that is, 30 mm from the origin point of the aerofoil. The coordinate of the x-axis is the distance perpendicular to the airfoil surface from the apex of the groove. It shows that, the vorticity value increases with the increase of the inflow speed for both smooth aerofoil and grooved aerofoil. The speed gradient increases correspondingly when the speed is higher. The vortex line is easier to be torn and thinned under the action of the higher speed gradient, which will produce more vorticity components. In addition, the vorticity in the bottom of the groove is very low for all of groove sizes. The vorticity gradually increases when the distance from the wall increases. The maximum value of vorticity is at near the aerofoil surface, and the smooth aerofoil has the largest vorticity value. The larger the groove size, the maximum vorticity value is smaller. However, at the bottom of the groove, large groove size has large vorticity value. After leaving the groove, the vorticity decreases rapidly with the increase of the distance from wall. The value is close to the smooth aerofoil when the distance is far away from the near wall surface.
Shear stress distribution on airfoil surface
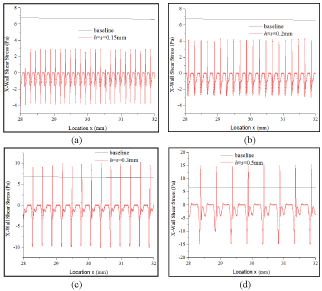
The wall viscous resistance is obtained by the shear stress of the airfoil wall, so the discussion of the wall shear stress can intuitively reflect the viscous resistance. Shear stress distribution near-wall with the inflow velocity = 30 m/s is shown in Figure 17 for the case: h = s = 0.15 mm, h = s = 0.2 mm, h = s = 0.3 mm and h = s = 0.5 mm. It shows that the extreme value of the wall shear stress gradually increases as the groove size increases. The x-axis is the distribution of grooves along the chord length of the airfoil. The wall shear stress at the bottom of the groove is almost zero, and the wall shear stress is the largest at the sharp point where the groove model is in direct contact with the inflow. For the case h = s = 0.3 mm and h = s = 0.5 mm, the value of wall shear stress is greater than the smooth.
Conclusions
In this paper, the RNG k-ε turbulence model is used to simulate the flow field of DU21 aerofoil and the aerofoil with microstructure. The optimal drag reduction program is found by changing the groove location, depth, spacing size of the microstructure. The influence of the microstructure on the near wall of the aerofoil is also studied and found out the microstructure drag reduction mechanism based on the boundary layer theory. The key findings of this paper are listed as follows:
(1) The resistance value obtained by arranging the groove on the suction surface is less than arranging the groove on the pressure surface. Arranging microstructures at position C2 has a better drag reduction effect. When the grooves are arranged at the position C2 on the suction surface, the resistance value is the smallest. However, when the grooves are arranged at the position C1 on the pressure surface, the maximum resistance value is obtained.
(2) The drag reduction effect of the microstructure is not only related to the groove depth, but also depends on the inflow velocity. The total resistance of the aerofoil is up to the minimum value when the groove depth h = 0.05 mm with the inflow velocity = 10 m/s. However, the minimum values of the total resistance are obtained when the groove depth h = 0.075 mm with the inflow velocity = 20, 30, 40 m/s.
(3) The total resistance of the aerofoil increases with the increase of inflow velocity, no matter smooth aerofoil or non-smooth aerofoil with grooves. For the case h = s = 0.05 mm or 0.1 mm, the resistance of a micro-structured aerofoil is always less than that of a smooth aerofoil at any inflow velocity. However, for the case h = s = 0.15 mm or 0.2 mm, micro-structured aerofoil can reduce drag at a low-speed while can increase drag at a high speed. The differential pressure resistance of the grooved structure aerofoil is always greater than that of the smooth aerofoil, while the viscous resistance of the grooved structure aerofoil is always less than that of the smooth aerofoil.
(4) Generally, the micro-groove structure mainly affects the velocity distribution inside and near the wall of the groove and has little effect on the external flow field. The reverse vortex flow formed inside the groove makes the inflow not directly contact the wall surface, thus forming an air cushion effect between the fluid and the wall surface. The reverse vortex flow creates a viscous resistance in the groove opposite to the total resistance; therefore, the viscous resistance of the air flowing through the top of the groove is greatly reduced, thereby effectively suppressing the total resistance.
References
- Chen HW, Rao F, Shang XP, et al. (2013) Biomimetic drag reduction study on herringbone riblets of bird feather. J Bionic Eng 10: 341-349.
- Pu X, Li G J, Huang H (2016) Preparation, anti-biofouling and drag-reduction properties of a biomimetic shark skin surface Biol Open 5: 389-396.
- Luo Y H, Liu Y F, Anderson J, et al. (2015) Improvement of water-repellent and hydrodynamic drag reduction properties on bio-inspired surface and exploring sharkskin effect mechanism. Appl Phys 120: 369-377.
- Wen S, Wang WB, Wang J (2017) Study on drag reduction mechanism of rotating disk with micro-grooves. Proc I Mech E Part A: J Power and Energy 1-14.
- Daeian MA, Moosavi A, Nouri-Borujerdi A, et al. (2017) Drag reduction in channel with microstructure grooves using lattice Boltzmann method .Journal Physics D Applied Physics 50: 1-19.
- Bixler GD, Bhushan B (2013) Shark skin inspired low-drag micro structured surfaces in closed channel flow. J Colloid Interface Sci 393: 384-396.
- Yang SQ, Li S, Tian HP, et al. (2016) Tomographic PIV investigation on coherent vortex structures over shark-skin-inspired drag-reducing riblet. Acta Mechanica Sinica 32: 284-294.
- Rastegari A, Akhavan R (2015) On the mechanism of turbulent drag reduction with super-hydrophobic surfaces. J Fluid Mech 773: 1-14.
- Bai QS, Meng XP, Liang YC, et al. (2015) Static and dynamic interface characteristics between functional micro-structure and water. IJNM 11: 13-24.
- Bai QS, Bai JX, Meng XP, et al. (2016) Drag reduction characteristics and flow field analysis of textured surface. J Friction 4: 165-175.
- Martin S, Bhushan B (2016) Fluid flow analysis of continuous and segmented riblet structures. RSC Advances 6: 10962-10978.
- Raayai-Ardakani S, Mckinley GH (2017) Drag reduction using wrinkled surfaces in high Reynolds number laminar boundary layer flows. Phys Fluids 29: 093605.
- Wang B, Wang J, Zhou G, et al. (2014) Drag reduction by micro vortexes in transverse microgrooves. Adv Mech Eng 734012.
- Gu Y-q, Fan T-x, Mou J-g, et al. (2017) Characteristics and mechanism investigation on drag reduction of oblique riblets. J Cent South Univ 24: 1379-1368.
- Wu LY, Jiao ZB, Song YQ, et al. (2018) Experimental investigations on drag reduction characteristics of bionic surface with water-trapping microstructures of fish scales. J Scientific Reports 8: 12186.
- Yunqing Gu, Song wei Yu, Jie-gang Mou, et al. (2019) Experimental study of drag reduction characteristics related to the multifactor coupling of a bionic jet surface. Journal of Hydrodynamics 31: 186-194.
- Schrader LU (2019) Passive drag reduction via bionic hull coatings. J Ship Res 63: 206-218.
- Chamorro LP, REA Arndt, Sotiropoulos F (2013) Drag reduction of large wind turbine blades through riblets: Evaluation of riblet geometry and application strategies. Renew Energy 50: 1095-1105.
- Domel AG, Saadat M, Weaver JC, et al. (2018) Shark skin-inspired designs that improve aerodynamic performance. J R Soc Interface 15: 20170828.
- Zhang C, Bijay KS (2018) Investigation on drag reduction performance of aero engine blade with micro-texture. Aerosp Sci Technol 72: 380-396.
- Zhang S, Ochiai M, Sunami Y, et al. (2019) Influence of microstructures on aerodynamic characteristics for dragonfly wing in gliding flight. J Bionic Eng 16: 423-431.
- Sidhu BS, Saad MR, Ahmad KZK, et al. (2016) Riblets for airfoil drag reduction in subsonic flow. ARPN J Eng Appl Sci 11: 7694-7698.
- Faisal KM, Salam MA, Ali MAT, et al. (2017) Flow control using moving surface at the leading edge of aerofoil. J Mech Eng 47: 45-50.
- Ghazali MI, Harun Z, Ghopa WAW, et al. (2016) Computational fluid dynamic simulation on NACA 0026 airfoil with v-groove riblets. Int J Adv Sci Eng Inf Technol 6: 529-533.
- Sasahara H, Kuroda K, Xu K et al. (2012) Generation of surface pattern by using a patch division milling and its influence on the flow-field around the aerofoil. The 12th euspen International Conference 2: 501-504.
- Bechert DW, Bartenwerfer M, Hoppe G, et al. (1986) Drag reduction mechanisms derived from shark skin. ICAS, 15th Congress, 1044-1068.
- Choi H, Moin P, Kim J (1993) Direct numerical simulation of turbulent flow over riblets. J Fluid Mech 255: 503-539.
- Walsh MJ (2013) Turbulent boundary layer drag reduction using riblets. JAIAA 6: 769-787.
Corresponding Author
Minghui Zhang, Department of Mechanical and Electronic Engineering, Shandong University of Science and Technology, Qingdao, 266590, China.
Copyright
© 2022 Zhang M, et al. This is an open-access article distributed under the terms of the Creative Commons Attribution License, which permits unrestricted use, distribution, and reproduction in any medium, provided the original author and source are credited.

