Three-Dimensional Computational Fluid Dynamic Analysis of a Large-Scale Vertical Axis Wind Turbine
Abstract
The vertical axis wind turbine (VAWT) configuration has many advantages for an offshore wind turbine installation. The VAWT is omnidirectional and its rotating mechanical components can be placed close to sea level. In this paper, the three dimensional (3D) computational fluid dynamics analysis of a large-scale 5 MW VAWT is conducted. At the optimum tip-speed ratio (TSR), the VAWT maximum inline force was 75% larger than the maximum lateral force. It was found the dynamic stall effects cause the VAWT flow field to become increasingly asymmetrical at the mid-span plane, when the TSR is reduced. The 3D CFD analysis demonstrated that the blade tip vortex strength and magnitude varies with the blade azimuthal position. The attachment of end plates to the blade tips, resulted in a performance improvement during the upwind phase with the average blade torque coefficient in this range being increased by 4.71%. Conversely, during the blade downwind phase a reduction in performance was found due to the increase in drag from the end plates and the average blade torque coefficient in this phase was reduced by 23.1%.
Keywords
Wind energy, Vertical axis wind turbine (VAWT), Computational fluid dynamics, Aerodynamics, Dynamic stall
Introduction
The growing need for energy, the limitations of fossil fuels and the increasing concerns over climate change has motivated the development of the offshore wind industry [1]. Wind energy conversion devices can be classified into two primary types of the horizontal axis wind turbine (HAWT) and the vertical axis wind turbine (VAWT). The VAWT is receiving renewed interest due to its suitability for the offshore floating environment. In comparison to the HAWT, the VAWT has a lower center of gravity and is omni-directional negating the need for a complex yaw mechanism [2,3]. There exists a number of approaches to simulate the aerodynamics of a VAWT. Aerodynamic analysis of VAWTs has been conducted using streamtube models [4], vortex models [5], panel models [6] and with Computational Fluid Dynamics (CFD) [7-9].
With the advancement of computing hardware, the utilization of CFD has become increasingly popular in the numerical modeling of wind turbine aerodynamics by solving the Navier-Stokes equations [10]. Ever since, the very first VAWT CFD studies were attempted over a decade ago, engineers and aerodynamicists have strived to perform 3D CFD investigations of these machines in order to understand in greater detail the generated complex flow physics [11]. The 3D CFD unsteady simulation of the VAWT aerodynamics is seen as the most complete high fidelity analysis method, but also the most computationally demanding and is therefore reserved for the final analysis stage. In the last few years, thanks to the growth in computational resources (analogous to Moore's law), an increasing number of 3D studies have been published. Lam and Peng [12] investigated the near and far wake development of a H-type VAWT using 2D and 3D CFD simulations. It was demonstrated the 2D CFD model overestimated the turbine performance and this was similarly observed by Howell, et al. [13]. A 3D Unsteady Reynolds-Averaged Navier-Stokes (URANS) study of a H-type VAWT operating in skewed flow was undertaken by Orlandi, et al. [14] and showed a performance improvement due to the reduced wake velocity effects on the turbine's downwind region. Balduzzi, et al. [15] simulated the 3D unsteady aerodynamic effects experienced by a single VAWT blade using computational hardware consisting of more than 16,000 processor cores. The study elucidated the generation of the blade tip vortices, dynamic stall phenomenon and blade/wake interaction. In a recent study, these CFD results by Balduzzi et al. were compared with the predictions from a lifting line free vortex wake model [16].
Previous studies have also concentrated on the aerodynamic design and optimisation of the VAWT design by using 3D CFD simulations. Marsh, et al. [17] employed a 3D URANS model to compare the performance of a straight-bladed turbine with a helical-bladed turbine configuration. It was identified the straight-bladed turbine configuration was more efficient than the helical turbine. In the works by Alaimo, et al. [18] and Castelli and Benini [19], VAWTs with helical blades were also examined. Subramanian, et al. [20] studied the effect of VAWT solidity and the airfoil profile on the performance of a small-scale VAWT with a 3D CFD model. It was established that thicker airfoils perform better at low tip-speed ratios (TSRs) due to a longer duration of attached flow and a high solidity turbine performs better at lower TSRs. Zamini, et al. [21] employed 3D CFD simulations to examine the influence of J-shaped blades on VAWT performance at low and moderate TSRs. It was found this unique blade shape improved the turbine self-starting and aerodynamic efficiency characteristics. Wang and Zhuang [22] investigated the effect of sinusoidal serrations on the blade leading-edge at low TSRs in a low Reynolds number flow regime. The results showed the onset of dynamic stall can be suppressed by using leading-edge serrations and a performance improvement was achieved. Shahizare, et al. [23] utilised a 3D CFD model to examine the effects of various guide-vane setting angles on the performance of a shrouded VAWT for an urban installation. Elkhoury, et al. [24] used 3D Large Eddy Simulations to investigate the performance of a VAWT with an integrated variable-pitch system. It was established the four-bar-linkage variable-pitch VAWT gave better performance compared to a fixed-pitch VAWT design. So far, the limited number of 3D simulation studies has concentrated solely on small-scale VAWT aerodynamics and usually include only the VAWT's blades in their simulations, therefore disregarding the inherent parasitic structural elements (i.e. the support struts and the tower). In this paper, the 3D CFD simulation of the 5 MW VAWT presented is described. It is worth noting here, that this is the first 3D CFD simulation study of a multi-megawatt scale VAWT to be conducted.
Moreover, a thorough exploration of the literature reveals that the majority of existing studies have predominately focused on the VAWT performance (i.e. Key metrics such as efficiency and torque come to the fore), with little known about the immediate wake flow field developed by the VAWT at various operating regimes under tip-speed ratio control. The evolution of a VAWT wake contributes significantly to its operation and performance, as well as the VAWTs installed in the vicinity. The inherent unsteady and three-dimensional aerodynamics of VAWTs has hitherto limited the research on wake evolution. In particular, a good understanding of the VAWT wake is imperative in the design of a VAWT offshore floating wind farm, where downstream turbines can potentially be located in the wake of the upstream turbines and subsequently influence the performance of the whole wind farm. Furthermore, research on the VAWT blade tip vortex dynamics is limited.
Concerning the existing literature on VAWT wakes, Brochier, et al. [25] conducted one of the first experimental studies on the wake flow downstream of a VAWT with measurements from a H-rotor in a water channel. Bergeles, et al. [26] undertook wind tunnel experiments using a hot wire in the near-wake region of a Darrieus turbine. The mean wake velocity and turbulence level profiles at two downstream positions (x/D = 0.55 and x/D = 1) were reported for TSRs between 4 and 7. Tescoine, et al. [27] examined the near-wake of a low solidity H-rotor using stereoscopic PIV technique. Besides experimental methods, some numerical studies have been used to investigate the wakes behind VAWTs. Lam and Peng [12] demonstrated that the 3D blade tip vortices have a critical role in the VAWT's rapid wake recovery and thus the 3D CFD approach is required for VAWT wake analysis, in order to capture the complete flow field physics. Table 1 provides a concise overview of the previous VAWT wakes studies undertaken to date.
Energised by the growing availability of HPC, the results of a unique set of 3D CFD simulations conducted on a cluster of multi-core processors are reported. This chapter will elucidate the wake flow field developed and important aerodynamic phenomena created by the 5 MW VAWT at selected TSR regimes principal to its operating procedure. In particular, attention is given to the optimum and stalled regulated functioning cases. This chapter also provides a detailed description of the main 3D aerodynamic effects associated with the VAWT performance, including blade dynamic stall and the tip vortex generation, with important observations highlighted. To the best of the author's knowledge, the present study represents the most detailed numerical solution of the flow field past a utility-scale VAWT undertaken to date.
CFD Simulation Methodology
The software ANSYS® Fluent® 16.0 is used to solve the unsteady Reynolds-Averaged Navier-Stokes (U- RANS) equations. In previous work [7], a CFD simulation methodology to numerically model the unsteady aerodynamics of a large-scale VAWT blade at high Reynolds numbers is outlined and this methodology is utilised in this study. The aforementioned study extensively examined the most optimum CFD modelling approach by a series of sensitivity analyses and the validity of this method was assessed with wind tunnel experimental data by Wickens [30]. In particular, it was demonstrated the Spalart-Allmaras (S-A) turbulence model gave a representation of the VAWT dynamic stall event very similar to the more complex k - ω SST model, but with a 80% reduction in the simulation time needed [7]. Therefore, the S-A turbulence model is used in this study, as it has been demonstrated to provide the most desirable compromise between model fidelity and computational requirement. Table 2 provides an overview of the employed CFD simulation methodology.
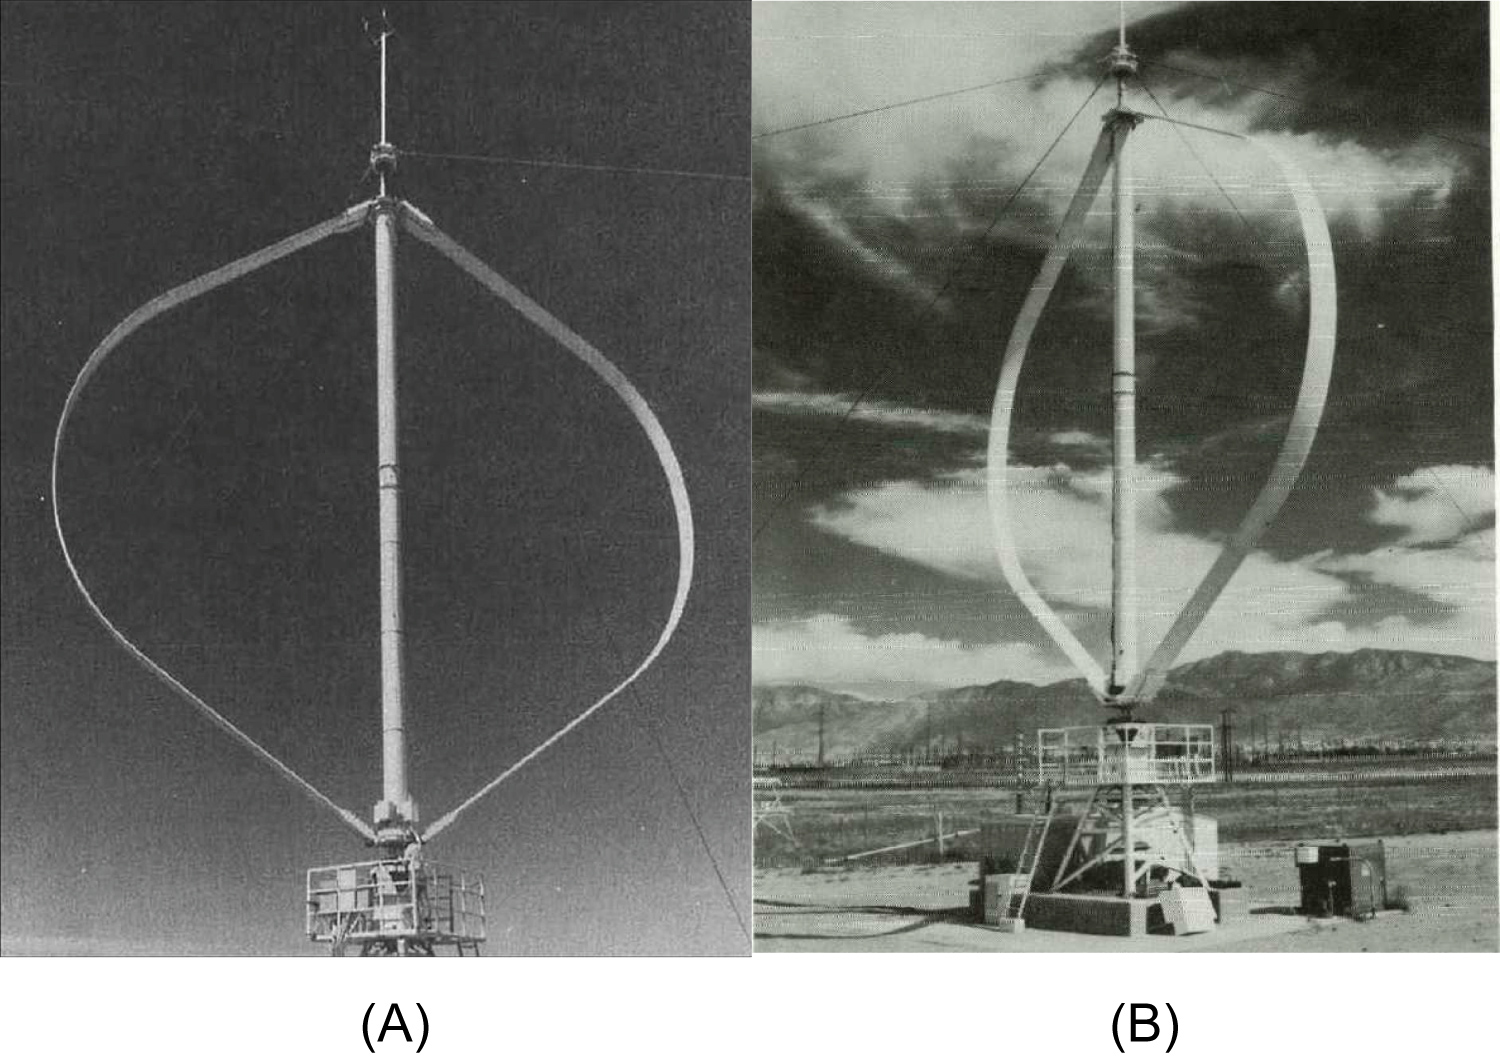
This CFD methodology was further validated with available mid-span VAWT experimental blade force measurements at high Reynolds numbers (Re > 106) from the Sandia National Laboratories (SNL) 17-m Darrieus turbine shown in Figure 1.
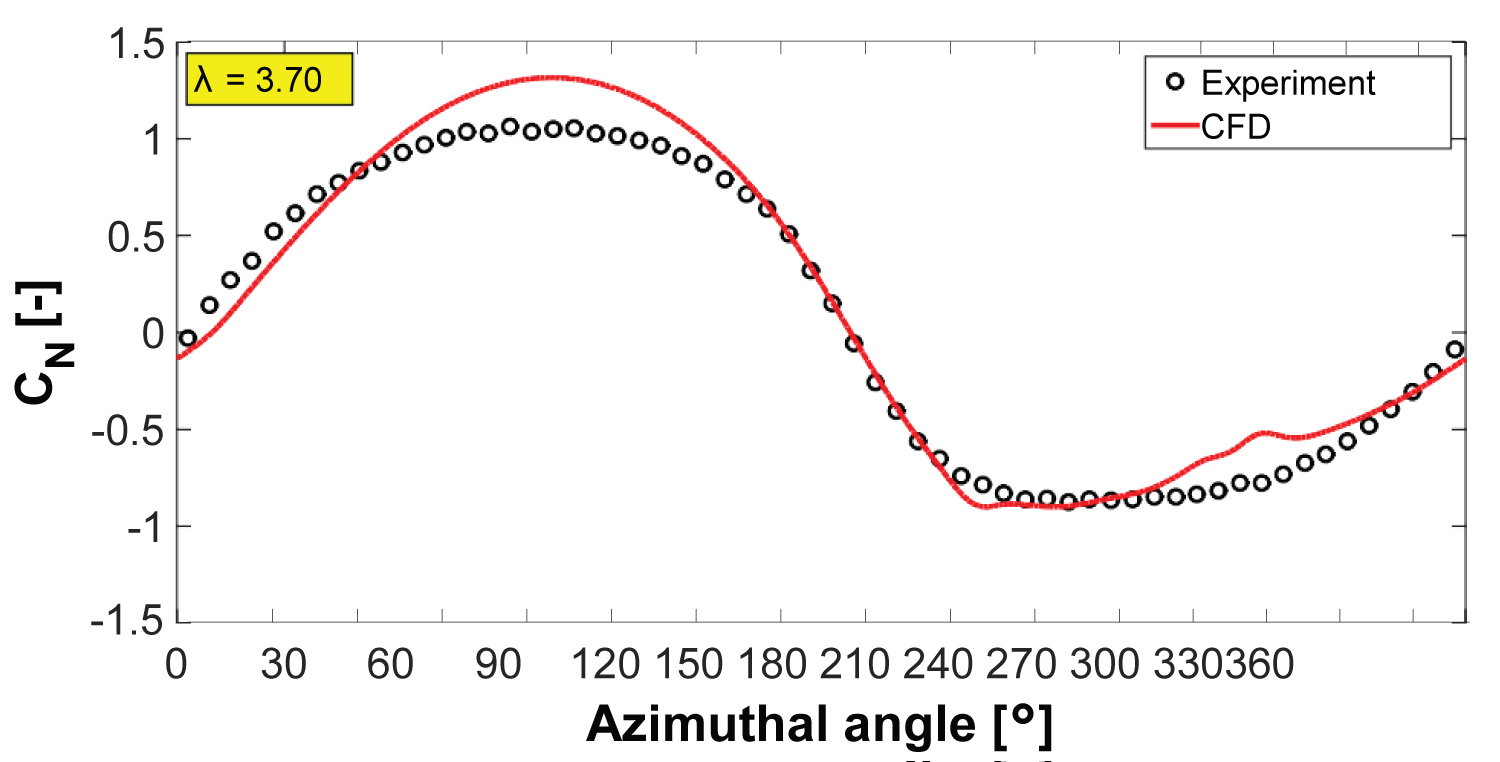
Figure 2 shows the predicted blade normal force coefficient at the turbine mid-span plane at λ = 3.70. It is evident that the CFD simulation methodology predicts accurately the blade aerodynamic force, as the level of deviation between the measured and predicted values is small.
3D CFD simulation
5 MW VAWT design
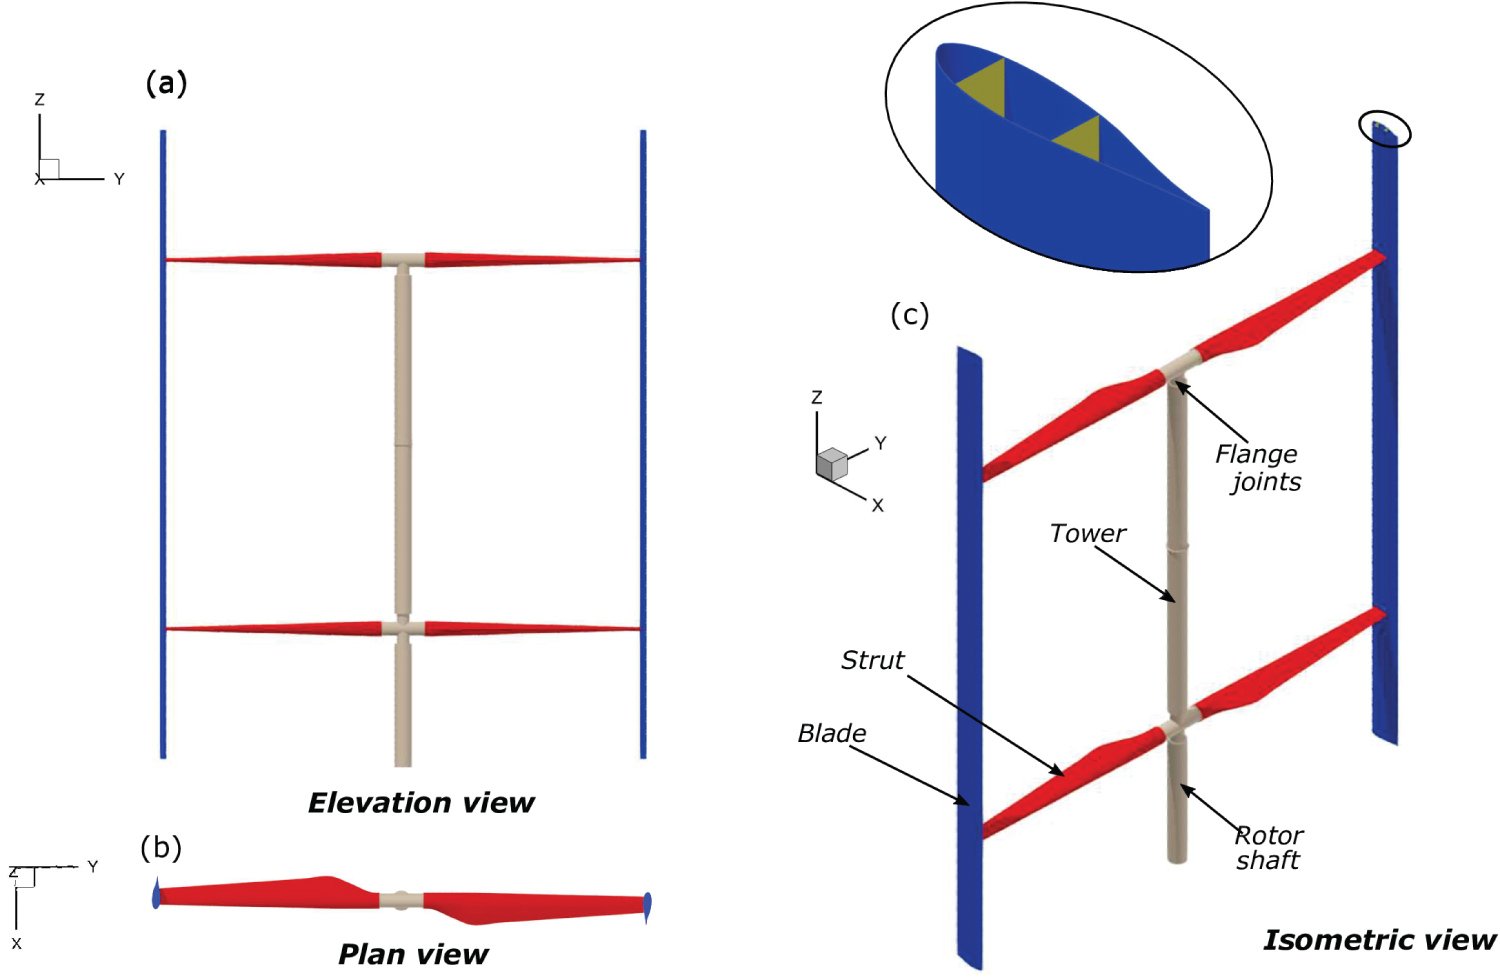
Geometrical details: In previous work Ref. [34], the conceptual design of a large-scale 5 MW VAWT was outlined. Table 3 outlines the geometrical details of the 5 MW VAWT and the 3D computer-aided design representation of the turbine is shown in Figure 3.
Computational domain and boundary conditions
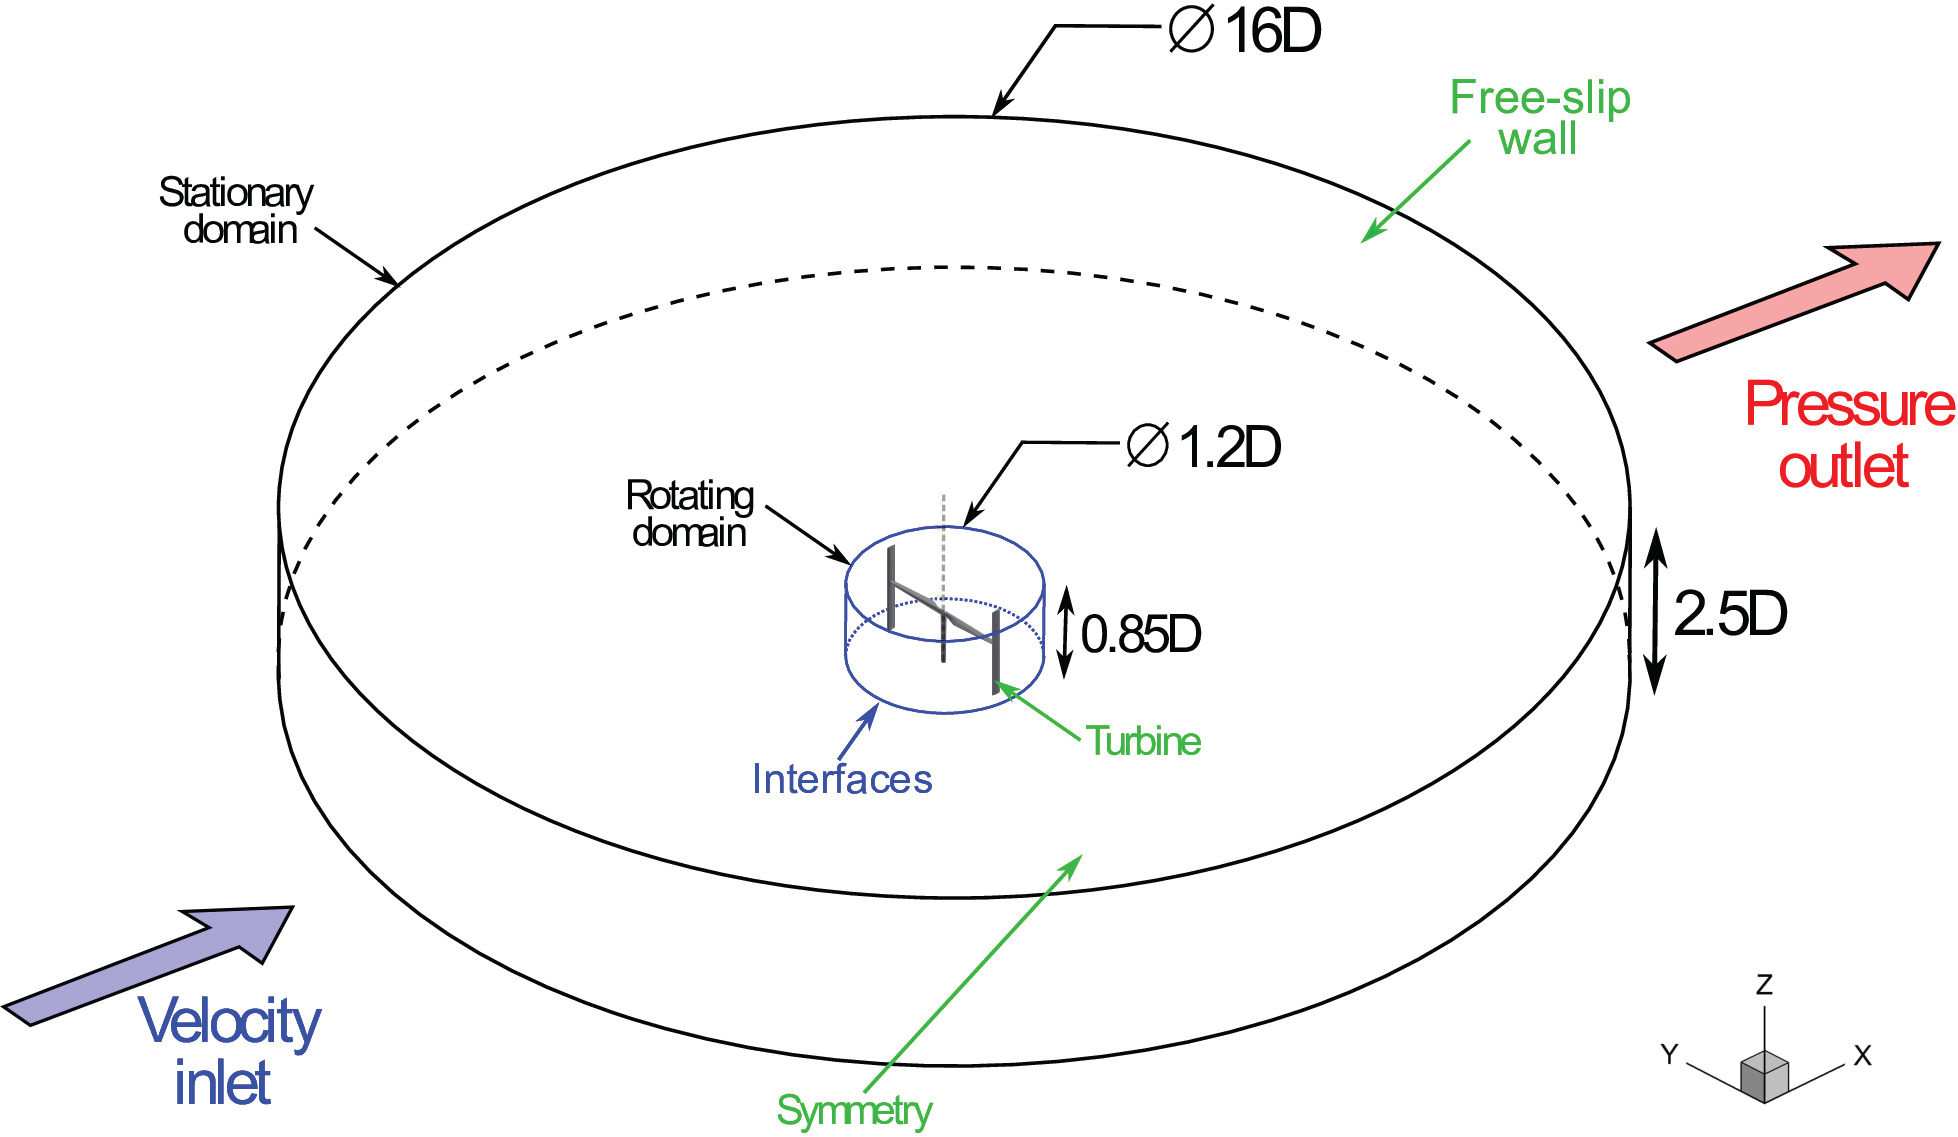
In order to simulate the rotation of the VAWT, a 3D computational domain is created. Figure 4 shows a schematic of the computational domain where the 5 MW VAWT is situated at the domain origin.
The computational domain is separated into two principal parts, namely a stationary sub-domain and a rotating sub-domain. The computational domain is a three-dimensional extension of the CFD domain specified in Ref. [33], with an outer dimension of 16D. The height of the computational domain is set to 2.5D which is sufficient to have a negligible effect on the turbine performance [35]. The turbine is encapsulated inside the rotating sub-domain and the contact surfaces between the two sub-domains are linked together by non-conformal sliding interfaces. A uniform air velocity inlet condition is imposed on the left-hand side of the domain. The inlet air turbulence intensity was defined as 10%, which was found to be the average turbulence intensity from offshore wind measurements [36]. A pressure outlet condition is implemented on the right- hand side of the domain as shown in Figure 4. The top of the domain is defined as a free-slip wall, where the wall shear stress is zero [12,35]. The bottom side of the domain is specified as a symmetry boundary condition which represents the mid-span plane of the turbine. Domain symmetry was employed to halve the computation resources required for the simulation. Previous numerical [12,15,35] and experimental [27] studies have demonstrated that the wake asymmetry about the turbine mid-span plane is very small.
Mesh dependency study
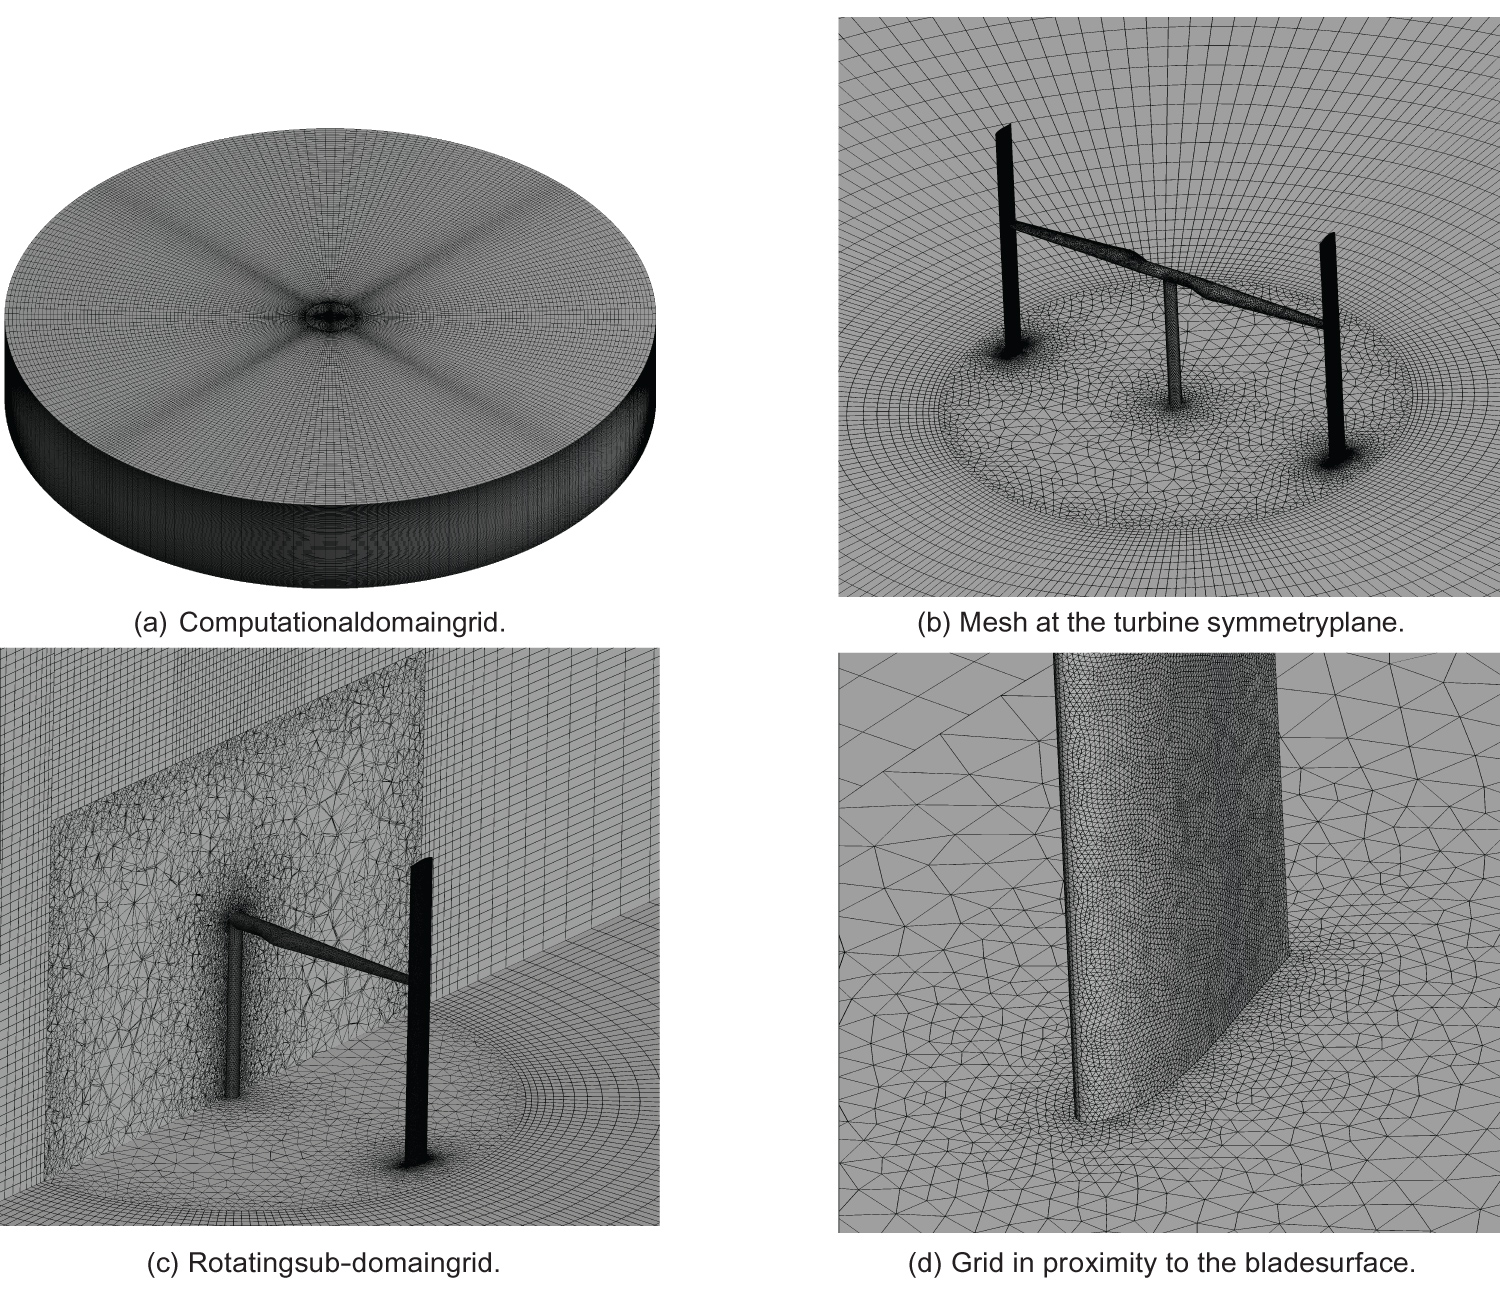
Figure 5 displays some details of the computational mesh utilized in this present investigation.
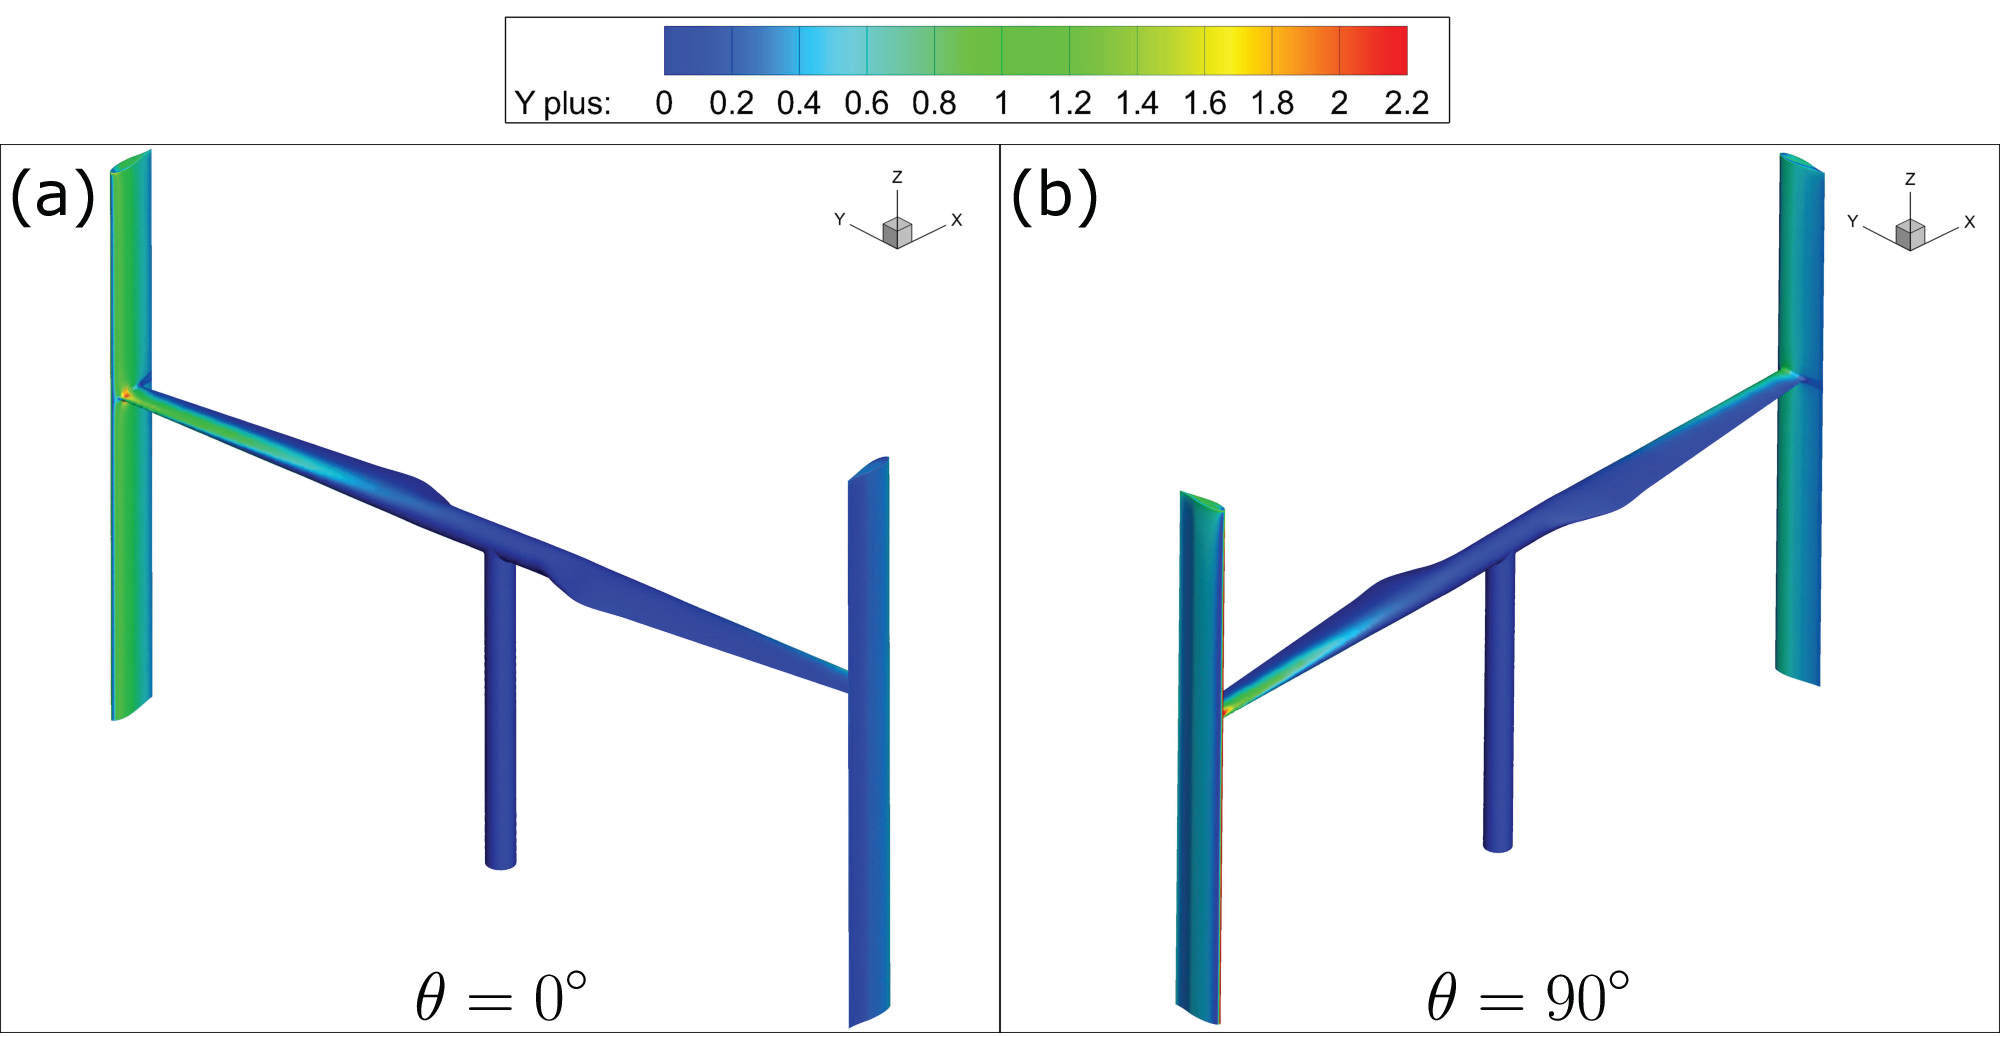
An O-grid type mesh topology is used for the stationary sub-domain which consists of structured hex- ahedral mesh volumes as shown in Figure 5a. The rotating sub-domain utilizes a hybrid mesh which is predominately composed of unstructured tetrahedral volumes to capture the intricate curvature of the turbine geometry as shown in Figure 5b and also in Figure 5c. A tetrahedral mesh has been implemented around the turbine geometry due to the complex nature of its design. The mesh topology in the vicinity of the blade is highly refined as is displayed in Figure 5d. On the surfaces of the turbine, inflated prismatic boundary layer control volumes are concentrated to resolve the viscous-affected sub layer region. Hence, the first layer control volume node height was defined to satisfy the requirement of y+ ≈ 1 [37]. A total of 45 prismatic layers are used to capture the boundary layer and the control volume layer growth rate in the normal direction from the turbine surface is limited to 1.15. After post-processing the flow field, a plot of the y+ value is shown in Figure 6.
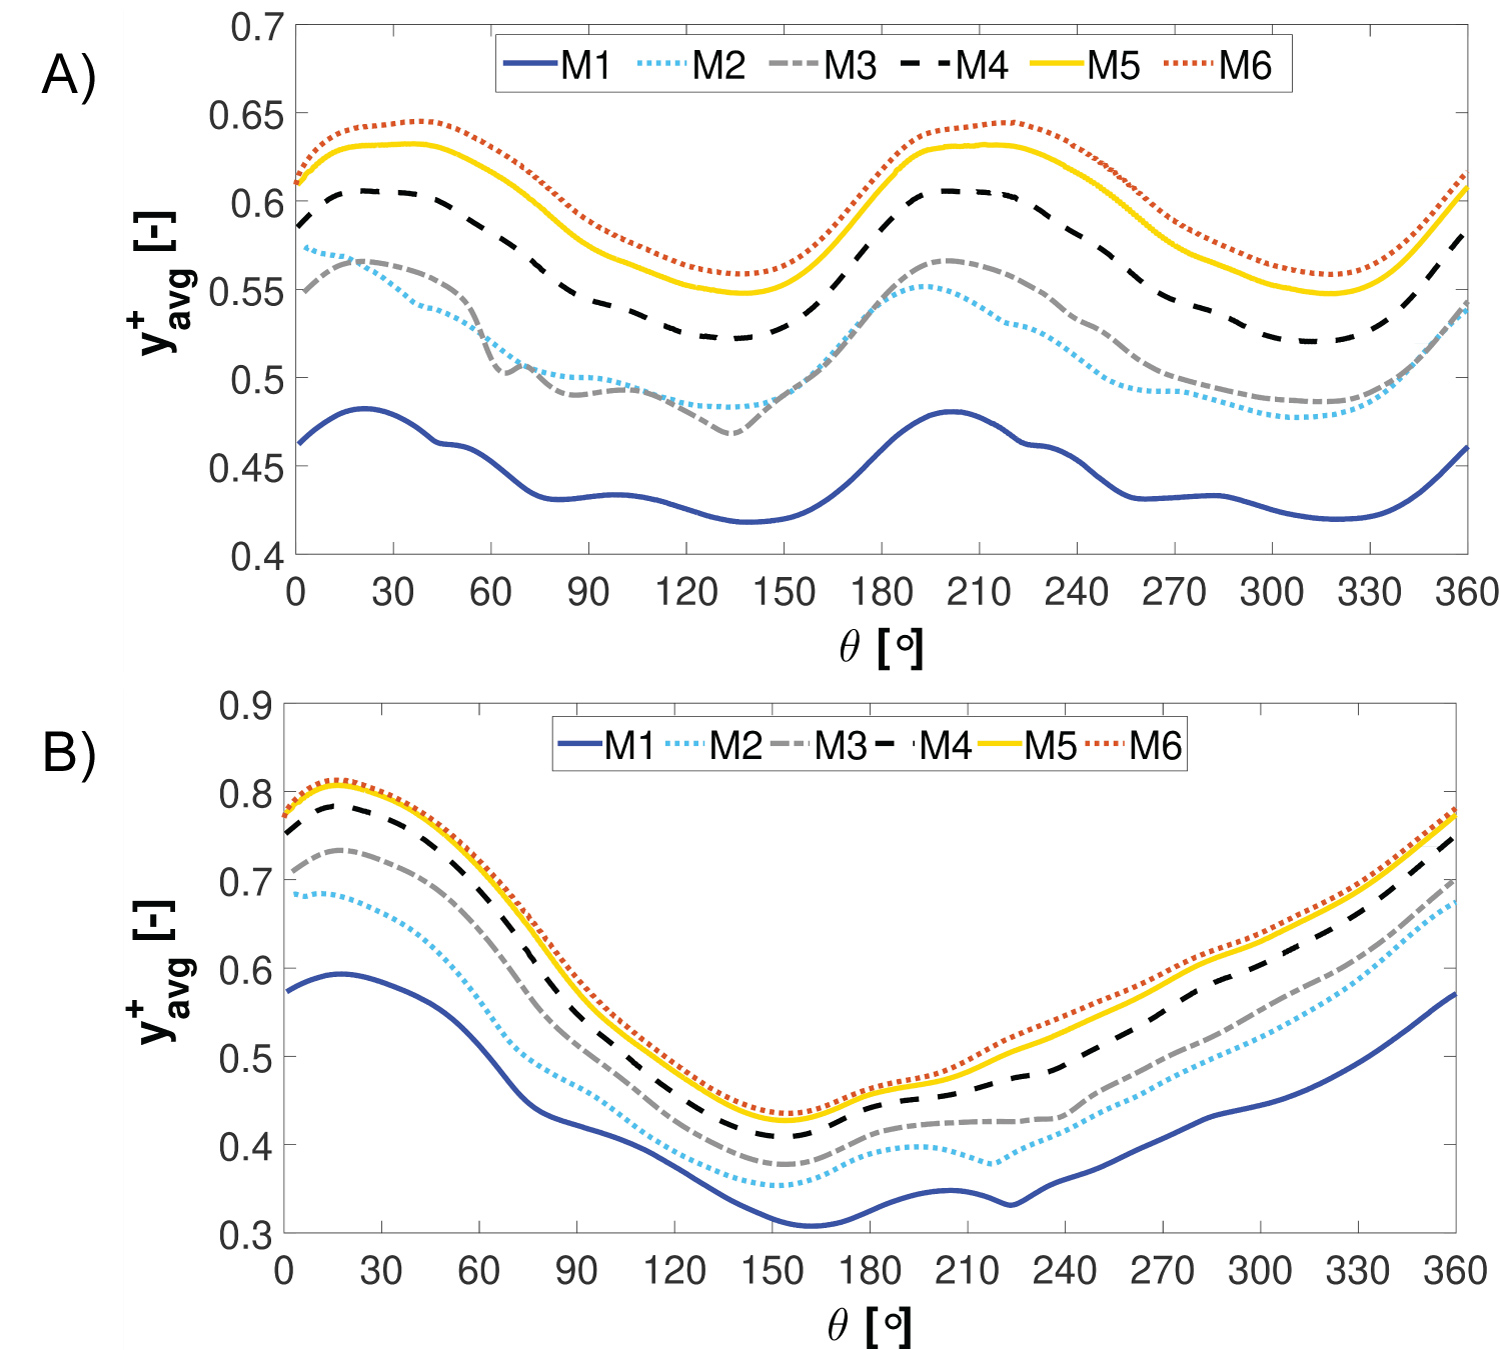
It can be observed the y+ values are approximately a value of 1 on the VAWT surfaces. Furthermore, Figure 7a and Figure 7b displays the average y+ values on the turbine and on a single blade during one revolution, respectively. A mesh sensitivity study is conducted to ensure the mesh is adequately refined to correctly resolve the flow field around the turbine. The domain mesh density was increased to evaluate its effect on the turbine performance. A total of six different levels of mesh refinement (M1-M6) were created, with the control volume and node number details stated in Table 4.
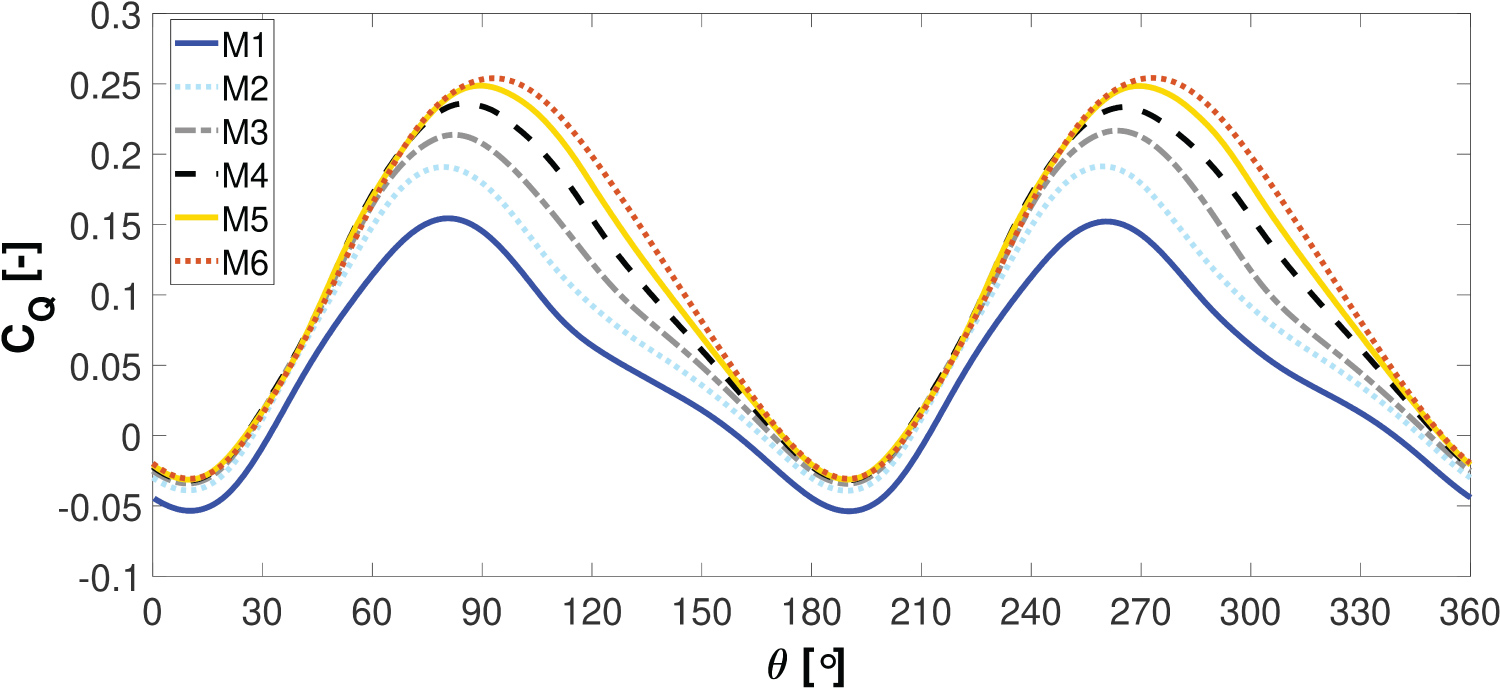
Furthermore, the employed number of processor cores, the wall-clock time needed per turbine revolution and the file storage size for each simulation are stated in Table 4. The file size refers to the combined size of the Fluent binary case and data file. The number of processor cores had to be increased as the mesh density was refined to allow sufficient RAM to conduct the simulations. Figure 8 shows the instantaneous torque coefficient and Table 5 states the power coefficient for each mesh created.
A percentage difference of 3.83% in the power coefficient was noted between the solution from M5 and M6, which is less than the allowable difference used by Marsh, et al. (i.e. ∆Cp < 5%) [35,38]. Simulation times increased greatly due to the large increase in the grid size. Therefore, considering the most suitable compromise between prediction accuracy and computational effort, the mesh density M5 was determined to be adequate and is used in this study. To illustrate this, if mesh M6 was employed it would have taken 1,107 hours (i.e. 46 days) on 48 cores to reach a periodic solution. Furthermore, Table 6 shows a review of 3D CFD studies available in the literature. It is important to highlight here that these studies used less mesh control volumes than in this current study.
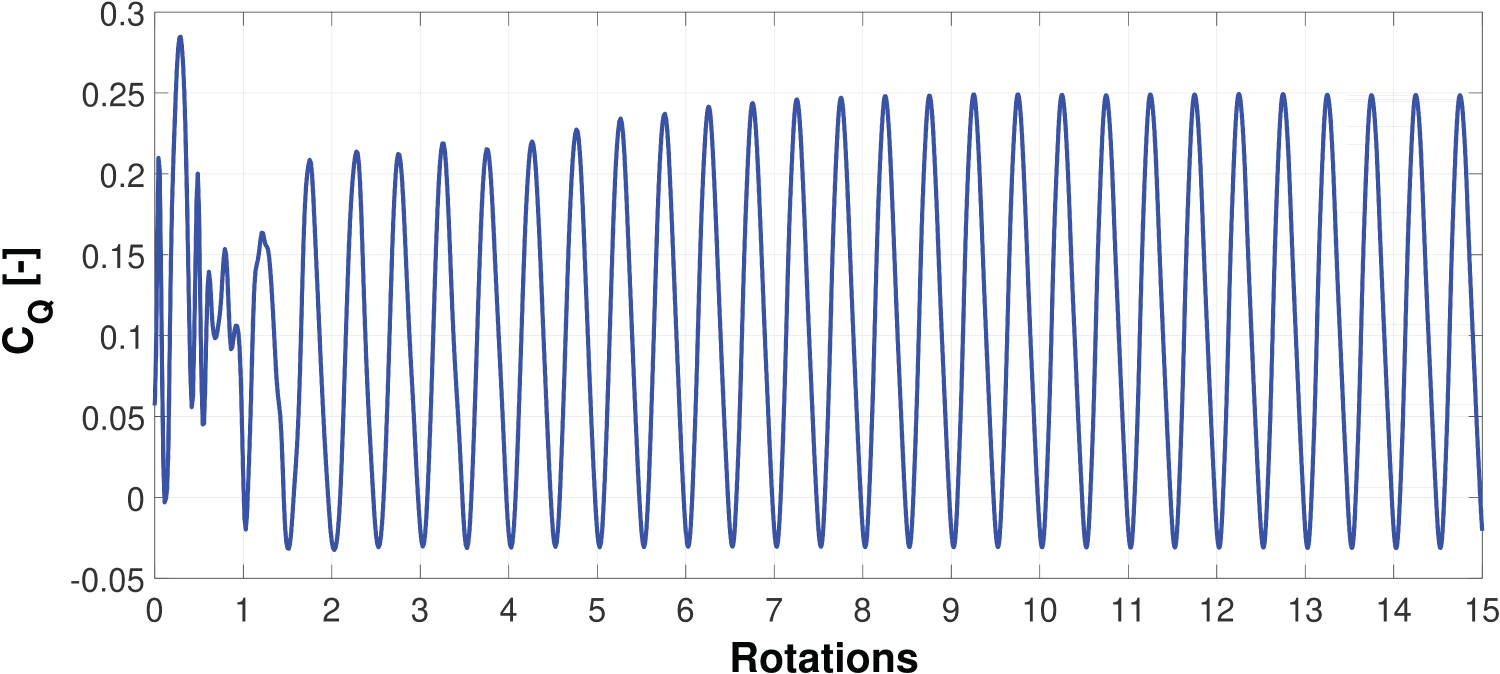
A time step size equal to an azimuthal increment of ∆θ = 0.5° for the turbine rotation was employed and was reported to be sufficient from the previous 3D CFD studies by Lam and Peng [12] and Balduzzi, et al. [15]. At each time step, the instantaneous turbine torque coefficient was computed as shown in Figure 9.
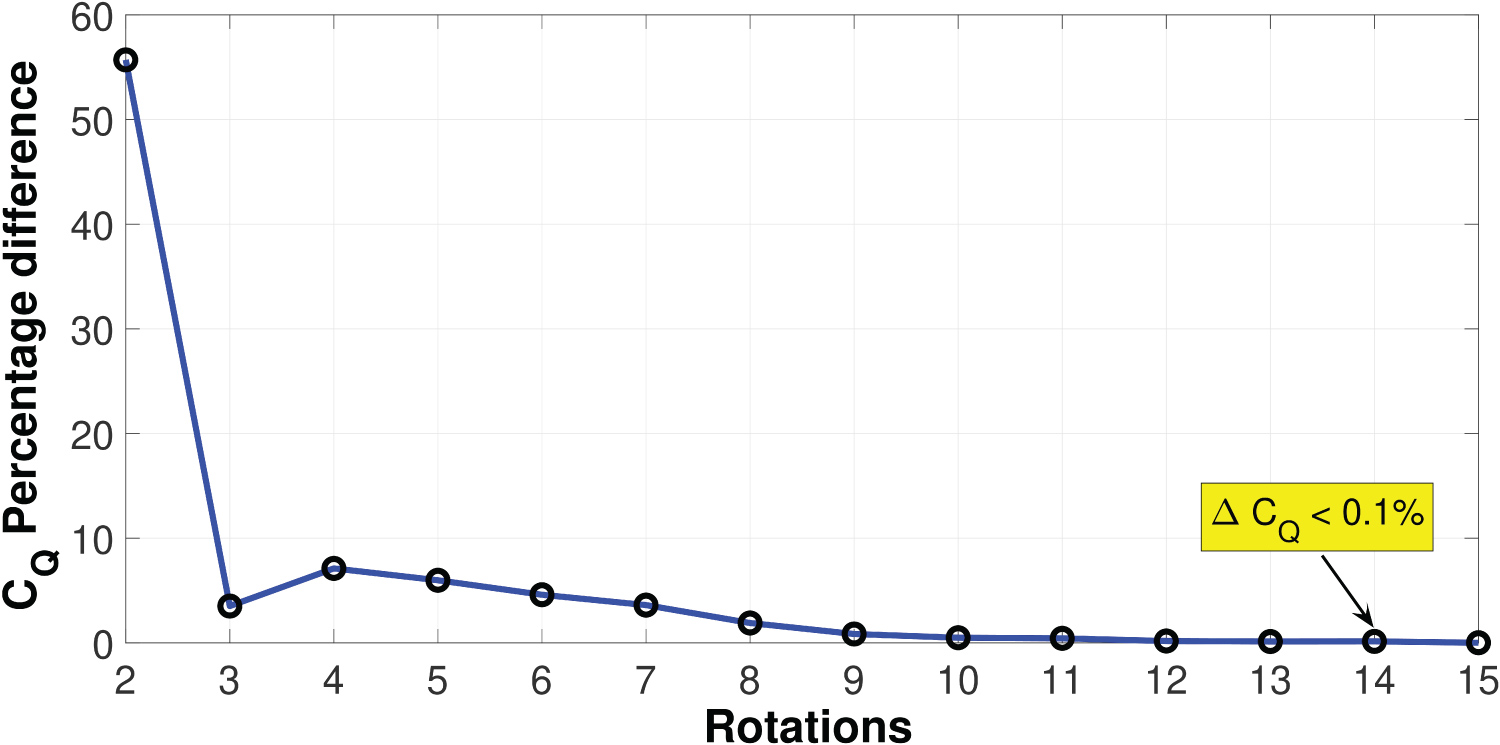
A fully periodic solution was attained when the difference in the mean torque coefficient between two consecutive turbine rotations became less than 0.1% [15] as exhibited in Figure 10. It can be observed from the results in Figure 10, that this requirement was satisfied after 14 turbine rotations, which is slightly more than the 12 rotations reported in the recent 3D CFD study by Balduzzi, et al. [15]. The total wall-clock time required for this single simulation (at λ = 3.14) was 517 hours (approximately 22 days) using a cluster of 48 processor cores. It is worth mentioning that this duration does not include the instances of starting, stopping, saving and queuing time required for the cluster Moab PBS job scheduler. Simulations were performed in parallel across 2 dual socket Intel Xeon E5-2695 v2 Ivy Bridge processors with 64 GB of RAM on a SGI ICE X system at the Irish Center for High End Computing (ICHEC).
Results and Discussion
VAWT aerodynamic efficiency
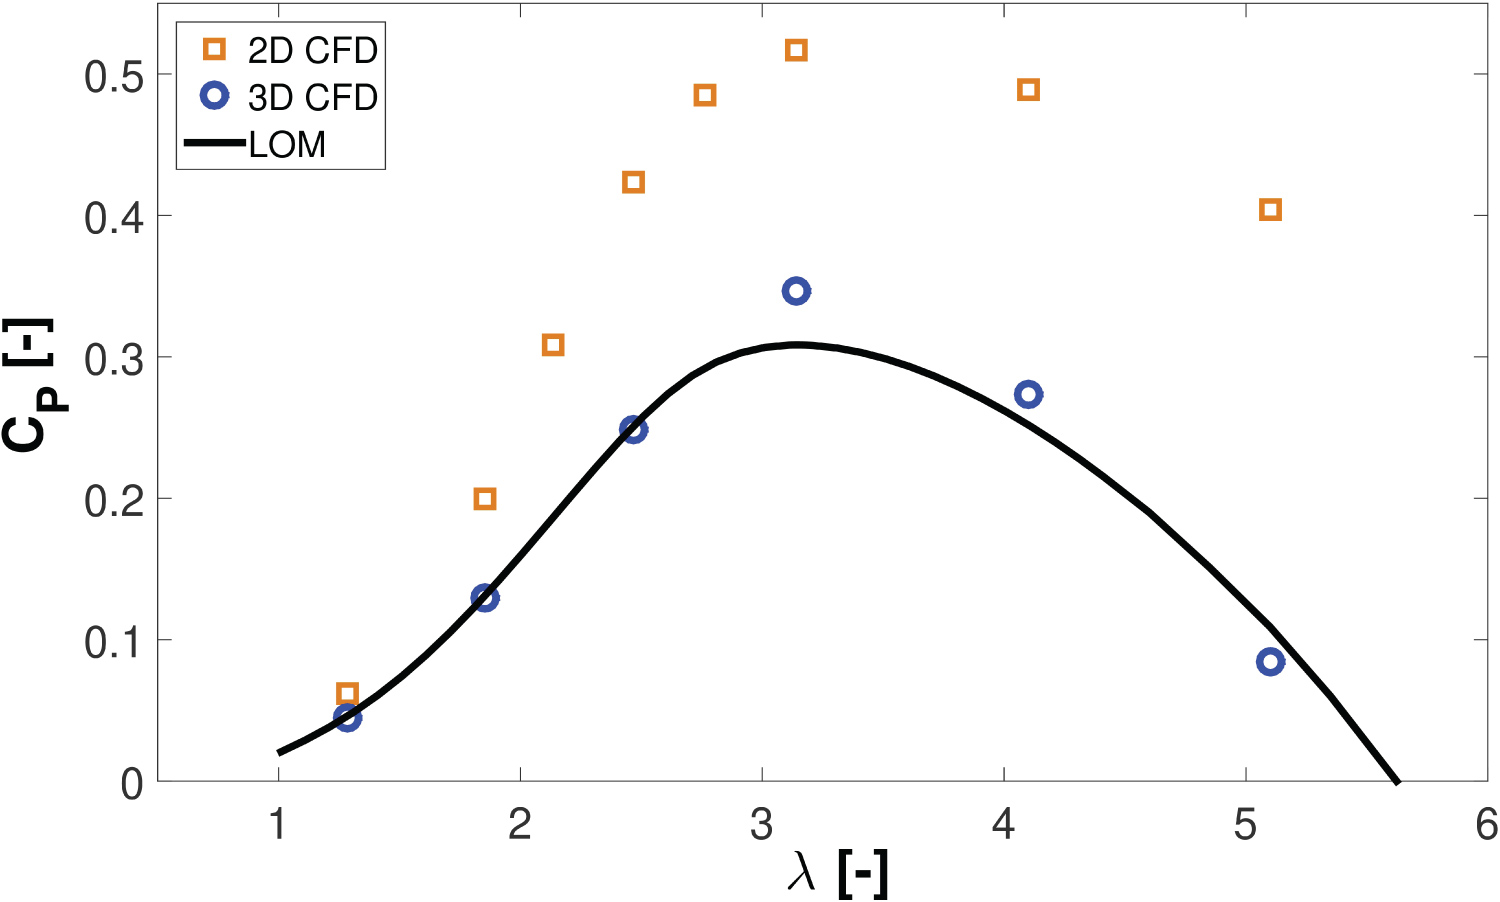
Figure 11 displays the 5 MW VAWT characteristic performance curve. It can be observed that the results computed by the 3D CFD model have a good correlation with the results predicted by the low-order model (LOM) outlined in Ref. [33]. The results of a 2D CFD model are also included in Figure 11. The 2D CFD model represents the aerodynamic performance at the mid-span plane of the VAWT shown in Figure 4. The grid requirements were defined based on the findings of a previous grid independence study reported in [7] and are detailed in Table 7.
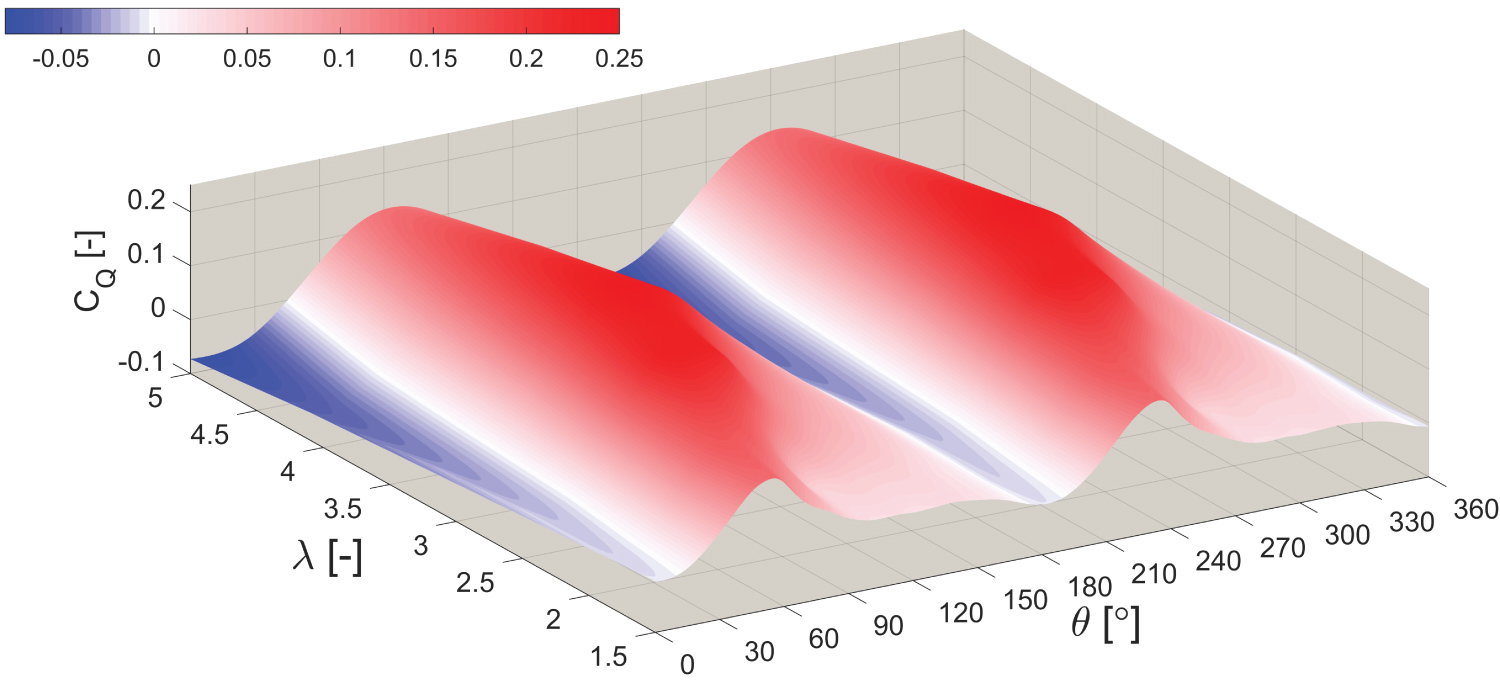
It is evident that the qualitative shape of the performance curve is predicted by the 2D CFD, but however it overestimates considerably the aerodynamic efficiency values at all the simulated TSRs, with respect to the 3D CFD model and the LOM. Figure 12 displays the variation in the instantaneous turbine torque coefficient with the TSR. It can be observed that as the TSR is increased the regions of the negative torque become more pronounced and the peak torque coefficient is reduced.
There are two important functioning TSR regimes which are of most particular interest in the operation of this turbine. These two TSRs are stated below:
1. The optimum TSR (λ = 3.140):
This TSR corresponds to where the VAWT achieves its maximum aerodynamic efficiency. The VAWT will operate most frequently at this stable TSR by exploiting tip-speed ratio control through the variable-speed generator. To simulate this TSR value, the freestream wind is set to 11 m/s and the VAWT rotational velocity is 6.810 RPM. The blade Reynolds number is in the range 1.024 × 10⁷ < Re < 1.982 × 10⁷.
2. The rated TSR (λ = 2.467):
This TSR corresponds to the point where the VAWT reaches its rated 5 MW power output. The freestream wind velocity is 14 m/s and the VAWT rotational velocity is maintained constant at 6.810 RPM. This TSR is located in the unstable part of the characteristic performance curve and will be influenced by the effects of blade dynamic stall. The blade Reynolds number is in the range 8.939 × 10⁶ < Re < 2.113 × 10⁷.
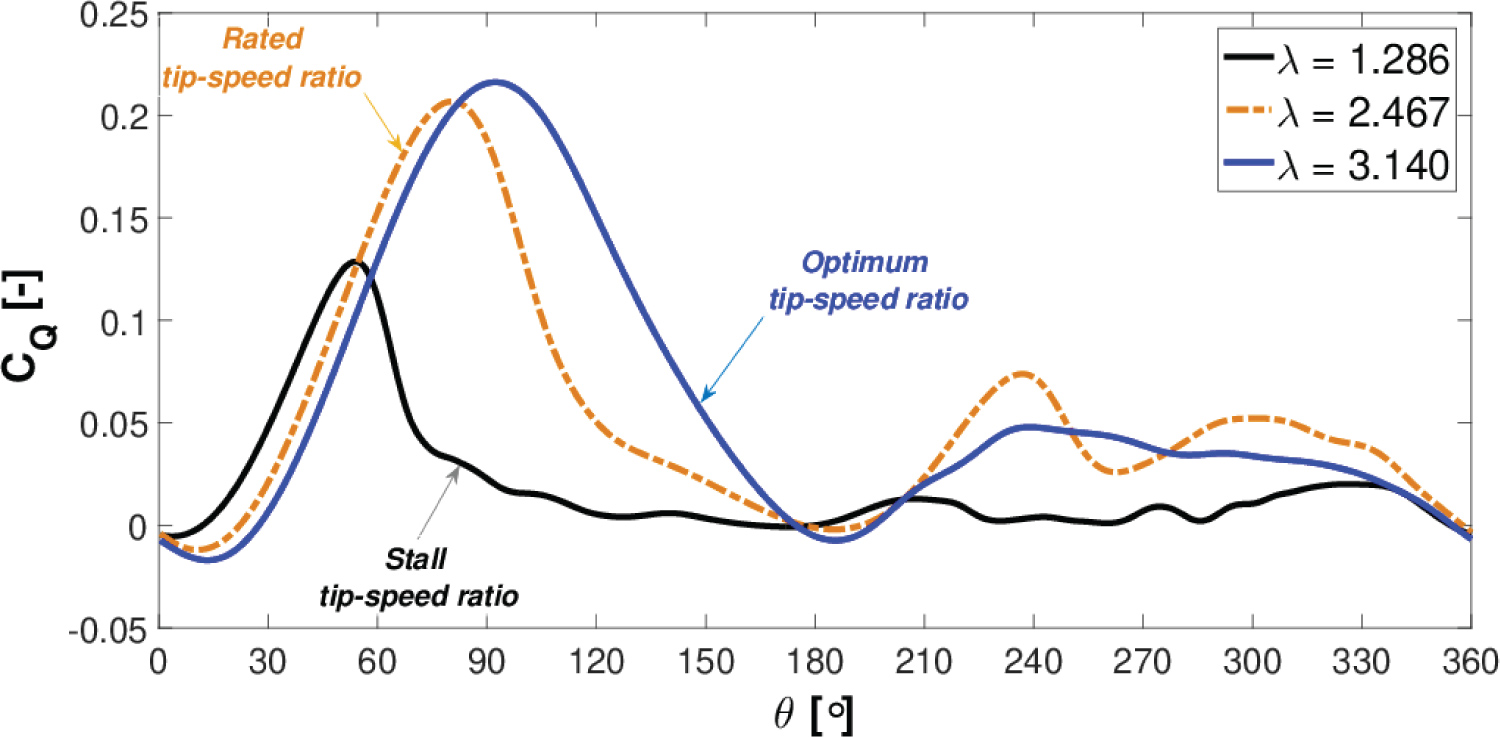
Figure 13 shows the instantaneous blade torque coefficient for the two aforementioned TSRs.
In addition, the blade torque coefficient for the stalled TSR at λ = 1.286 is included, where the VAWT reaches the cut out wind velocity and ceases power generation. The maximum instantaneous torque coefficient is achieved at θ = 92.5° and θ = 80.5° for λ = 3.140 and λ = 2.467, respectively. The instantaneous torque coefficient is more unsteady as the TSR is reduced. In particular, after the peak torque coefficient is reached for λ = 2.467, the decrease in the torque coefficient is quite sharp due to the pronounced effects of blade dynamic stall. A similar reduction in the blade torque coefficient is encountered at the stall TSR (λ = 1.286) with the maximum torque coefficient reached much earlier at θ = 54°. It is also worth noting that the blade torque coefficient remains close to zero for the most of the blade orbit at this TSR, which exhibits the desired passive stall regulation of the VAWT.
Instantaneous turbine torque components
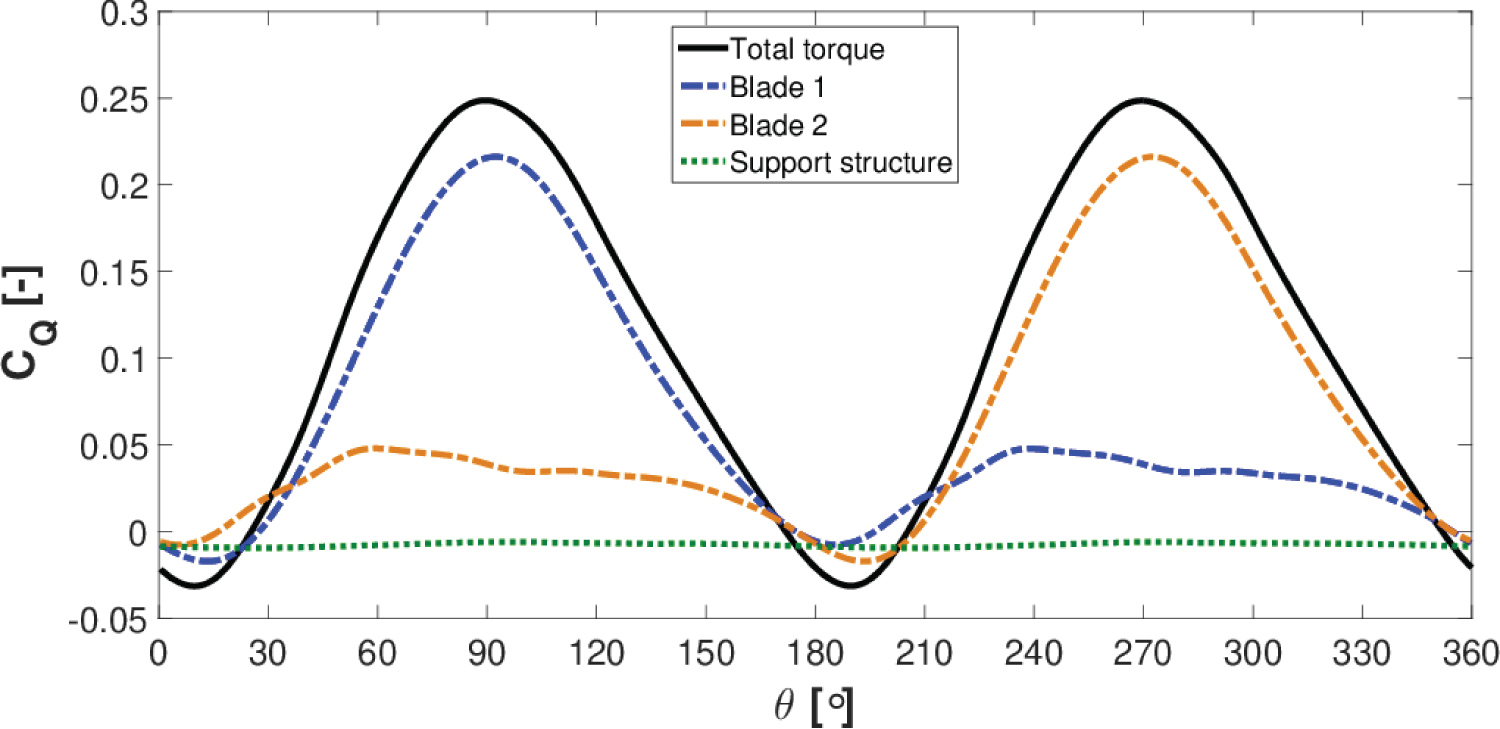
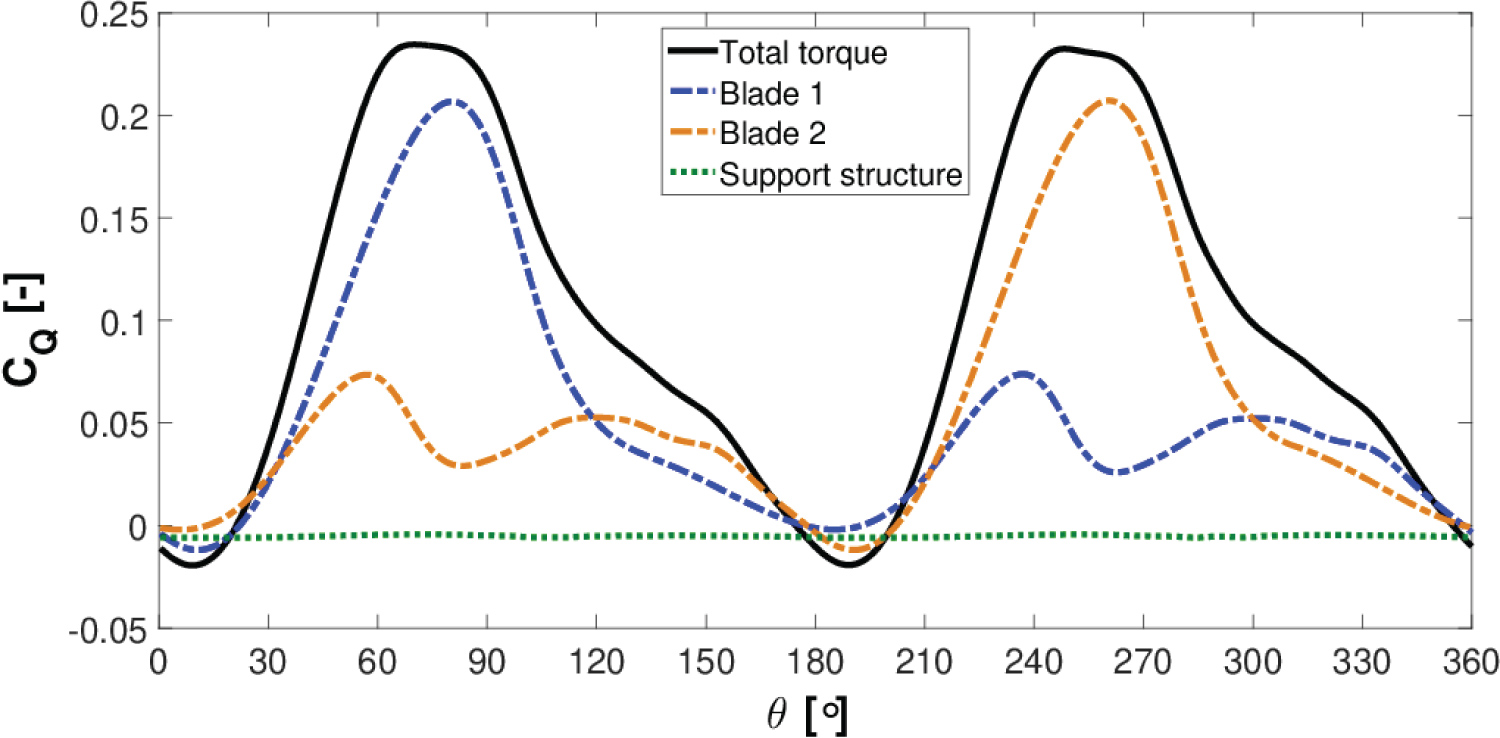
The turbine instantaneous torque coefficient for the functioning regime λ = 3.140 is displayed in Figure 14.
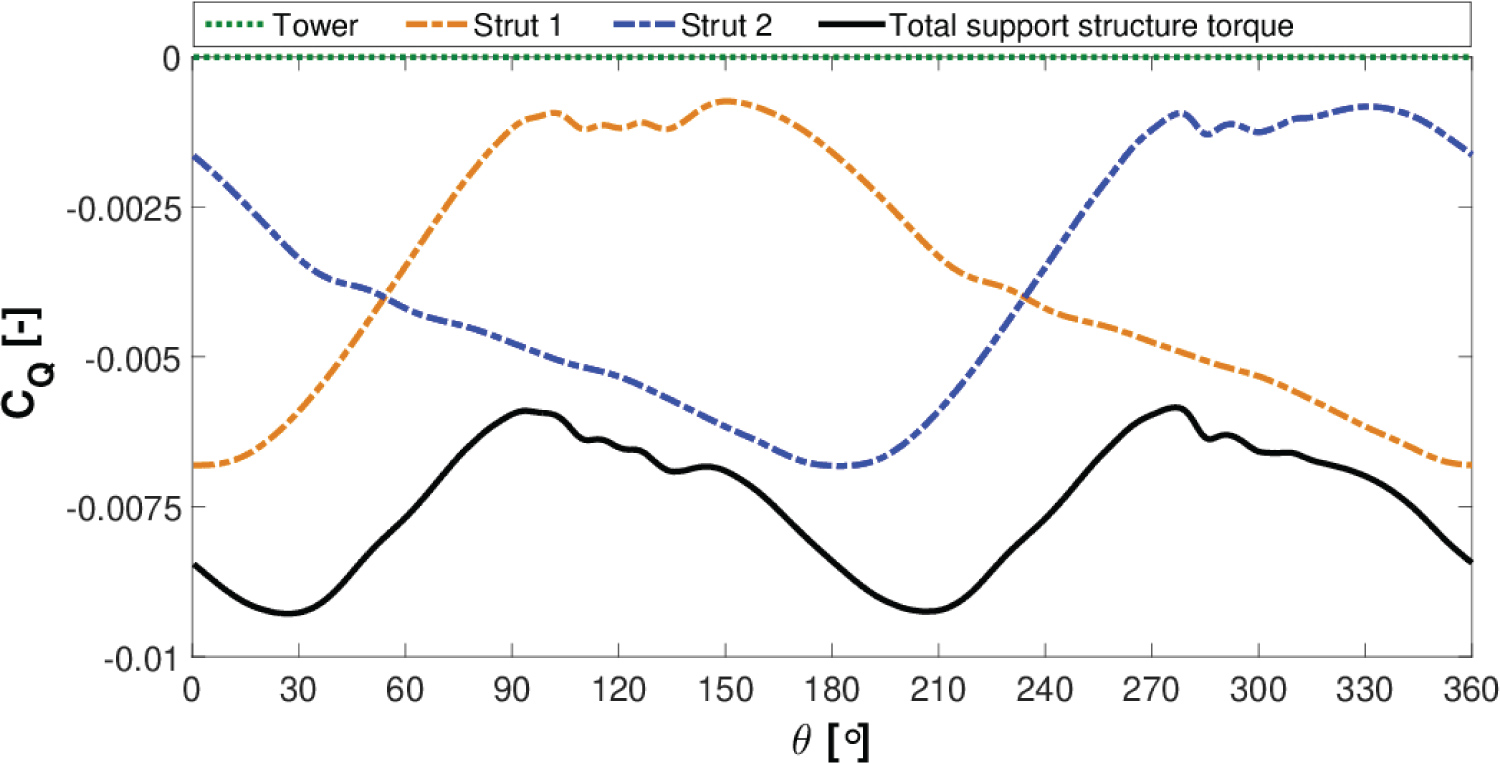
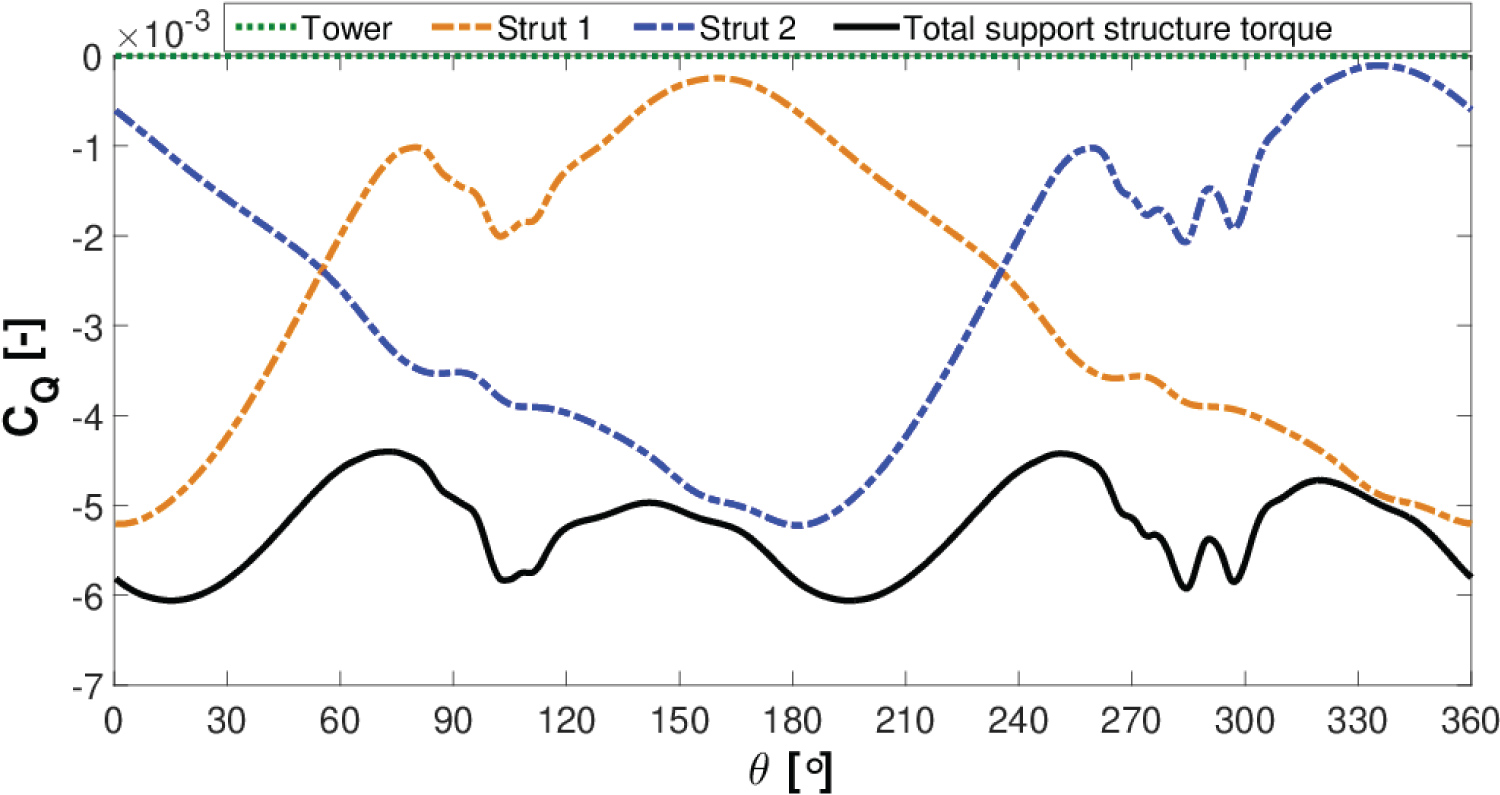
The total instantaneous torque coefficient is the sum of the torque contributed by its blades and also its support structure. The support structure creates a resistant or a negative torque, while its blades primarily produce a positive torque as can be observed in Figure 14. The resistant torque generated by the support structure reduces the turbine power coefficient by 6.54% at this TSR when compared to the power coefficient obtained from the blades only. Figure 15 shows the components which contribute to the support structure parasitic torque.
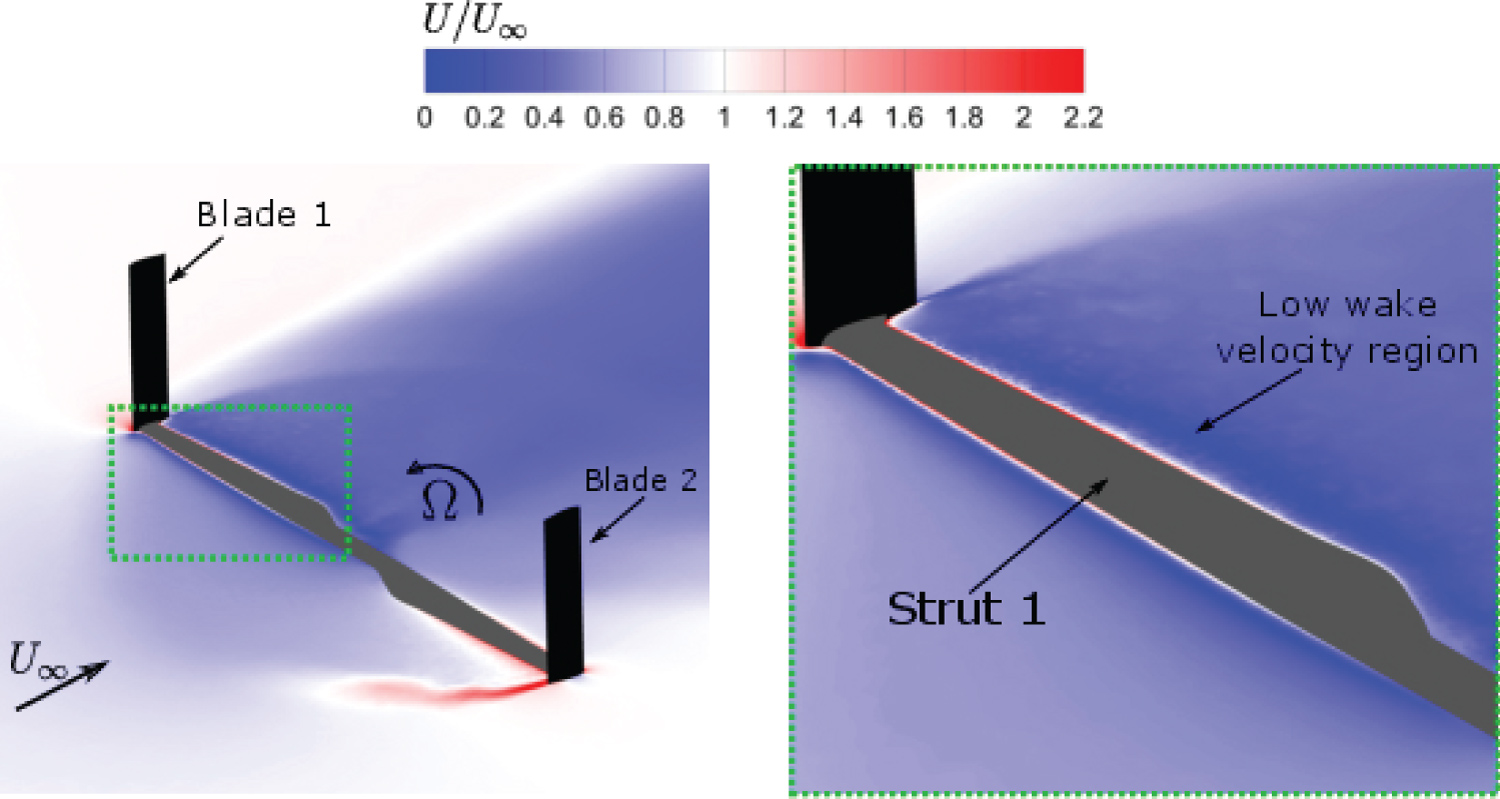
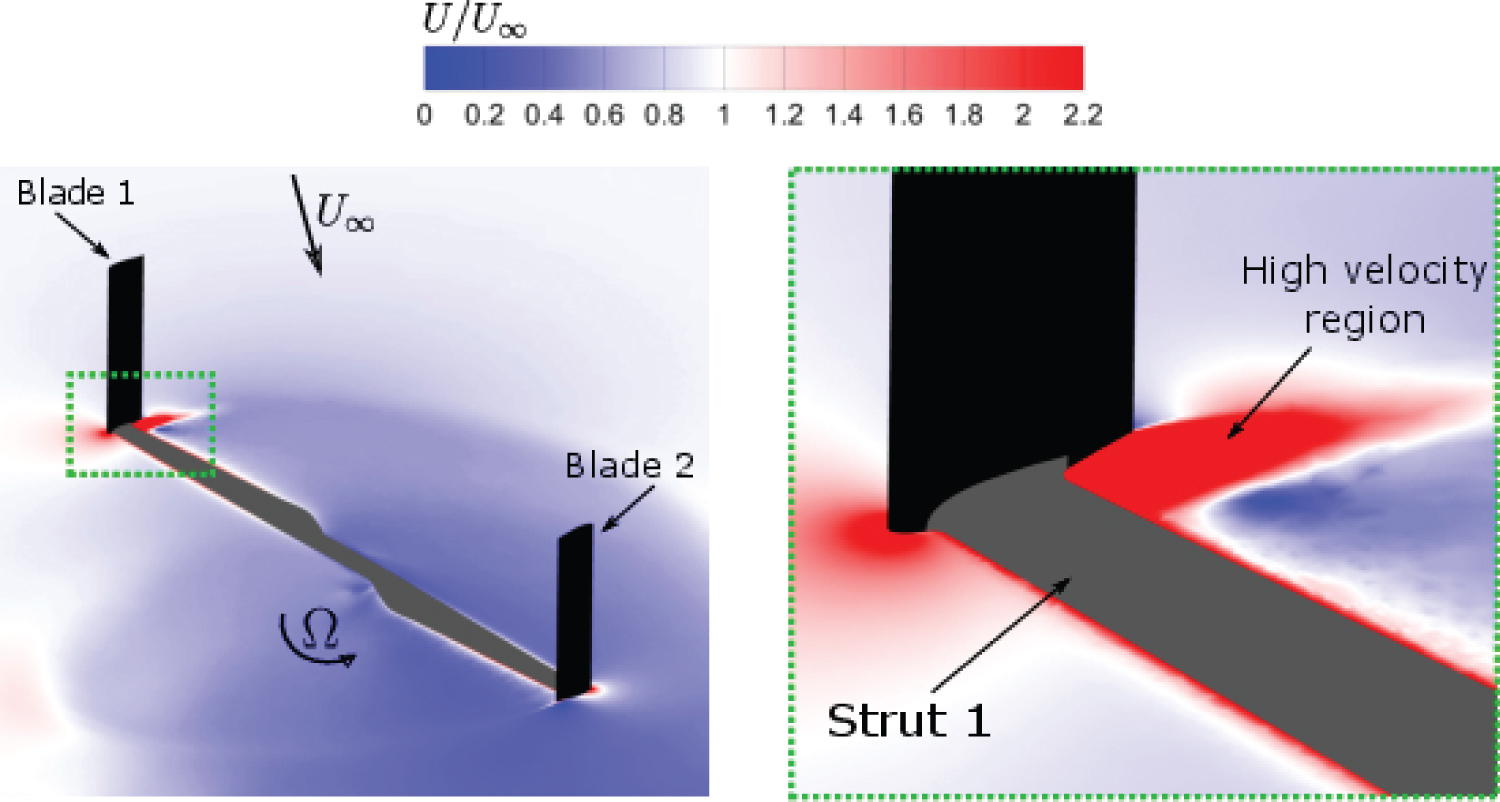
The resistant torque created by the rotating tower is very small and appears to be negligible. Each of the turbine's struts generates a fluctuating resistant torque which can be seen in Figure 15. The individual strut resistant torque is maximum when advancing directly into the oncoming flow at θ = 0° for the first strut and similarly for the second strut at θ = 180° turbine revolution. To investigate this occurrence in greater detail, Figure 16 shows the instantaneous velocity at the strut horizontal plane (z/H = 0.293) for θ = 0°.
The VAWT blades are shown in black, while the struts are highlighted in grey colour. It can be observed in Figure 16 that the wake velocities behind the strut are much lower when compared with the rest of the turbine near wake flow field and indicates the generation of the high parasitic strut torque at this instant of the cycle. It is noted there is a series of ripples in the strut torque profiles between 100° < θ < 140° for strut 1 and similarly between 275° < θ < 315° for strut 2 in Figure 15. Examining the instantaneous velocity contours at θ = 120° in Figure 17, it can be observed that a high velocity region is formed at the blade-strut connection.
It is expected these ripples are caused by vortices being created and shed at the blade-strut connection junction. The total support structure resistant torque has an oscillating nature during the turbine rotation and becomes maximum at approximately θ = 30° and θ = 210° in Figure 15 for λ = 3.140.
Figure 18 shows the turbine instantaneous torque coefficient for λ = 2.467 and Figure 19 shows the torque components for the support structure.
In comparison to λ = 3.140, the support structure resistant torque causes a 5.08% decrease in the turbine power coefficient at λ = 2.467. While the strut parasitic torque losses are less at this TSR, it is observed in Figure 19 that the ripples in the strut torque coefficient are more pronounced. Furthermore, at this operating regime the support structure resistant torque becomes maximum at approximately θ = 15° and θ = 195° in Figure 15, which is a shift of approximately 15° earlier compared to the λ = 3.140 case.
Simulation of the VAWT forces
The VAWT forces in the inline and lateral directions were simulated. The turbine vertical force was not simulated due to the symmetry boundary condition specified at the turbine midspan. The inline force FI corresponds to the turbine force in the x-direction according to the Cartesian coordinate system shown in Figure 4. While, the lateral force FL corresponds to the turbine force in the y-direction. The inline force coefficient and the lateral force coefficient are defined respectively as:
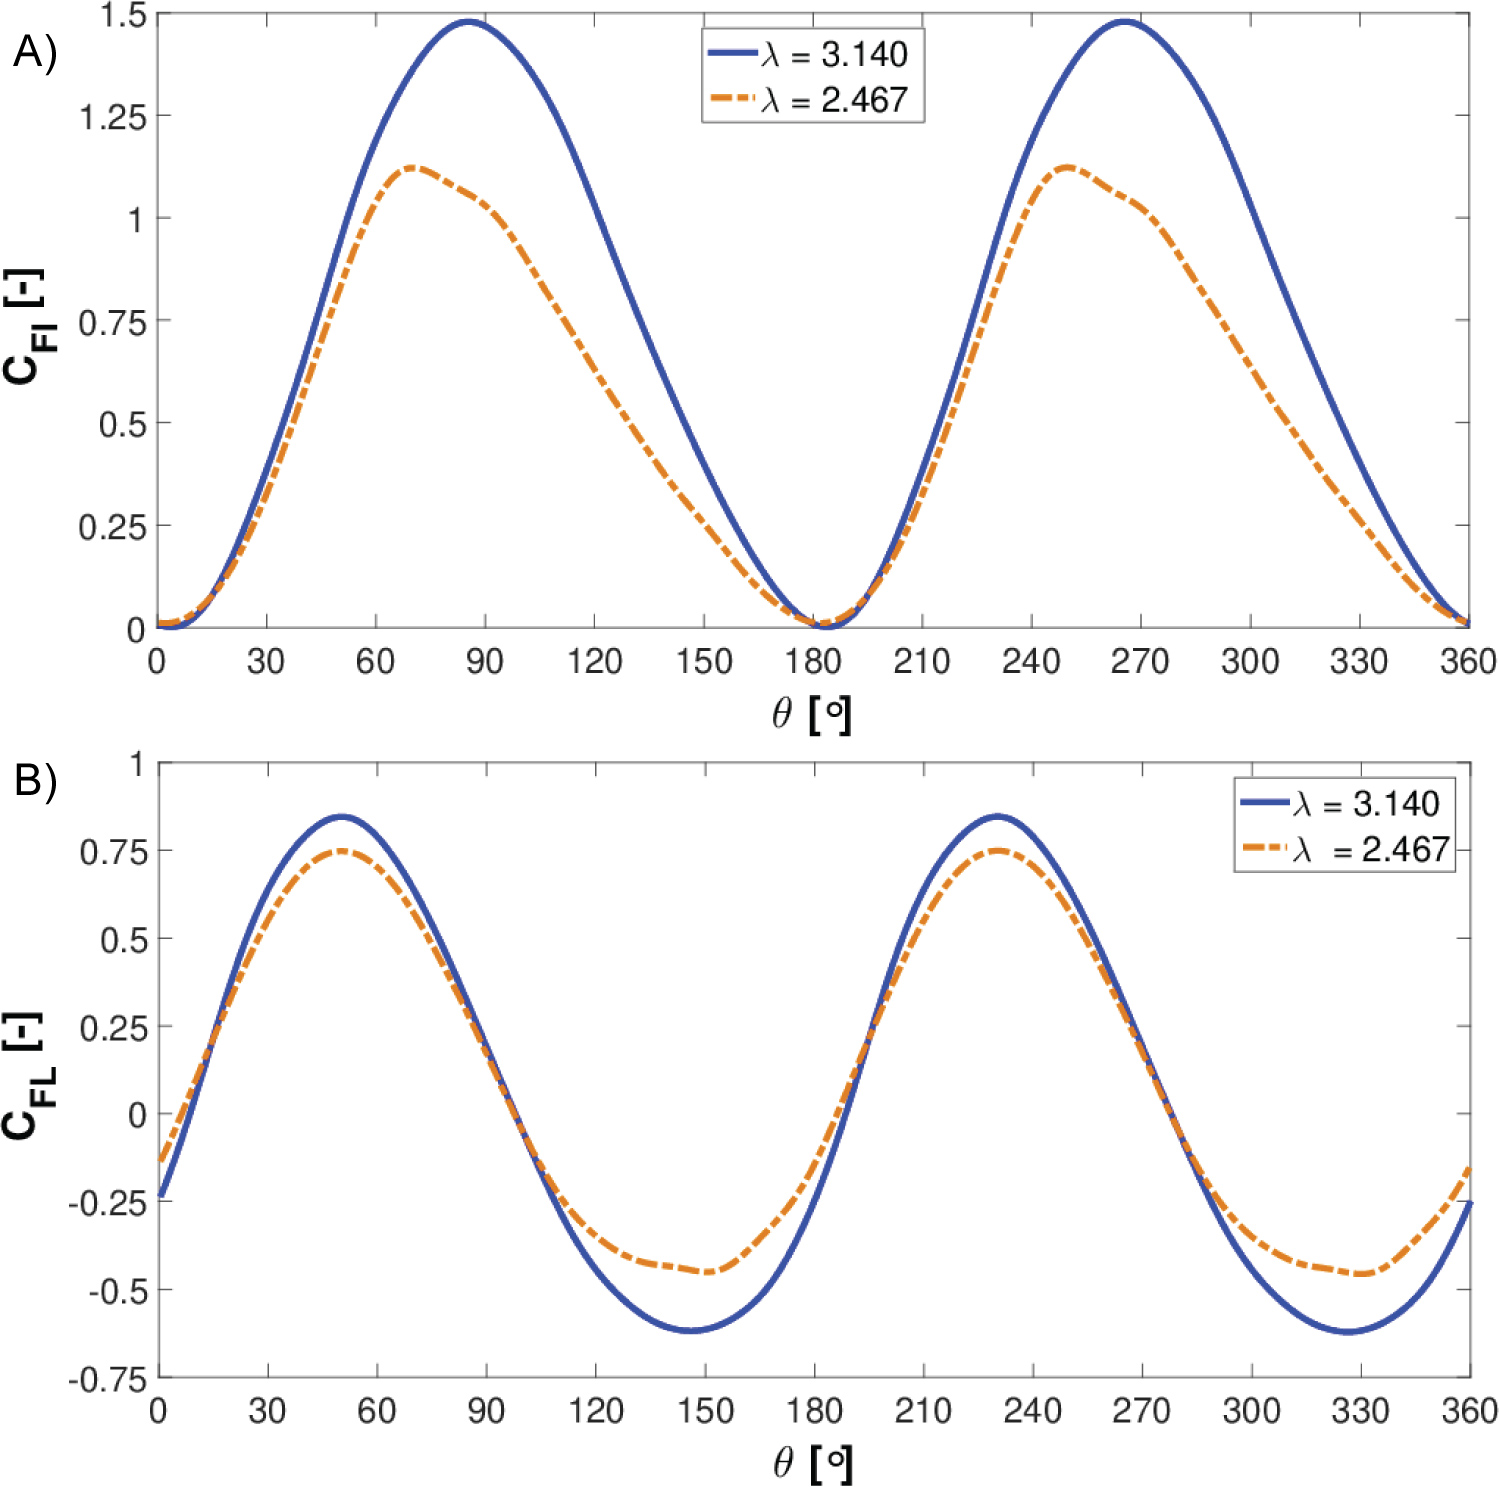
Figure 20a displays the turbine inline force coefficient for λ = 3.140 and λ = 2.467.
It is observed for the lower TSR, the inline force profile is skewed compared to the force coefficient at the higher TSR. It is apparent that the effects of dynamic stall cause this skewness at λ = 2.467. For λ = 3.140, the turbine inline force becomes maximum and at θ = 86° and θ = 266°. While, for λ = 2.467, the inline force has maxima at θ = 70° and θ = 250°. In comparison to the inline force coefficients, the turbine lateral force coefficients shown in Figure 20b show maxima and minima values at the same azimuthal angles for the two studied TSRs. Table 8 outlines the maximum inline and lateral force coefficients for each TSR.
At λ = 3.140, the maximum inline force coefficient is 74.8% higher than the maximum lateral force coefficient . While at λ = 2.467, the inline force coefficient was 50% higher than the lateral force coefficient.
VAWT wake velocity field
The VAWT wake velocities at six downstream distances (1D-6D) were obtained from the computed flow field. The numerical results were extracted using virtual rakes at the defined locations in the computational domain and the wake velocity results were time-averaged within the CFD solver for the last turbine revolution. Horizontal virtual rakes were positioned at the VAWT mid-span plane (z = 0) and vertical virtual rakes were situated at the tower centerline (y = 0).
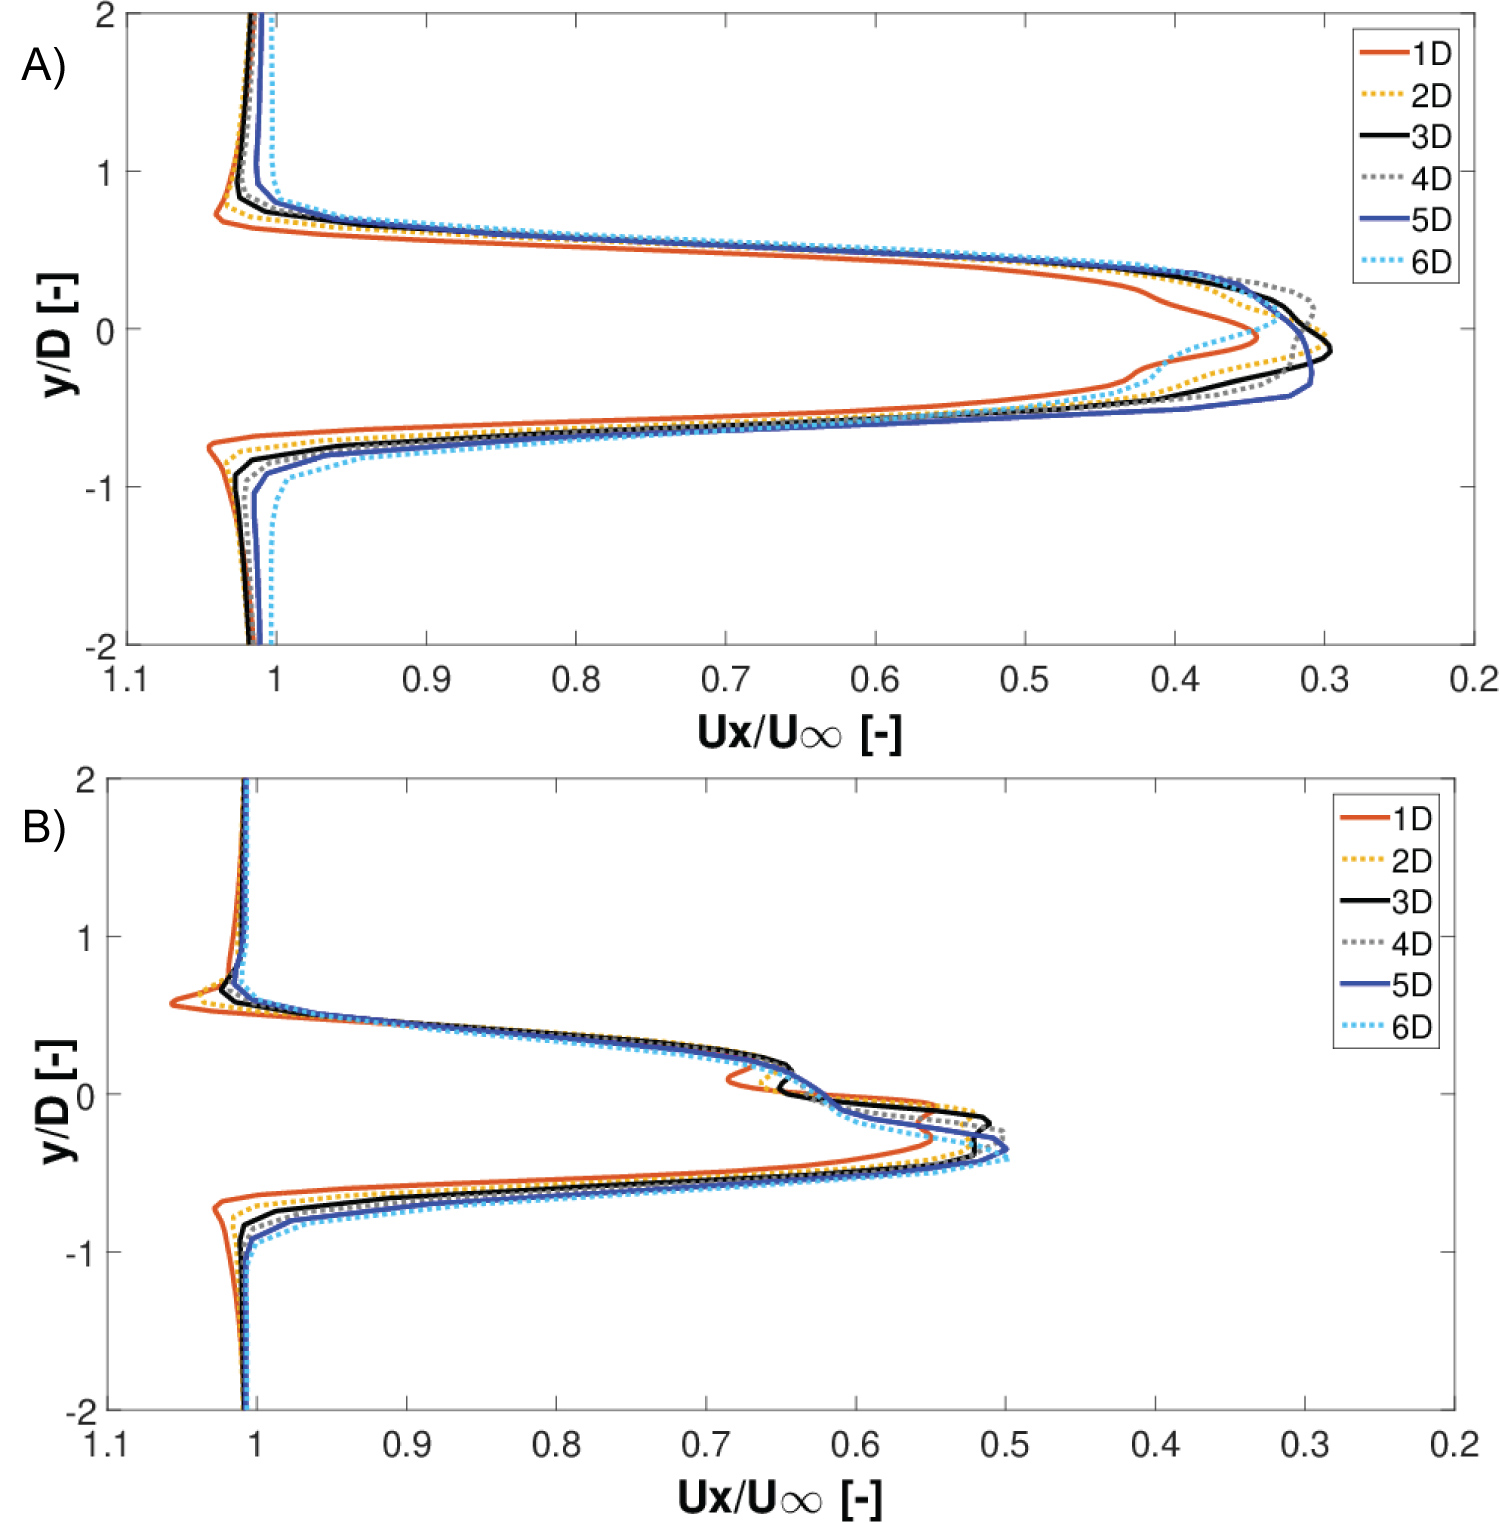
Wake velocities at the VAWT mid-span: Figure 21a and Figure 21b show the wake streamwise velocity at the symmetry plane (z = 0) for λ = 3.140 and λ = 2.467, respectively.
The wake streamwise velocity is normalized with respect to the freestream velocity (Ux/U∞) and the y-axis is normalized with respect to the turbine diameter (y/D). At λ = 3.140, the wake velocity profiles appear almost symmetrical about the tower centerline or the x-z plane as shown in Figure 21a. Although, there is a distinct asymmetry region observed in the velocity profiles at Ux/U∞ < 0.435. It is expected the rotating tower wake causes this asymmetry region due to the Magnus effect. The wake velocity deficit increases from 1D to 3D where it reaches a maximum of 70.3% at a downstream distance of 3D. From 4D to 6D the velocity deficit steadily decreases to a maximum of 67% at 6D. This high wake velocity deficit encountered is due to the high energy extraction by the VAWT at this TSR. It is also worth highlighting, there is a blockage effect observed at Ux/U∞ > 1 and this effect decreases as the streamwise distance from the turbine is increased.
In comparison to the results shown in Figure 21a, the streamwise wake velocity is more asymmetrical about the x-z plane at λ = 2.467 in Figure 21b. As the turbine is operating at a lower TSR, this wake asymmetry is the result of the non-linear dynamic stall effects experienced by the turbine blades and this subsequently affects the wake velocities produced downstream. This development was not observed in the simulations by Lam and Peng [12] and also in the experiments by Tescione et al. [27] as their studies were concentrated on a high operational TSR of λ = 4.5, where dynamic stall effects were not encountered. The streamwise wake velocity deficit increases from 1D to 6D to a maximum of 50.3% as shown in Figure 21b. The maximum velocity deficit is not as high as λ = 3.140, due to lower energy extraction by the VAWT at this TSR. In addition, the aforementioned blockage effect at this TSR is reduced substantially compared to λ = 3.140 in Figure 21a.
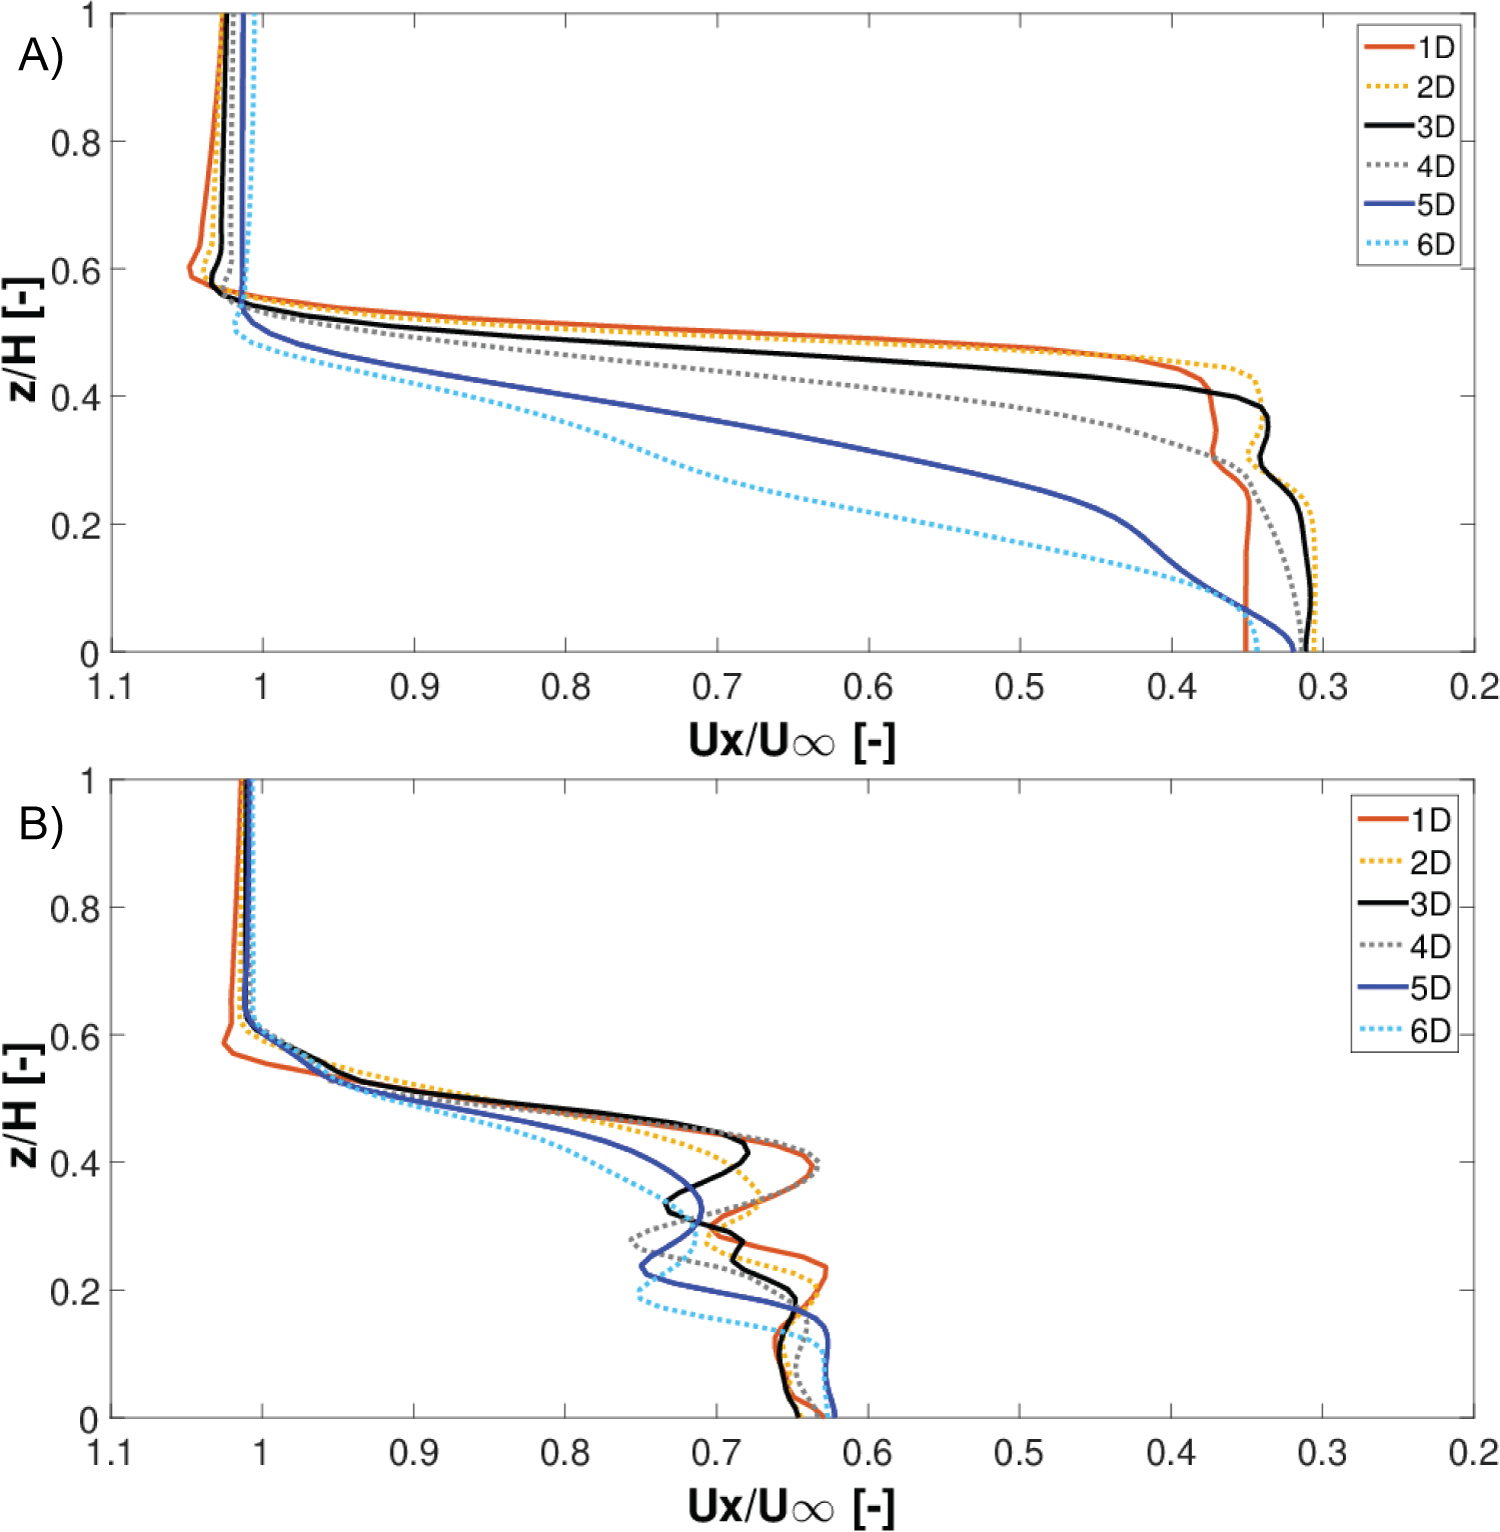
Wake velocities at the tower centerline: Figure 22a and Figure 22b show the wake streamwise velocity at the tower centerline (y = 0) for λ = 3.140 and λ = 2.467, respectively.
The wake streamwise velocity is normalised with respect to the freestream velocity (Ux/U∞) and the z-axis is normalised with respect to the turbine height (z/H). At λ = 3.140 in Figure 22a, it can be observed that the streamwise wake velocity decreases in height as the downstream distance is increased. For example, the wake velocity profile at 1D decreases from z/H = 0.59 at Ux/U∞ = 1.05 to z/H = 0.42 at Ux/U∞ = 0.38. This height reduction is more pronounced between 4D-6D compared to 1D-3D. It is observed the struts cause a noticeable ripple in the wake profiles between 0.23 < z/H < 0.40 for 1D-3D as shown in Figure 22a. It is noted this strut wake effect does not transpire for the velocity profiles between 4D-6D. It is worth mentioning in the 3D CFD simulations by Lam and Peng [12], the turbine struts were not modelled and this strut wake effect was not observed. At λ = 2.467 in Figure 22b, the height reduction in the turbine wake at the tower centerline is not as large as λ = 3.140 due to the lower wake velocity deficit experienced at this operating regime. The most discernible difference noted at the lower TSR, is the ripple in the wake profiles is more pronounced compared to λ = 3.140.
Flow field visualisation
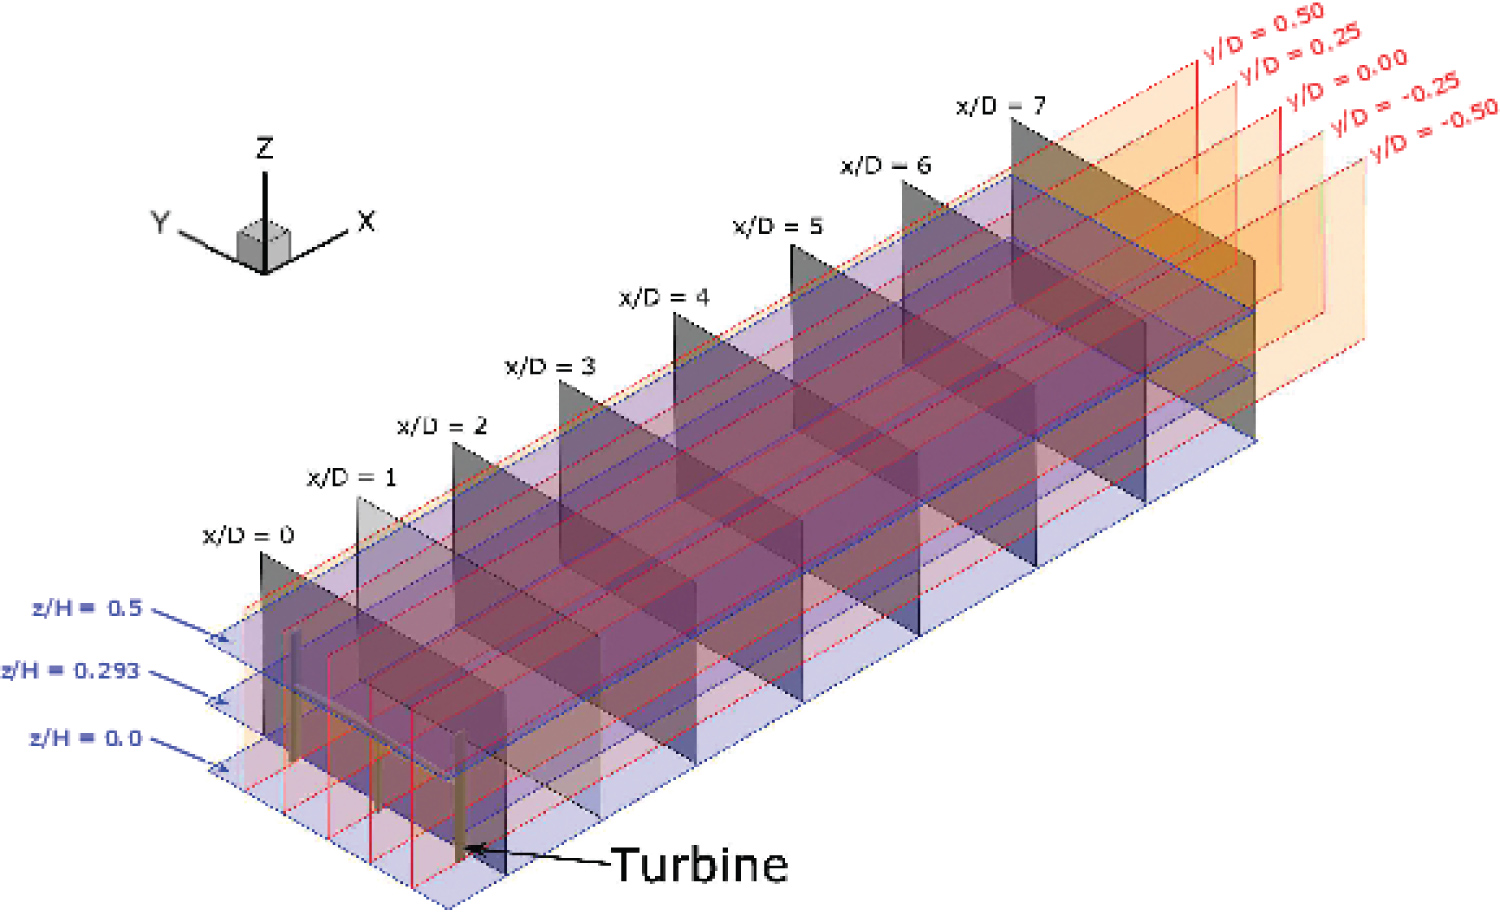
To gain an in-depth insight into the VAWT flow field wake, slice planes are employed to visualise the turbine wake at λ = 3.140 as depicted in Figure 23.
Slice planes are used in the following positions:
• Horizontal x-y planes: positioned at the turbine mid-span plane (z/H = 0), the strut plane (z/H = 0.293) and the blade tip plane (z/H = 0.5). Shown in blue colour in Figure 23.
• Vertical x-z planes: positioned at traverse distances between y/D = -0.5 and y/D = 0.5 with an increment of y/D = 0.25. Shown in red colour in Figure 23.
• Vertical y-z planes: positioned at downstream distances between x/D = 0 and x/D = 7 with an increment of x/D = 1. Shown in black in Figure 23.
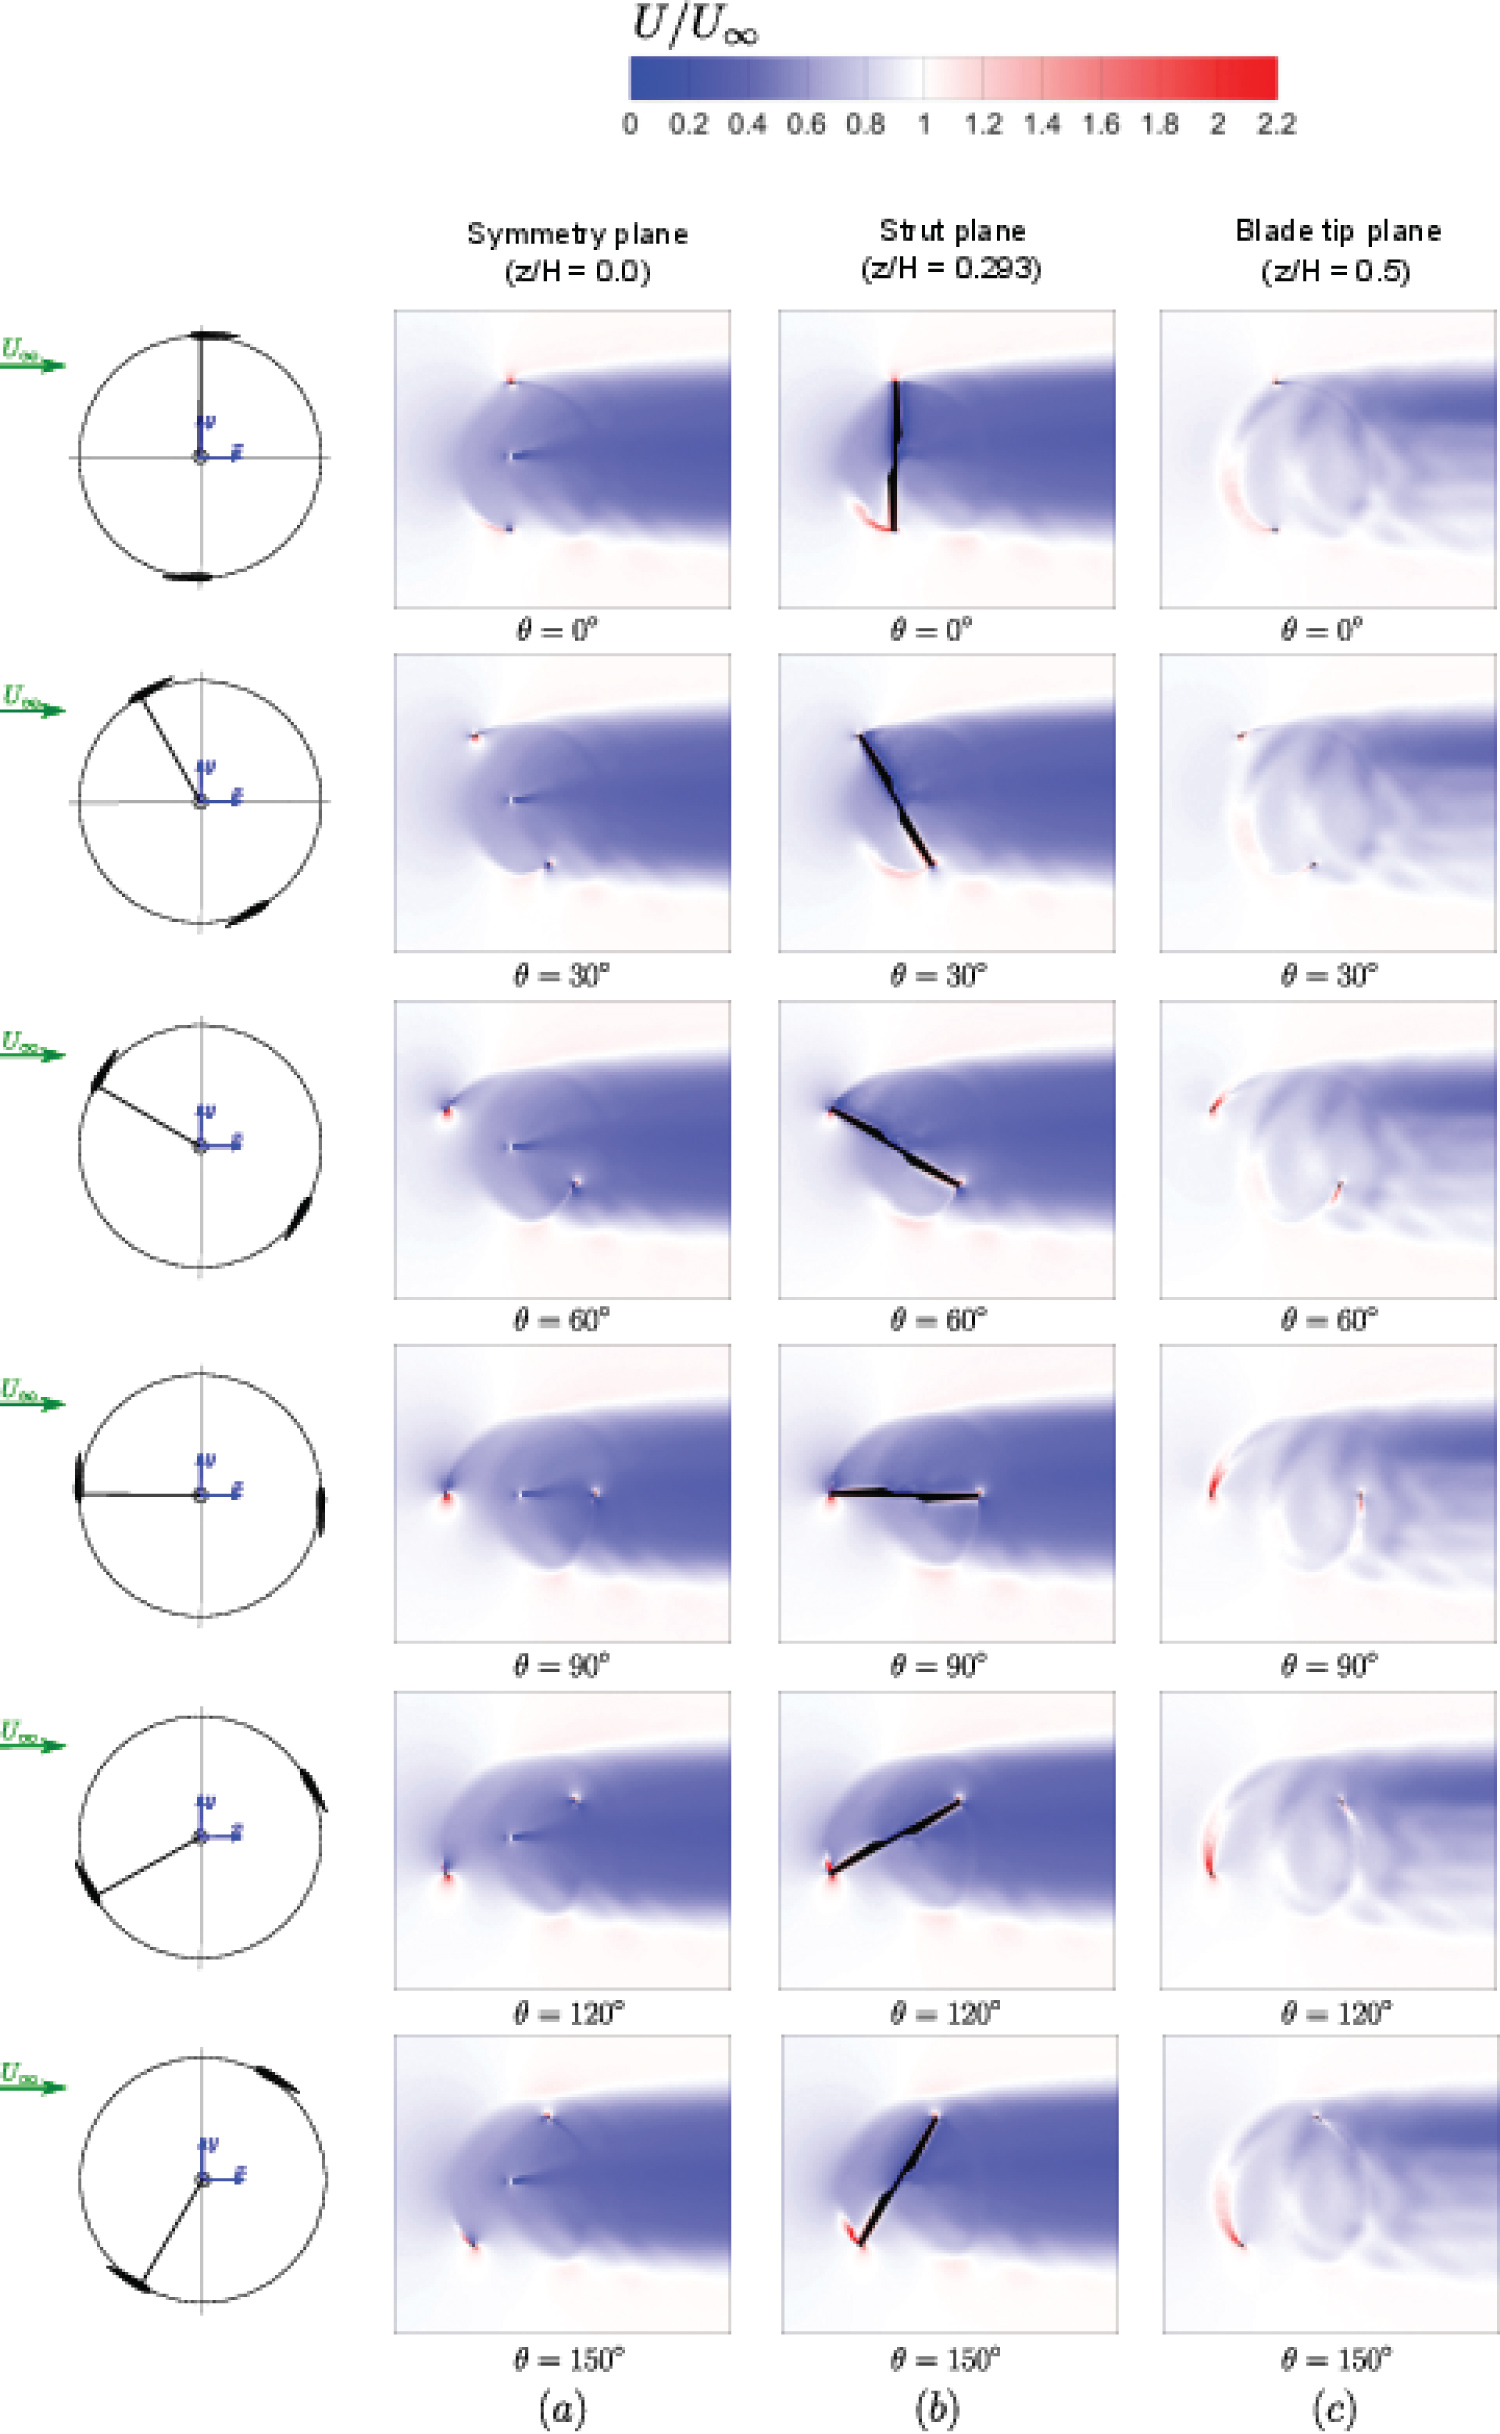
Spanwise planes: Figure 24 chronologically shows the instantaneous velocity flow field on the horizontal x-y planes for three turbine spanwise locations. Figure 24a shows the velocity contours at the turbine mid-span, while Figure 24b and Figure 24c display the velocity contours on the strut plane and on the blade tip plane, respectively.
The velocity flow field at the turbine mid-span plane is observed to be organised and subsequently leads to the development of a symmetrical near wake. The wake region produced behind the rotating tower diffuses rapidly as the flow is transported downwind in Figure 24a. As highlighted earlier in Section 6.4.1, the rotating tower wake will eventually lead to the development of an asymmetrical region in the downstream wake velocity profiles where the maximum velocity deficit is achieved for this moderate TSR. The inclusion of the turbine struts is shown to decrease the turbine near wake velocity at the slice plane shown in Figure 24b. More importantly, an accelerated flow region develops at the blade-strut junction which is clearly visible at θ = 150° (in dark red colour) in Figure 24b. This region of strong accelerated flow is due to the creation of a horseshoe vortex at the blade-strut junction and is eventually shed into the turbine near-wake in Figure 24b.
For the velocity contours at the blade tip plane shown in Figure 24c, a notable reduction in the blockage flow velocity upwind of the turbine is observed when compared to the flow field at the mid-span plane displayed in Figure 24a. There is also an attenuation in the deficit wake velocity at this spanwise position in Figure 24c due to the turbine blade elements extracting far less energy from the oncoming flow when compared to the blade elements at the mid-span plane. In comparison to the wake velocity contours on the mid-span plane, the turbine wake velocity at the blade tip in Figure 24c is asymmetrical in shape. Moreover, the downwind wake velocities at the turbine windward side (y > 0) are lower compared to the downwind wake velocities experienced at the turbine leeward side (y < 0). This phenomenon is a consequence of the creation of blade tip vortices, whereby the flow is able to leak around the blade tips. In particular, between θ = 60° and θ = 150° in Figure 24c, the rapid acceleration of the flow at the upwind blade tip is clearly seen. As a result, the blade tip section extracts very little energy in this azimuthal region of the cycle and subsequently produces the notable wake asymmetry at this spanwise blade location.
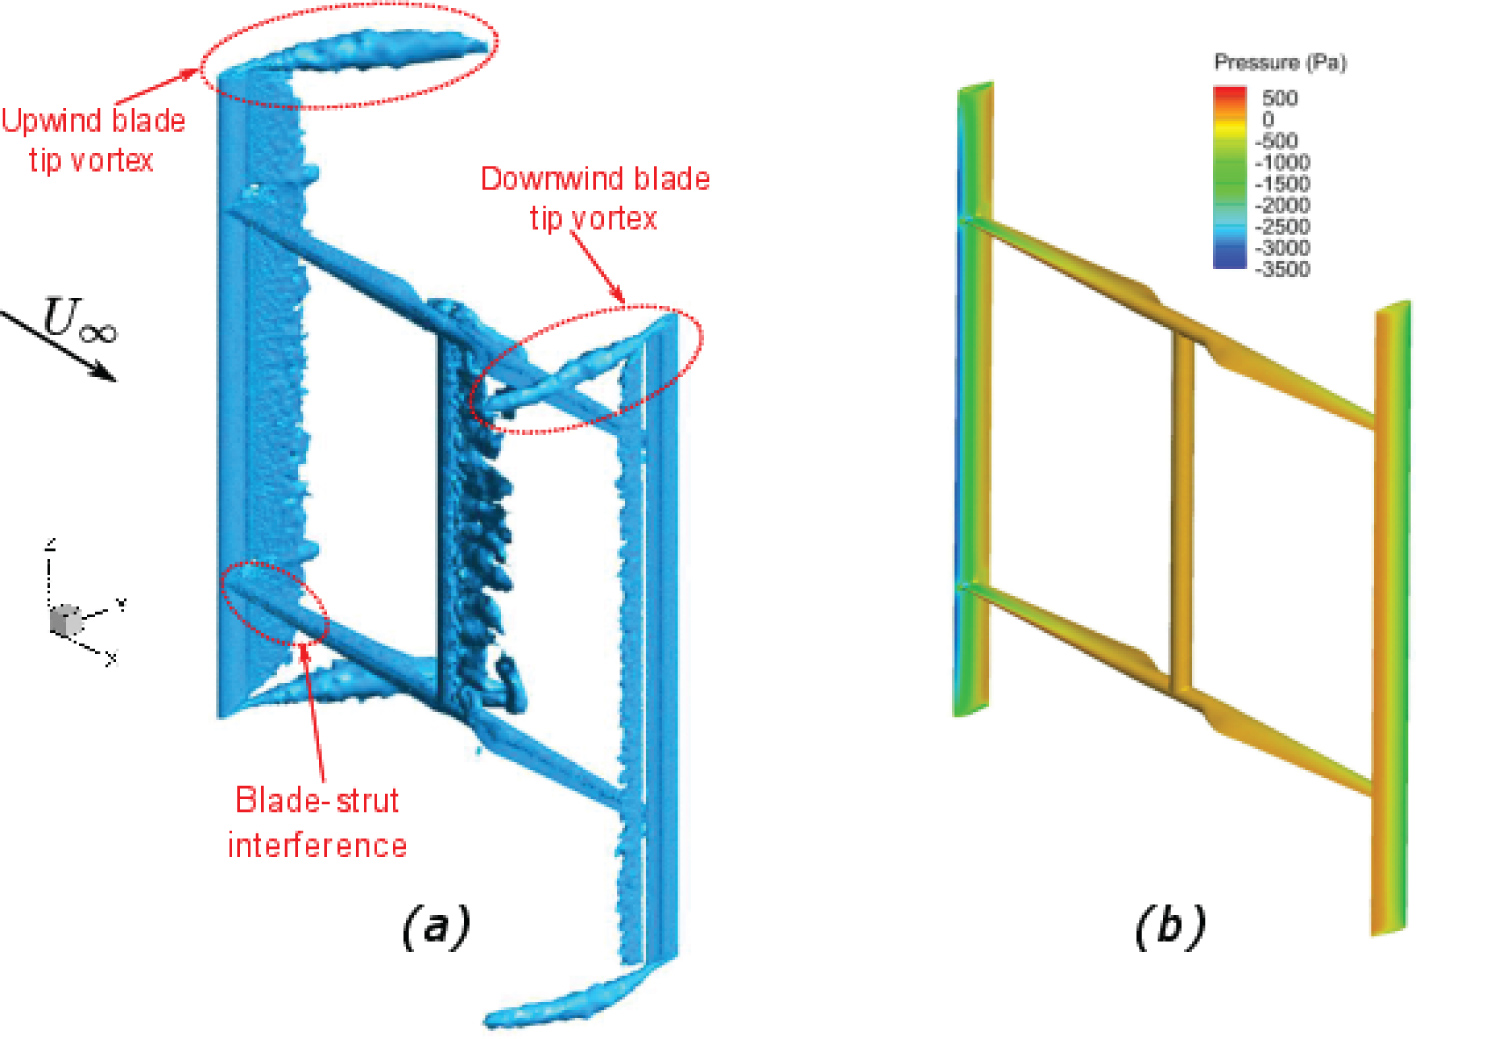
The strongest blade tip vortex is created at approximately θ = 90°, which corresponds to the location where the largest blade angles of attack are encountered during the turbine revolution [29,41]. To investigate in greater detail the structure of the blade tip vortex, a 3D flow visualisation is depicted in Figure 25 at θ = 90°.
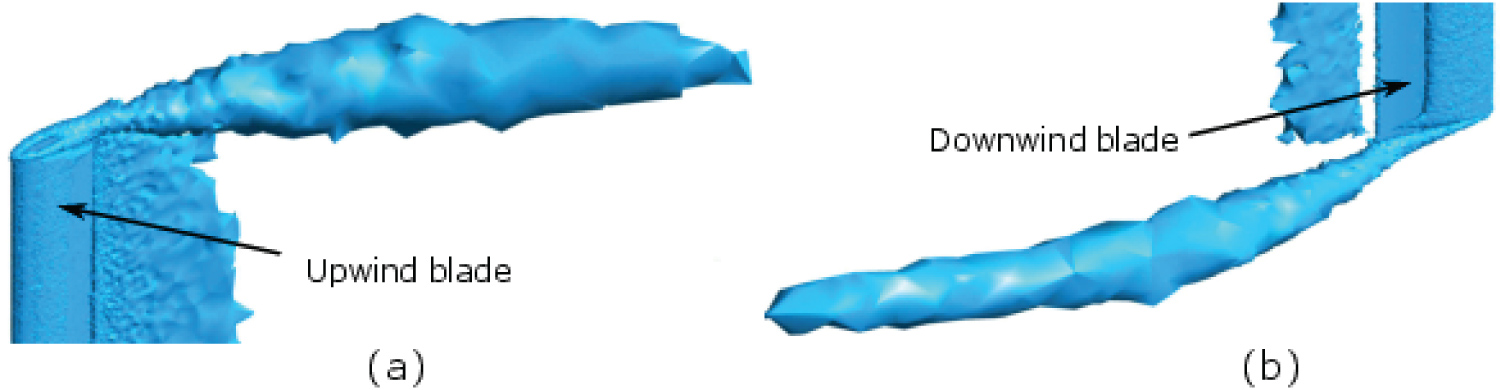
This isosurface plot displays the generated vorticity by the turbine blades and also by its support structure. The close-up plot in Figure 26, reveals that the upwind blade tip vortex is considerably larger in size compared to the blade tip vortex created by the downwind blade at this instant.
Moreover, the downwind blade experiences a lower effective angle of attack compared to the upwind blade, as it experiences lower incident flow velocities due to operating in the wake region produced by the preceding blade. Consequently, the pressure differential between the suction and pressure side of the downwind blade is lower compared to the upwind blade, which inevitably creates a smaller blade tip vortex structure, as can be observed in Figure 26.
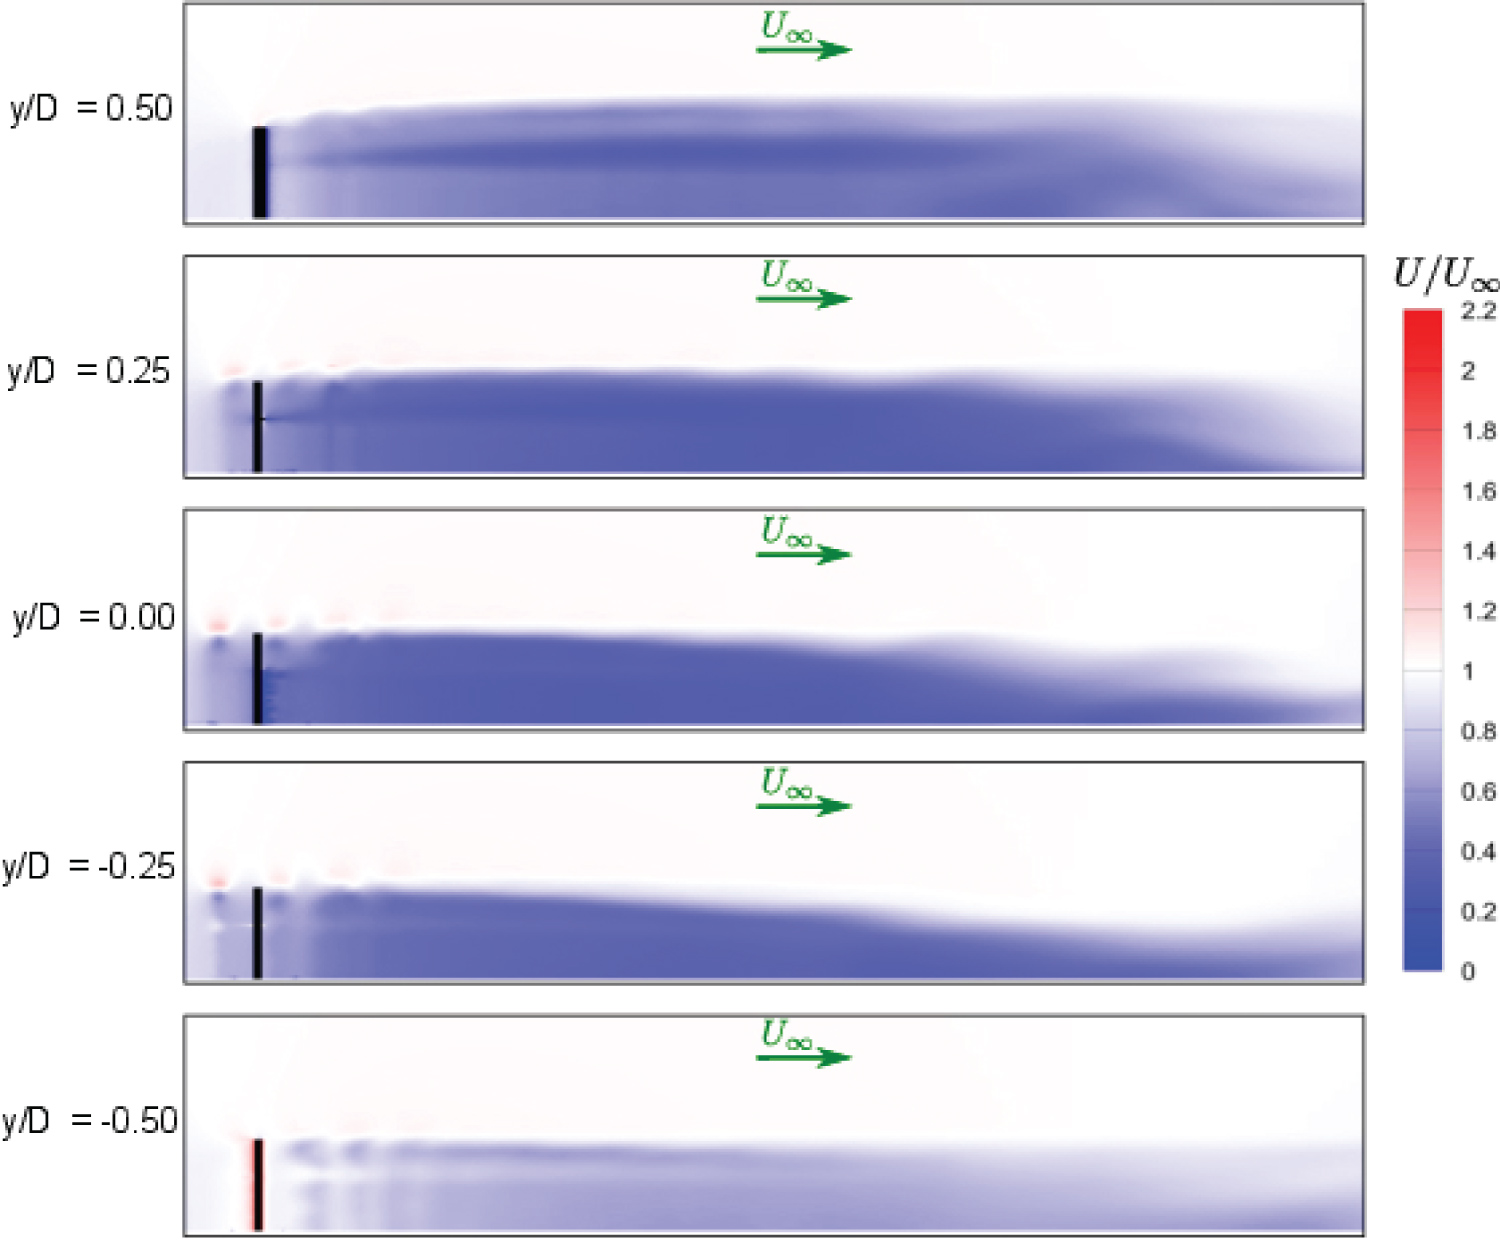
Streamwise planes: Figure 27 displays the instantaneous velocity contours at various vertical traverse planes at θ = 0°.
Half of the turbine height is shown in these contour plots and the turbine is highlighted in a black colour to improve clarity. It is observed the turbine wake velocity varies considerably in the traverse direction and is asymmetric about the turbine center plane (i.e. the y/D = 0 plane). The minimum wake velocity is clearly seen to occur behind the tower at y/D = 0. Furthermore, the transportation of the blade tip vortex downstream is visible at y/D = 0 and also at y/D = -0.25 in Figure 27. This vortex flow region corresponds to the blade tip flow formation evident at θ = 0° displayed earlier in Figure 24c. It is interesting to observe the effect of the strut on the downstream wake development at the positions y/D = 0.5 and y/D = -0.5 in Figure 27. At position y/D = 0.5, the strut is proceeding directly into the oncoming flow and subsequently produces a large wake region which diffuses in the wake horizontal and vertical directions downstream. In comparison, at position y/D = -0.5, the strut has a lower impact on the downwind wake, as it is operating in the wake produced by the preceding blade and subsequently creates a much lower parasitic torque at this instant.
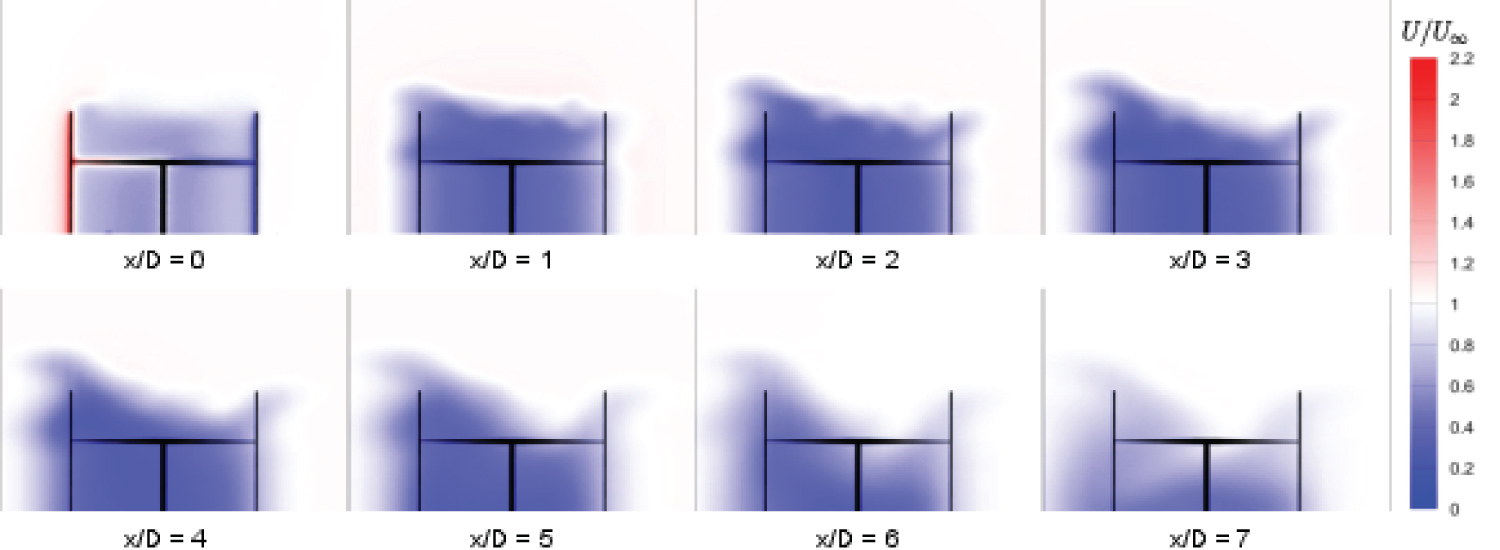
Downstream planes: The contour plots in Figure 28 display the evolution of instantaneous wake velocity at various downstream distances (x/D = 1 → 7) with θ = 0°.
Half of the turbine structure is superimposed on the contour plots to assist this description of the downwind flow field. The wake velocity asymmetry about the x-z plane at the tower centerline is clearly apparent at each downstream plane. The minimum deficit wake velocity region appears to veer progressively towards the turbine windward side as the downstream distance is increased and this agrees with observation made by Lam and Peng [12] and Simao Ferreira [29]. Furthermore, the windward wake region expands substantially more than in the horizontal and vertical directions compared to the leeward wake region as the downstream distance is increased in Figure 28. Beyond the downstream distance of x/D = 3, the wake region close to the center of the turbine begins to shrink in size. Subsequently, the windward and leeward wake regions appear to become less connected as the downstream distance is increased.
Insight into the VAWT dynamic stall regulation
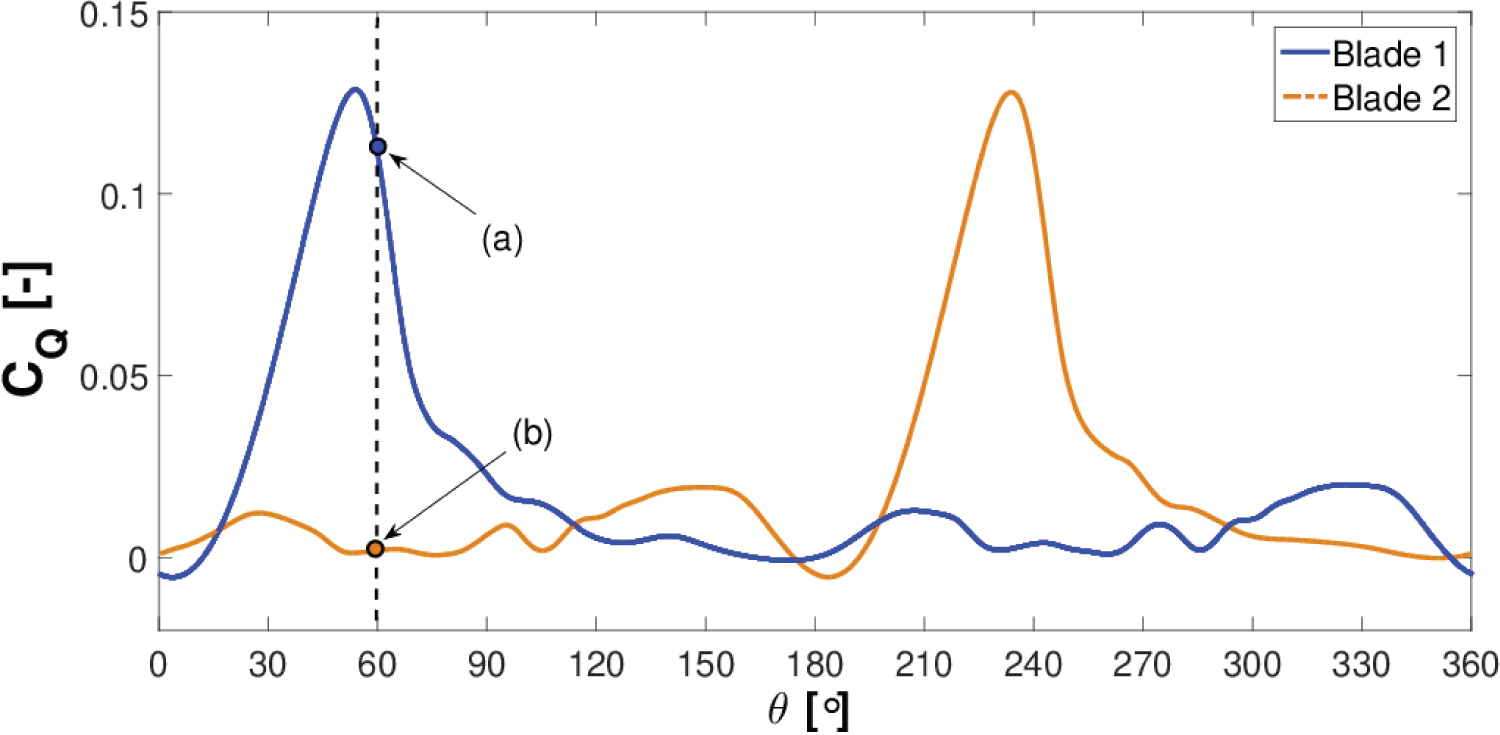
Figure 29 displays the instantaneous torque coefficient produced by both of the VAWT blades at the stall TSR, λ = 1.286.
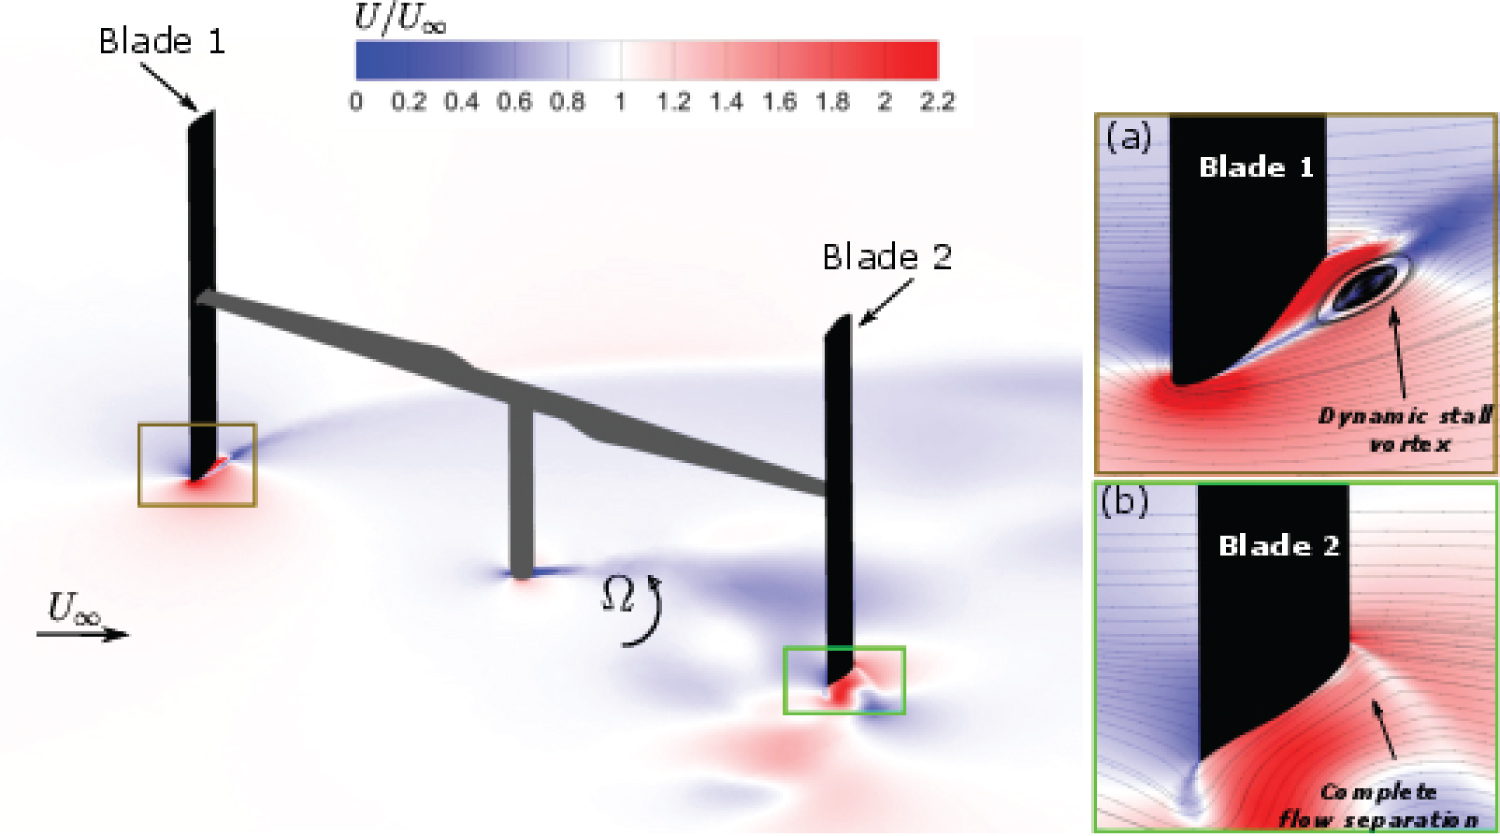
To explain in greater detail the stall regulation of the VAWT, Figure 30 shows the velocity flow field at the VAWT mid-span at an instant equivalent to an azimuthal angle of θ = 60° and is also highlighted in Figure 29.
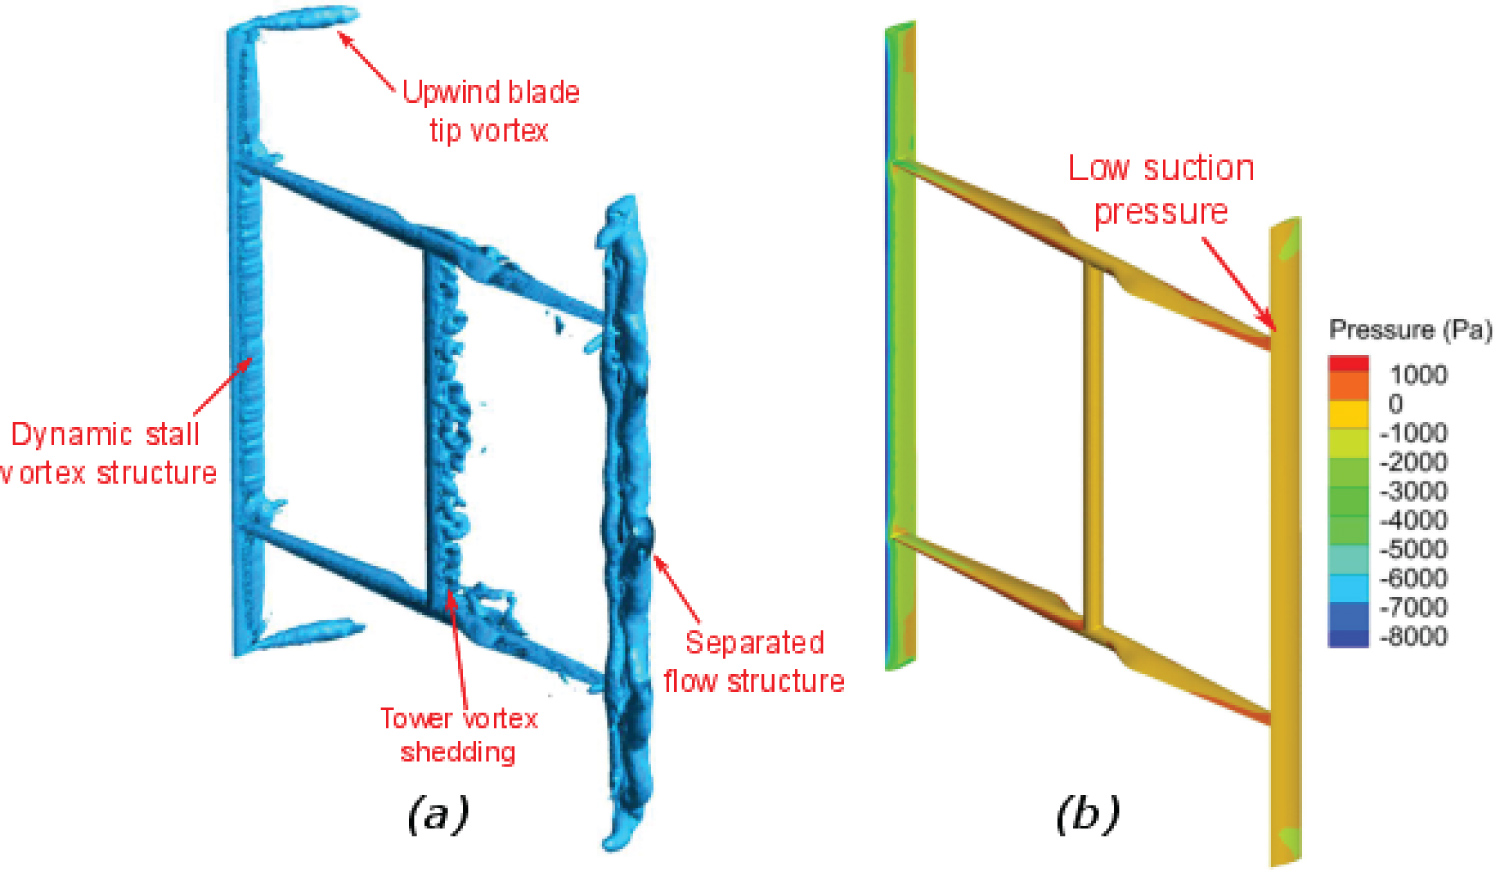
The localised flow regime in the vicinity of the individual VAWT blades is also shown in Figure 30a and Figure 30b, respectively. These highlighted plots correspond to markers labelled on the instantaneous torque coefficient profiles in Figure 29. It can be readily observed in Figure 30a, that there is a dynamic stall vortex present on the upwind blade suction surface. It can also be noticed that the suction surface flow is not completely separated at this moment. In comparison, the downwind blade (blade 2 in this case) the flow is completely separated and this demonstrates why the blade produces such a low torque coefficient at this position in Figure 29 during the VAWT cycle. In comparison, to the optimum TSR flow regime (i.e. λ = 3.140) seen earlier in Figure 26a, the blade tip vortices are smaller in size at this low TSR and there is no clearly defined tip vortex present on the downwind blade tip shown in Figure 31a.
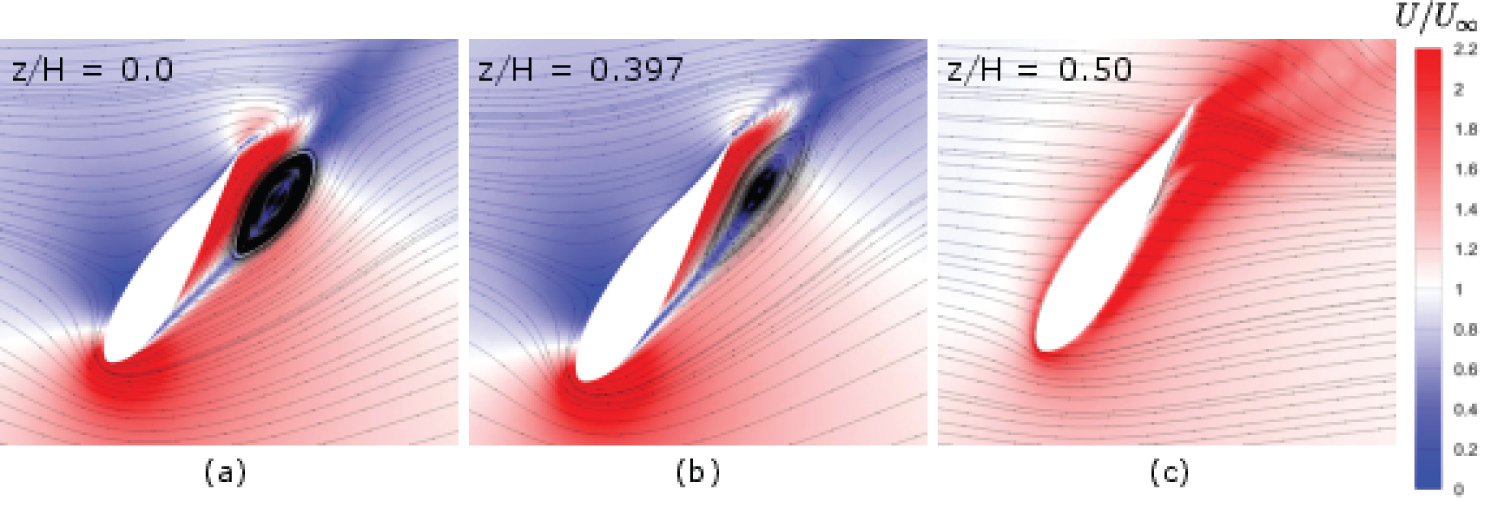
A low uniform pressure distribution is observed on the downwind blade surface, as the flow is entirely separated along the blade span as shown in Figure 31b and this explains the lack of the tip vortex structure. Upon further examination of Figure 31, it can be seen that the upwind blade does not experience a uniform dynamic stall vortex formation along its span. In other words, it is apparent that the size of the dynamic stall vortex decreases from the VAWT mid-span to the blade tip. To explain further, various blade spanwise sections are considered in Figure 32, to illustrate the reduction of the dynamic stall vortex magnitude from the VAWT mid-span (z/H = 0.0) to the blade tip (z/H = 0.50).
Comparing Figure 32a and Figure 32b, it can be clearly seen that the latter experiences a flatter and less prominent vortex compared to the former over the aft portion of the blade. At the blade tip in Figure 32c, the downwash due to the blade tip vortex greatly reduces the blade angle of attack relative to the VAWT mid-span and consequently no dynamic stall vortex is present at the blade tip spanwise section. The flow streamlines are unable to follow the blade profile in Figure 32c and from further inspection, it is apparent that the flow instead travels over the blade tip from the pressure side to the suction side. Subsequently, this produces a circulatory fluid motion which forms the blade tip vortex and trails the upwind blade downstream as displayed in Figure 31a. As highlighted in previous works by Zanforlin and Deluca [42] and by Balduzzi, et al. [15], the blade tip vortex is responsible for the production of downwash and the subsequent variation in the angle of attack along the blade span, following the theory of finite wings [43].
Design enhancement investigation
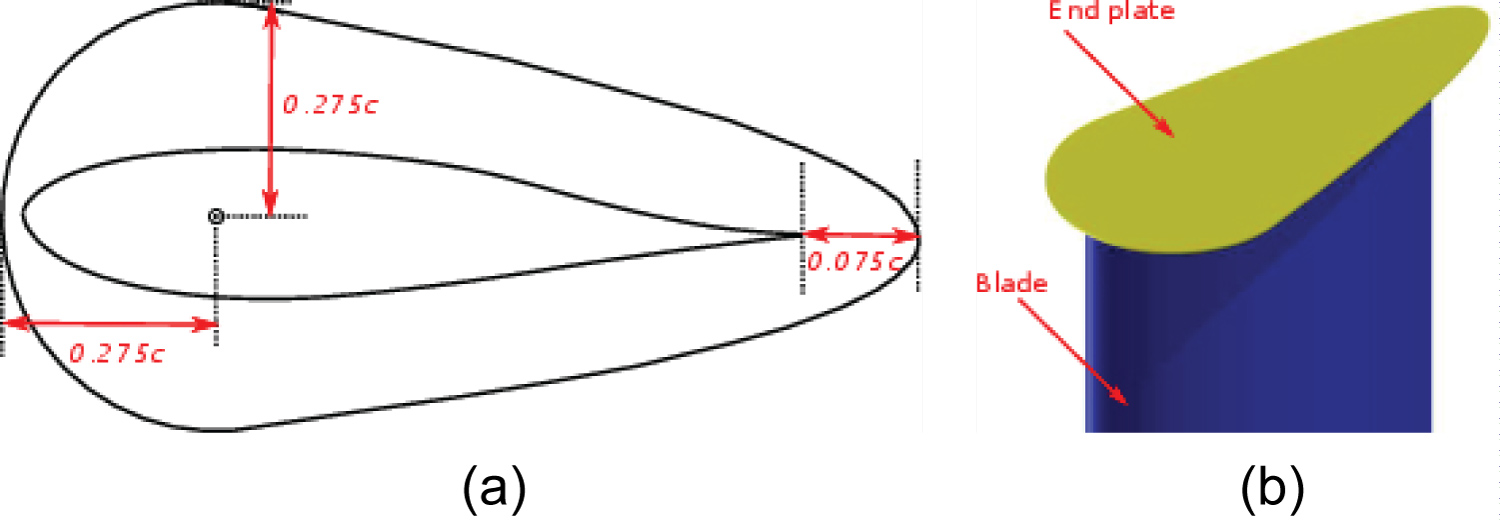
Blade end plates: In this section, an investigation is undertaken to examine the impact of blade end plates on the perfor- mance of the VAWT. The end plates are positioned at the blade tips, in an attempt to reduce the power losses sustained from the creation of the blade tip vortices. A conservative end plate design is utilised and is similar to the design used by Kinsey and Dumas [44] for an oscillating foil hydrokinetic turbine. Figure 33 presents the geometry of the blade end plate employed in this analysis.
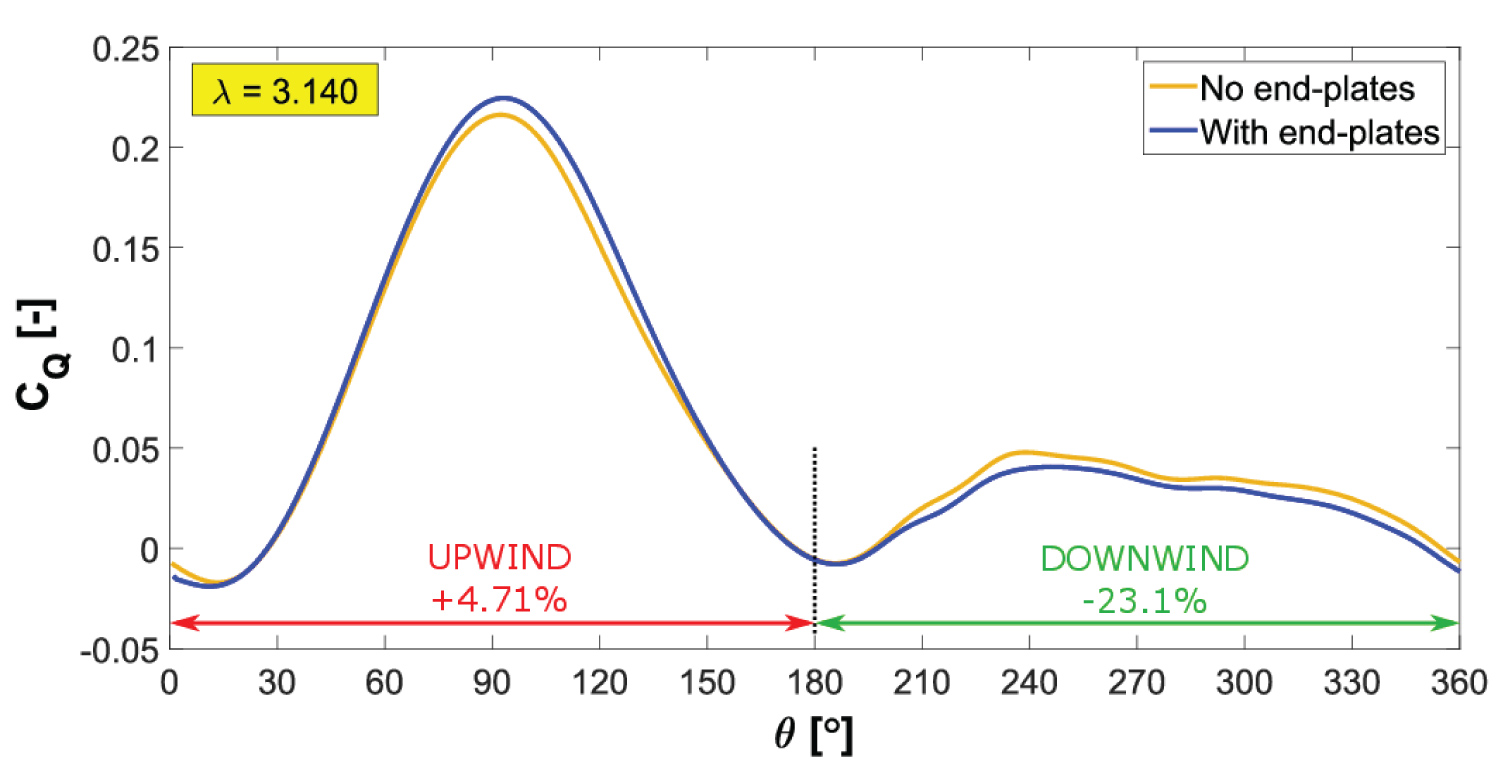
The VAWT with the attached end plates was simulated at the optimum TSR λ = 3.140. A comparison of the blade instantaneous torque coefficient generated with and without the end plates is displayed in Figure 34.
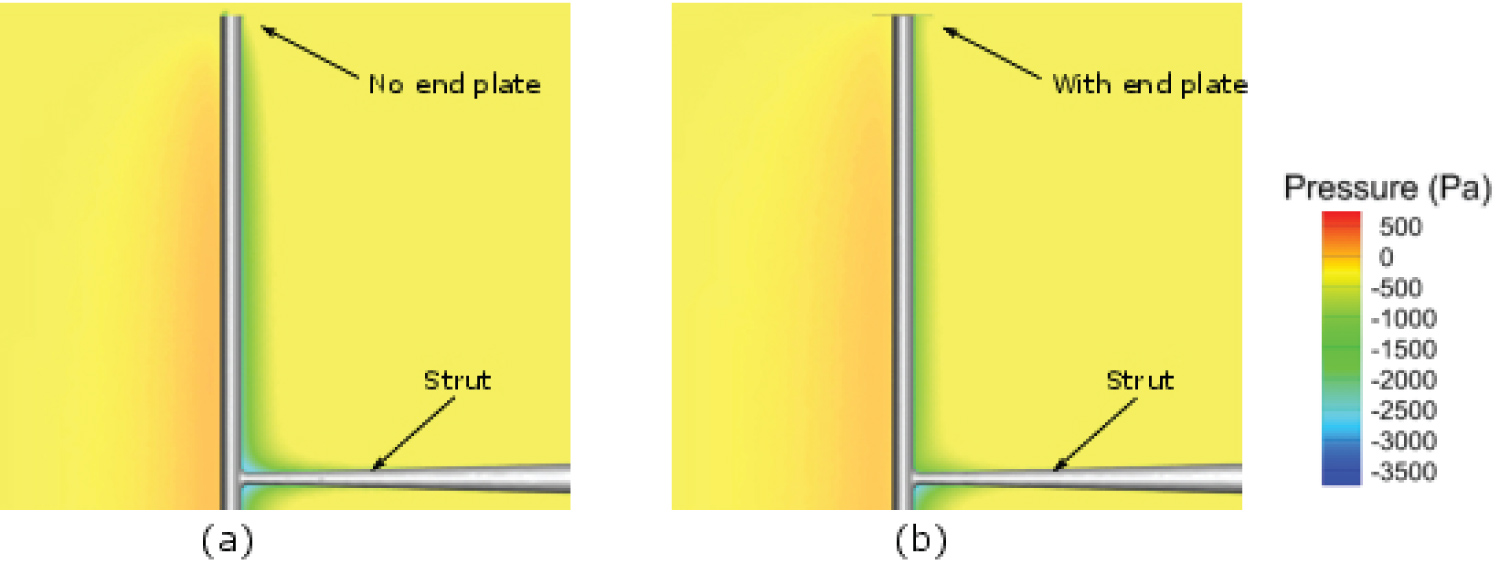
Firstly, examining the blade upwind phase in Figure 34 shows an improvement in the efficiency, with a 4.71% increase in the mean torque coefficient for this period. It can be observed the greatest increase in the upwind instantaneous torque occurs at θ ≈ 90° where the highest angle of attack is experienced. Moreover, the pressure differential between the blade suction and pressure sides is at its largest magnitude at this instant during the cycle. To investigate in greater detail this efficiency improvement, Figure 35 shows the pressure distribution near the blade tip with and without the end plates attached at θ = 90°. The VAWT is shown in Figure 35 with the blade leading edge facing forward.
The blade without the end plate has a lower pressure difference between the two sides of the blade especially with a weaker pressure difference noted near the blade tip compared to the blade with the end plate.
Examination of the downwind phase in Figure 34 shows the blade instantaneous torque coefficient with the end plates is smaller compared with the blade without the end plates. The blade mean torque coefficient is reduced by 23.1% for this period. It is clear the end plates are more effective during the upwind phase compared to the downwind phase and overall decrease the global aerodynamic efficiency by 0.73% (i.e. over the complete revolution). The blade experiences a much lower pressure differential during the downwind compared to the upwind phase. The end plate introduces additional drag through an increase in the wetted area and interference drag [45], which causes this reduction in performance to be dominant during the downwind phase. From this analysis, it is important to state the design of the end plate is critical and their size should be reduced in order to decrease the added drag.
Conclusions
The primary conclusions from this study are:
• The predicted characteristic performance curve by the 3D CFD model and the LOM showed good agreement with each other, but with the latter requiring a small fraction of the computational resources needed by the former. For completeness, the results of a 2D CFD model were included. The 2D CFD model predicted a 39.60% higher power coefficient at the optimum TSR, compared to its 3D counterpart. At the stalled TSR, a 31.83% higher power coefficient with respect to the 3D CFD model results was found. All the computational methods showed a similar value for the optimum TSR and the overall shape of the characteristic performance curves were qualitatively similar for the employed methods.
• It was identified that the VAWT support structure reduced the turbine power coefficient by 5.1% and 6.6% for the rated and optimum TSRs, respectively. In particular, the strut creates a fluctuating resistant torque which becomes maximum when the strut proceeds directly into the oncoming flow and this is confirmed by visualisation of the VAWT flow field. The maximum support structure instantaneous resistant torque does not coincide with this azimuthal location and was found to shift azimuthally with the TSR value.
• The resistant torque produced by the rotating VAWT tower is inappreciable and it can be inferred that its shadow effect on the downstream VAWT blade is a more important performance consideration.
• A vortex is formed at the blade-strut connection point in the azimuthal range between θ = 90° and θ = 180°. Also, there is evidence that the strength of this vortex becomes more pronounced when the TSR is decreased due to the greater non-linearity observed in the strut torque response.
• The turbine lateral force was found to become maximum and minimum at the same azimuthal angles irrespective of the TSR value. Moreover, the turbine inline force is considerably larger than the lateral turbine force and was found to be between 50% and 75% higher for the TSRs examined. The prediction of these turbine forces has an important impact on the floating platform design and the associated connected mooring system design.
• At the optimum turbine TSR, the time-averaged streamwise wake velocity profile is weakly asymmet- rical on the turbine mid-span plane. Although for the rated TSR, the influence of blade dynamic stall causes the wake velocity profile to be become increasingly asymmetrical. Furthermore, the creation of the blade tip vortices leads to the development of an asymmetrical wake profile on the blade tip plane.
• While the 3D CFD simulation is resource intensive, it did allow the flow visualisation of some important 3D aerodynamic phenomena at this large-scale, which is not possible with the 2D CFD model or the LOM. In particular, the capture of the blade tip vortex is a significant feature of the 3D simulation. A qualitative analysis identified that the blade tip vortex varies in size and impact relative to the VAWT operational conditions. The upwind blade tip vortex is more intense compared to the downwind blade tip vortex. The magnitude of the tip vortex is dependent on the azimuthal position in response to the continuously changing blade suction pressure differential. It was observed the blade tip vortex is asymmetrical with respect to the vertical y-z plane. The tip vortex is strongest in the azimuthal range of 60° < θ < 150° due to the high angles of attack encountered. Furthermore, the size of the blade tip vortex was found to decrease as the TSR value is reduced.
• The dynamic stall vortex flow topology is not continuous over the blade span and it is apparent the vortex strength reduces towards the blade tip. Flow visualisation showed the vortex size reduction is not proportional to the distance from the VAWT mid-span and is influenced by the blade tip vortex circulation.
• The addition of blade end plates was found to have a negative impact on the VAWT performance. The blade end plates reduced the VAWT efficiency by 0.73%, with contrasting performances found for the blade upwind and downwind phases. The mean torque coefficient was increased by 4.71% during the upwind phase. Flow visualisation showed the end plate produced a higher pressure difference between the blade surfaces for the upwind region. Over the downwind phase the mean torque coefficient was reduced by 23.1% compared to the case without end plates.
• In future work, the power extracted by the VAWT blade with respect to the spanwise position will be investigated using the 3D CFD model. This work will also investigate the potential of the CFD model to improve blade tip loss correction utilised in VAWT low-order aerodynamic models.
Acknowledgements
The authors would like to thank the Cork Institute of Technology Risam PhD Scholarship Program for supporting this research. The author wishes to acknowledge the DJEI/DES/SFI/HEA Irish Centre for High-End Computing (ICHEC) for the provision of computational facilities and support.
References
- GWEC (2019) Global wind energy council report 2018. Wind Global Council Energy 1-61.
- Hand B, Cashman A (2019) A review on the historical development of the lift-type vertical axis wind turbine: From onshore to offshore floating application, Sustainable Energy Technologies and Assessments 38.
- The J, Yu H (2017) A critical review on the simulations of wind turbine aerodynamics focusing on hybrid RANS-LES methods, Energy 138: 257-289.
- Meana-Fernandez A, Solis-Gallego I, Oro J MF, et al. (2018) Parametrical evaluation of the aerodynamic performance of vertical axis wind turbines for the proposal of optimized designs. Energy 147: 504-517.
- Tescione G, Simao Ferreira C, van Bussel G (2016) Analysis of a free vortex wake model for the study of the rotor and near wake flow of a vertical axis wind turbine. Renewable Energy 87: 552-563.
- Zanon A, Giannattasio P, Ferreira CJS (2012) A vortex panel model for the simulation of the wake flow past a vertical axis wind turbine in dynamic stall. Wind Energy 16: 661-680.
- Hand B, Kelly G, Cashman A (2017) Numerical simulation of a vertical axis wind turbine airfoil experiencing dynamic stall at high Reynolds numbers. Computers & Fluids 149: 12-30.
- Hand B, Cashman A, Kelly G (2016) A low-order model for offshore floating vertical axis wind turbine aerodynamics. IEEE Transactions on Industry Applications 53: 512-520.
- Balduzzi F, Bianchini A, Ferrara G, et al. (2016) Dimensionless numbers for the assessment of mesh and timestep requirements in CFD simulations of Darrieus wind turbines. Energy 97: 246-261
- Balduzzi F, Bianchini A, Maleci R, et al. (2016) Critical issues in the CFD simulation of Darrieus wind turbines. Renewable Energy 85: 419-435.
- Vassberg J, Gopinath A, Jameson A (2005) Revisiting the vertical-axis wind-turbine design using advanced computational fluid dynamics. 43rd AIAA Aerospace Sciences Meeting and Exhibit, AIAA, Reno, NV.
- Lam H, Peng H (2016) Study of wake characteristics of a vertical axis wind turbine by two- and three-dimensional computational fluid dynamics simulations. Renewable Energy 90: 386-398.
- Howell R, Qin N, Edwards J, et al. (2010) Wind tunnel and numerical study of a small vertical axis wind turbine. Renewable Energy 35: 412-422.
- Orlandi A, Collu M, Zanforlin S, et al. (2015) 3D URANS analysis of a vertical axis wind turbine in skewed flows. Journal of Wind Engineering and Industrial Aerodynamics 147: 77-84.
- Balduzzi F, Drofelnik J, Bianchini A, et al. (2017) Darrieus wind turbine blade unsteady aerodynamics: A three-dimensional Navier-Stokes CFD assessment. Energy 128: 550-563.
- Balduzzi F, Bianchini A, Ferrara G, et al. (2017) Three-dimensional aerodynamic analysis of a Darrieus wind turbine blade using computational fluid dynamics and lifting line theory. Journal of Engineering for Gas Turbines and Power 140.
- Marsh P, Ranmuthugala D, Penesis I, et al. (2015) Numerical investigation of the influence of blade helicity on the performance characteristics of vertical axis tidal turbines. Renewable Energy 81: 926-935.
- Alaimo A, Esposito A, Messineo A, et al. (2015) 3D CFD analysis of a vertical axis wind turbine. Energies 8: 3013-3033.
- Castelli MR, Benini E (2012) Effect of blade inclination angle on a Darrieus wind turbine. Journal of Turbomachinery 134.
- Subramanian A, Yogesh SA, Sivanandan H, et al. (2017) Effect of airfoil and solidity on performance of small scale vertical axis wind turbine using three dimensional CFD model. Energy 133: 179-190.
- Zamani M, Nazari S, Moshizi SA, et al. (2016) Three dimensional simulation of J-shaped Darrieus vertical axis wind turbine. Energy 116: 1243-1255.
- Wang Z, Zhuang M (2017) Leading-edge serrations for performance improvement on a vertical-axis wind turbine at low tip- speed-ratios. Applied Energy 208: 1184-1197.
- Shahizare B, Nik-Ghazali N, Chong WT, et al. (2016) Novel investigation of the different Omni-direction-guide-vane angles effects on the urban vertical axis wind turbine output power via three-dimensional numerical simulation. Energy Conversion and Management 117: 206-217.
- Elkhoury M, Kiwata T, Aoun E (2015) Experimental and numerical investigation of a three-dimensional vertical-axis wind turbine with variable-pitch. Journal of Wind Engineering and Industrial Aerodynamics 139: 111-123.
- Brochier G, Fraunie P, Beguier C, et al. (1986) Water channel experiments of dynamic stall on Darrieus wind turbine blades. Journal of Propulsion and Power 2: 445-449.
- Bergeles G, Michos A, Athanassiadis N (1991) Velocity vector and turbulence in the symmetry plane of a Darrieus wind generator. Journal of Wind Engineering and Industrial Aerodynamics 37: 87-101.
- Tescione G, Ragni D, He C, et al. (2014) Near wake flow analysis of a vertical axis wind turbine by stereoscopic particle image velocimetry. Renewable Energy 7: 47-61.
- Peng HY, Lam HF, Lee CF (2016) Investigation into the wake aerodynamics of a five-straight-bladed vertical axis wind turbine by wind tunnel tests. Journal of Wind Engineering and Industrial Aerodynamics 155: 23-35.
- Ferreira S (2009) The near wake of the VAWT: 2D and 3D views of the VAWT aerodynamics, Ph.D. thesis. Delft University of Technology.
- Wickens RH (1985) Wind tunnel investigation of dynamic stall of an NACA 0018 oscillating in pitch. Tech. rep., National Research Council of Canada.
- Johnston S (1982) Proceedings of the vertical axis wind turbine (VAWT) design technology seminar for industry. Tech. rep., Sandia National Laboratories, Albuquerque, New Mexico.
- Reuter RC (1980) Torque ripple in a Darrieus vertical axis wind turbine. Tech. rep., Sandia National Laboratories.
- Hand B, Cashman A (2018) Aerodynamic modeling methods for an offshore vertical axis wind turbine: A comparative study. Renewable Energy 129: 12-31.
- Hand B, Cashman A (2017) Conceptual design of a large-scale floating offshore vertical axis wind turbine. Energy Procedia 142: 83-88.
- Marsh P, Ranmuthugala D, Penesis I, et al. (2015) Three-dimensional numerical simulations of straight-bladed vertical axis tidal turbines investigating power output, torque ripple and mounting forces. Renewable Energy 83: 67-77.
- Sorensen JD, Sorensen JN (2011) Wind energy systems - Optimising design and construction for safe and reliable operation. Woodhead Publishing Limited.
- (2013) ANSYS fluent theory guide. Release 15.0, Tech. rep., ANSYS, Inc, Canonsbury, PA.
- Marsh P, Ranmuthugala D, Penesis I, et al. (2017) The influence of turbulence model and two and three-dimensional domain selection on the simulated performance characteristics of vertical axis tidal turbines. Renewable Energy 105: 106-116.
- He J, Jin X, Xie S, et al. (2020) CFD modeling of varying complexity for aerodynamic analysis of H-vertical axis wind turbines. Renewable Energy 145: 2658-2670.
- Joo S, Choi H, Lee J (2015) Aerodynamic characteristics of two-bladed H-Darrieus at various solidities and rotating speeds. Energy 90: 439-451.
- Paraschivoiu I (2002) Wind turbine design: With emphasis on Darrieus concept. Presses Internationales Polytechnique.
- Zanforlin S, Deluca S (2018) Effects of the Reynolds number and the tip losses on the optimal aspect ratio of straight-bladed Vertical Axis Wind Turbines. Energy 148: 179-195.
- Abbott HI, Von Doenhoff AE (1959) Theory of wing sections including a summary of airfoil data.
- Kinsey T, Dumas G (2012) Three-dimensional effects on an oscillating-foil hydrokinetic turbine. Journal of Fluids Engineering 134: 071105.
- Gudmundsson S (2004) General aviation aircraft design: Applied methods and procedures. Butterworth-Heinemann.
Corresponding Author
Brian Hand, Department of Mechanical, Biomedical and Manufacturing Engineering, Cork Institute of Technology, Cork, Ireland, Tel: +353-21-4335069.
Copyright
© 2021 Hand B. This is an open-access article distributed under the terms of the Creative Commons Attribution License, which permits unrestricted use, distribution, and reproduction in any medium, provided the original author and source are credited.