Numerical Simulation of Aerodynamic Penalties of the DHC-6 Twin Otter Aircraft in Heavy Rain
Numerical simulations are conducted on the DHC-6 Twin Otter wing and horizontal tailplane to explore the aerodynamic penalties that affect airfoil performance in heavy rain conditions. An Eulerian-Lagrangian two-phase flow method is used to simulate the aerodynamic performance of the wing under rainfall conditions. The air is regarded as continuous phase solved by the Reynolds averaged Navier-Stokes (RANS) equations. The rain is regarded as discrete phase solved by the particle equations of motion in the Lagrangian reference frame. Our simulation results agree well with the experimental data and show obvious regularity. The lift decreases and the drag increases under the influence of heavy rain. The wing experiences more severe aerodynamic penalties than the horizontal tailplane at the same rain condition. The influence of rainfall leads to premature stall and separation.
Nomenclature
AOA: Angle of attack, defined as the angle between the air velocity and the airfoil chord and is positive upward; EXP: Abbreviation of exponent function; L: Lift; D: Drag; P: Pressure; P0: Reference pressure; ρa: Density of air; v∞: Air free-stream velocity and C is the chord length of the airfoil of interest; c: Chord Length; Ce: Chord length after elevator shaft; Se: Area after elevator shaft; CL: coefficient; ; CD: Drag coefficient; ; CH: Hinge moment coefficient; ; CP: Pressure coefficient; ; R: Rain rate (mm·h-1); LWC: Liquid water content (g·m-3); D: Equivolume spherical diameter of raindrop (mm); V(D): Terminal velocity of raindrop (m·s-1)
Introduction
The aerodynamic penalty of aircraft flight through heavy rain has been deemed to be a critical cause in many severe aviation accidents. The Eastern Flight 066 accident at Kennedy Airport (NTSB, 1976) is a very instance, though the factor of heavy rain was not taken into consideration at that time [1]. Three years later, another Flight named 693, a Boeing 727-25 civil airplane suffered from an intense rainfall associated with wind shears in its eventual routine to the Atlanta International Airport [2]. Several severe aviation accidents in 1981 aroused people's consciousness of the seriousness of rain influence on aircraft flight [3]. In addition, flutter is another problem [4] which may cause severe aerodynamic penalty and aviation accidents whereas is not discussed in this paper.
Investigation of rain effect on aircraft flight was begun with the wind tunnel test, and the earliest was conducted by Rhode in 1941 [5]. It dealt with the situation of an aircraft encountering heavy rain at moderate cruising altitude of about 5000 ft and concluded that, the heavy rain exposure time is not sufficient to force the aircraft to the ground. In 1982, Haines P. A. and Luers J. K. did a research concerning on the frequency and intensity of very heavy rains and their effects on a landing aircraft [1]. In 1987, R. John Hansman, et al. compared the aerodynamic performance degradation of NACA 64-210, NACA 0012 and Wortman FX 67-K170 airfoils under low Reynolds numbers in heavy rain conditions and explored the various mechanisms underlying by forcing boundary-layer to transition [6]. In other similar wind tunnel experiments, laminar flow airfoils were also found to experience performance degradation approximately equivalent to that caused by tripping the boundary layer to turbulence [7-9]. In 1992, Gaudy M. Bezos determined the severity of rain effect, the aerodynamic penalty over a range of rain intensities and the importance of surface tension interactions of water as a scaling parameter [10]. B. E. Thompson and his team examined another NACA 4412 airfoil in moderate rain in wind tunnel. They primarily placed emphasis on the correlation of surface-film behavior including rivulet formation [11]. Subsequently, they went on further examination on the aerodynamic efficiency of the same airfoil in moderate rain [12]. Comparisons with different flow patterns showed that the aerodynamic degradation depended on the location of rivulet formation and the diameter of these rivulets. The latter factor was found to be more important to aerodynamic performance.
Numerical simulation approach was introduced and developed with the development of computer technology. In 1995, J. R. Valentine studied the NACA 64-210 airfoil aerodynamic performance [13] and the track of raindrops in flow over the airfoil [14] by numerical simulation. The results show that a 1-2° rain-induced decrease in stall angle of attack is predicted and a simple model is used to simulate impacts and the resulting splash back on the airfoil surface. In 1999, Brian E. Thompson calculated the location of the oneset of rivulet formation in the surface-water flow over a wing with a NACA 4412 airfoil and compared the results with wind-tunnel experiments [15]. The results show that when the Reynolds number in the 2.5 × 10⁵ to 4 × 10⁵, in the stall before the initial position can be wet and not wet coating on the surface of the stream formed in the length of the chord within the range of 3%. In 2003, Tung Wan and Shi-Wei Wu also conducted the numerical simulation of heavy rain effect on airfoil [16]. The water film layer and vertical rain mass flow rate on the airfoil upper surface was added, thus increasing the airfoil roughening effects. In 2010, Tung Wan studied the cruise and high-lift NACA 64-210 airfoil aerodynamic efficiency in heavy rain via a two-phase flow approach [17]. Later, he reinvestigated the high-lift NACA 64-210 with consideration of proper modeling of discrete water droplets, shear flow between airfoil elements [18] and studied aerodynamic performance of a 3D Blended-Wing-Body aircraft under severe rain through two-phase flow approach [19]. Zhang, Ismail and Cao studied aerodynamic characteristics of the NACA64-210 and NACA 0012 airfoils in rain and preliminarily explored the mechanism [20,21]. The results show that under the conditions of rainfall, water layer and surface accumulation of airfoil surface roughness effect on airfoil surface roughness, boundary layer caused by early transition caused by the lift coefficient decreases slightly, the drag coefficient increased; when the airfoil near stall, gathered in the early separation on the airfoil surface at the trailing edge of the water film will trigger the boundary layer flow, serious losses caused by aerodynamic performance.
As is presented above, present research methods of rain effect on aircraft aerodynamic performance are mainly wind tunnel test and numerical simulation. However, for the former method in one hand, the result of model test in wind tunnel may not be directly used for large-scale aircraft due to the complexity of multi-phase environment. For example, the Weber number of water can't be maintained uniform meanwhile. In the other hand, if the scale of model is decreased, then the testing velocity must be increased proportionally to a uniform Reynolds number, thus the wind tunnel test will be much more expensive and complex to manipulate. Because when the wind tunnel speed increases, it may cause the flutter of the model, and increase the difficulty of data acquisition, but also consume more energy. So numerical simulation method may as well be accepted a good approach to deal with the involved problem.
In numerical simulations, two approaches have been used to model multi-phase flows, that is, the Eulerian approach and the Lagrangian approach. They have been reviewed by James R. Valentine and Rand A. Decker [14]. The Eulerian approach treats the continuous fluid phase and the dispersed particle phase as continuum, while the Lagrangian approach solves time-averaged Navier-Stokes equations for the continuous fluid phase first and then integrates Lagrangian motion equation for the dispersed phase, this model is called Discrete Phase Model (DPM). There are two models including a one-way coupled model and a two-way coupled model in Lagrangian approach. The former model assumes that the particles motion is affected by the continuous phase, but the continuous phase is not affected by the presence of the dispersed phase. The latter takes the two-way exchange of mass, momentum and energy between the two phases into consideration.
Though rain effect on airfoil aerodynamic performance and some mechanisms have been exposed by wind tunnel tests, little work of numerically studying the mechanisms has been done. For example, Wan [16-19] and others mainly discussed airfoils aerodynamic performance in rain conditions at low angles of attack. The rain effect of airfoil at high angles of attack is little concerned. Zhenlong Wu studied the aerodynamic and maneuvering characteristics of the aircraft under rainfall conditions [21-24]. Simulation results are in good agreement with the experimental results.
The present study uses the discrete phase model (DPM) in Fluent to study the aerodynamic performance of the DHC-6 Twin Otter wing and horizontal tailplane in a heavy rain condition. The raindrops in our study are assumed to be non-evaporating and non-deforming spheres. The objective of our study is threefold: first, to explore the feasibility of numerical simulation approach to study the influence of rainfall on airfoil aerodynamic performance; second, to study on the influence of rainfall on airfoil aerodynamic performance; third, to track the influence of rainfall on stall and separation.
Numerical Approach
Fluid phase
The incompressible air flow field is solved by FLUENT, a common commercial flow field solver, the details of which can be referred to in the help literature [24] and will not be repeated here. Air free stream velocity is 61.7 m/s, so the Maher number is 0.18, and the air flow is incompressible flow. For a Reynolds number of 2.6 × 10⁶, the flow characteristic is considered as turbulent, so turbulence model is added to solve the Navier-Stokes equations. During the calculation, the steady pressure-based solver is chosen, of which the segregated SIMPLE algorithm is adopted to discretize the pressure-velocity coupling term. The pressure term uses second order scheme, and the QUICK scheme is used in the momentum term discretization. The Spalart-Allmaras (S-A) [24,25] turbulence model is adopted to model the turbulence effect. Spalart-Allmaras model consists in a one-equation turbulence model.
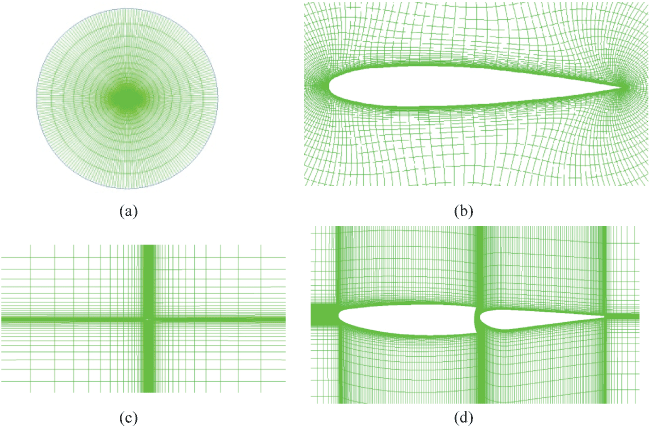
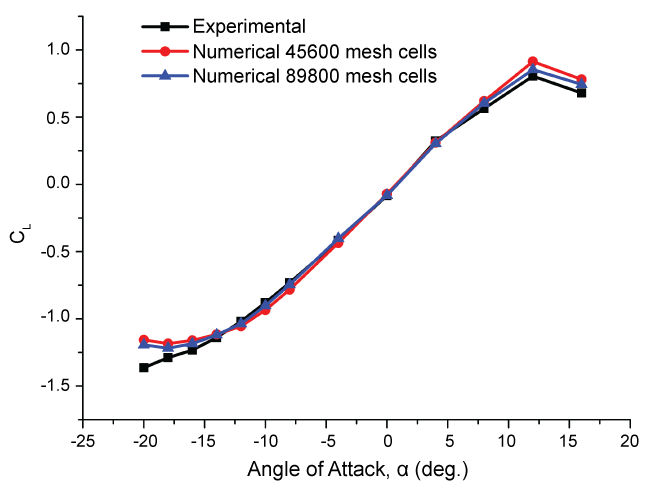
The meshes for the wing and the horizontal tailplane are shown in Figure 1, which consist of 19000 and 45600 mesh cells, respectively. The boundary condition for the computational domain is set as velocity inlet for both meshes and the body surface as no-slip wall. To verify that the grid being used for analysis is appropriate, we give another mesh, which consist of 89800 mesh cells. Comparison of calculated results is shown in Figure 2, Figure 3 and Figure 4.
Airfoil aerodynamic performance is measured by lift and drag coefficients in this research, which are defined as follows respectively:
Where CL is the lift coefficient and CD is the drag coefficient, L is the lift, D is the drag, ρa is the density of air, v∞ is the air free-stream velocity and c is the chord length of the airfoil of interest.
Particulate phase
Scaling of rain model
To study the heavy rain effect, first of all, it's necessary to measure the intensity and frequency of heavy rain. Usually the rainfall rate, R in millimeter per hour or the Liquid Water Content, LWC in gram per cubic meter is chosen to categorize different intensities of rain. A rainfall of 100 mm/h or greater is often deemed as heavy.
The LWC can be written as a function of N(D) as follows:
Where ρw is the density of water. Integrating the above formula, we may attain the correlation of LWC and R by
Subsequently, it's necessary to establish the size distribution of water droplets under different rain rates. Many authors like A. C. Best [26], Carlton W. Ulbrich [27] and so, on have established various raindrop size distribution formulas for various situations. Marshall and Palmer developed the classic formula of drop size distribution in 1948 based on massive experimental data [28]. It is shown as follows:
Where N(D) (m-3mm-1) is the number density of spherical raindrops of diameter D (mm) per cubic meter of air, Dmax is the maximum drop diameter. N0 and I (mm-1) are parameters of N(D) and have different values for different types of rain. For storm-type heavy rainfall, I varies with rainfall rate R as I = 3R-0.21, and N0 has the constant value N0 = 1400 m-3mm-1 [29] correspondingly.
The number density of raindrops in this interval is written as
And the average diameter of raindrops of 1 mm in our study is calculated by
Here, it is assumed that raindrops have been with uniform velocity before hitting the aircraft surface, that is, without acceleration. So it's important to determine the terminal velocity of raindrops. It has been developed by Markowitz [30] as
Where V(D) is the terminal velocity. A correction for it aloft is given by Markowitz as
Where is the terminal velocity consistent with the density of air aloft ρ0.
Wall-film model
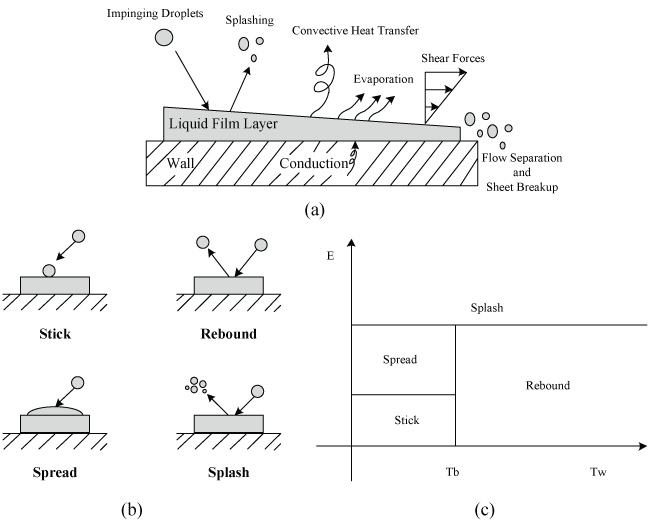
In our study, the wall-film model in Fluent [24] is mainly adopted to model the interaction of particle and wall surface. It allows a single-component liquid drop to impinge upon a boundary surface of arbitrary configuration and form a thin liquid film. The major physical processes that affect the liquid film include: mass and momentum contributions to the film thanks to drop impingement, droplet splashing effects, evaporation, shear forces on the film, dynamic pressure effects, gravity driven flow, convective heat and mass transfer, flow separation and sheet breakup, as shown in Figure 5. In present study, we ignore the film evaporation to simplify our solution, so it is unnecessary to consider the effects of the thin liquid film on the air flow.
The main assumptions for the film model are as follows:
• The layer is thin, less than 500 microns in thickness due to the assumption of a linear velocity profile in the film.
• The temperature in the film particles changes relatively slowly due to the use of an analytical integration scheme.
• The film temperature is always below the boiling temperature for the liquid.
• Film particles are assumed to be in direct contact with the wall surface and the heat transfer from the wall to the film occurs through conduction.
The wall interaction regimes are calculated for a drop-wall interaction based on local information. The four regimes including stick, rebound, spread, and splash are based on the impact energy and wall temperature, as shown in Figure 5 (Tb is the liquid boiling temperature and Tw is the wall face temperature). Below the liquid boiling temperature, the impinging droplet can stick, spread or splash, while above the boiling temperature, the particle can either rebound or splash. As to our case of which the temperature is below the boiling point, particles stick, spread and splash, resulting in aerodynamic efficiency degradation of an aircraft.
The criteria by which the regimes are partitioned are based on the impact energy and the boiling temperature of the liquid. The impact energy Eim is defined by
Where ρw is the water density, Vr is the particle relative velocity in the frame of the wall (i.e. Vr = Vp - Vwall), σw is the water surface tension, h0 is the total height of the wall film. δbl denotes the thickness of the boundary layer defined by
In the formula (10), is the Weber number (dimensionless), and is dimensionless, so Eim is dimensionless.
The sticking regime is applied when the dimensionless energy Eim is less than 16, and the particle velocity is set equal to the wall velocity. In the spreading regime, the probability of the drop having a particular direction along the surface is given by an analogy of an inviscid liquid jet with an empirically defined radial dependence for the momentum flux. If the wall temperature is above the boiling temperature of the liquid, impingement events below a critical impact energy (Eim) results in the particles rebounding from the wall. Splashing occurs when the impingement energy is above a critical energy threshold, defined as Ecr = 57.7. Besides, in our study we sample a cumulative probability distribution function (CPDF), which is acquired from a Weibull distribution function and fitted to the data from Mundo, et al. [31], to determine the different diameter of each splashed parcel. The equation of the cumulative probability distribution function can be expressed as
and it represents the probability of finding drops of diameter di in a sample of splashed raindrops.
The original NACA 64-210 airfoil in wet condition of LWC = 25 g/m3 is simulated and the results are compared with the wind-tunnel experimental ones in [10]. The wind tunnel experiment was conducted by Bezos, et al. [10] in the NASA Langley 14- by 22-Foot Subsonic Tunnel in 1992 to determine the aerodynamic penalty associated with a simulated heavy rain encounter. The model was comprised of a NACA 64-210 airfoil section with a chord of 2.5 ft, a span of 8 ft, and was mounted on the tunnel centerline between two large endplates. The rain simulation system manifold, which was located 10 chord lengths upstream of the model, produced liquid water contents ranging from 16 to 46 g/m3. Aerodynamic measurements in and out of the simulated rain environment were obtained to measure the airfoil aerodynamic coefficients.
Results and Discussions
Validation
To validate the accuracy of the numerical solver for air flow field prediction, we calculate the lift, drag and hinge moment coefficients for the DHC-6 Twin Otter tailplane under no rain condition. The numerical results are compared with the available experimental results [32], as shown in Figure 2, Figure 3 and Figure 4, respectively. The comparison shows that numerical results agree well with the experimental results both in trend and magnitude. It can be clearly seen that the numerical simulation results have little difference with the experimental results at low to moderate angles of attack, with slight difference at high angles of attack only. Considering this, most of the following calculations are performed at low to moderate angles of attack (including positive and negative). The present model has a desirable accuracy for the following simulations. And according to the calculation results of the two groups of meshes, the difference is within a reasonable range. It is proved that the mesh is appropriate.
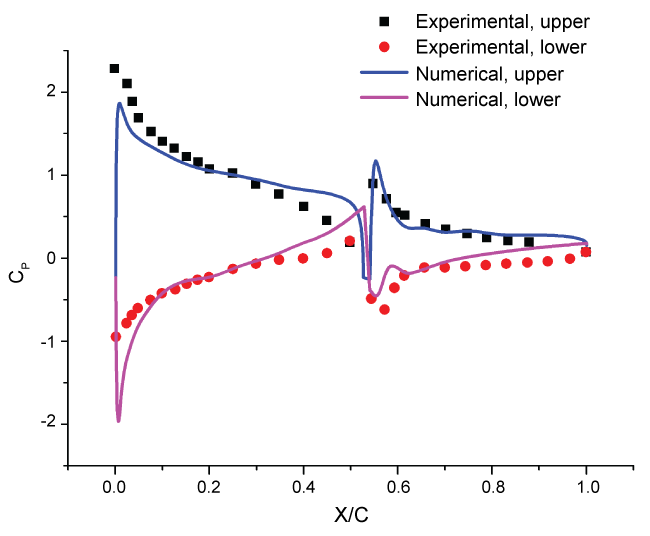
We also compared the distribution of pressure coefficient of the surface of the DHC-6 Twin Otter tailplane under no rain condition. The numerical results are compared with the available experimental results [32], as shown in Figure 6. We choose the meshes for the horizontal tailplane shown in Figure 1. It can be clearly seen that the numerical simulation results have good agreement with the experimental results.
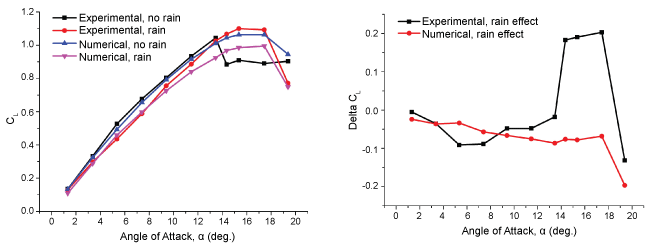
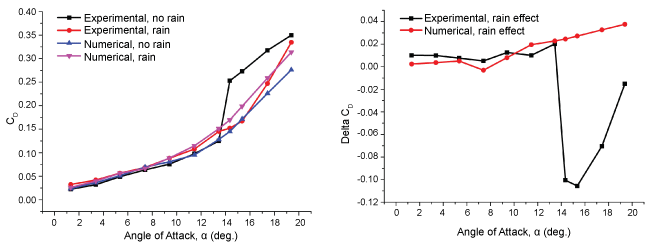
To validate the accuracy of the DPM model for rain modeling, we calculate the lift and drag coefficients for a NACA 0012 airfoil under the same rain conditions and compare the numerical results with the available experimental results [6] shown in Figure 7 (a) and Figure 8 (a). The rain effects on the lift and drag coefficients(Delta CL and Delta CD)are show in Figure 7 and Figure 8. It is seen that for the dry and rain conditions, both the trend and magnitude of the numerical results correspond well with the experimental results under low to moderate angles of attack. Aerodynamic performance penalties with decreased lift and increased drag are clearly observed in the rainy conditions. At high angles of attack especially beyond stall, a relatively large deviation from the experimental results appears. In addition, the rain caused a lagged separation in the experiment, thus cause a different effect from that at low angles of attack. These deviations may come from the intrinsic defect of the present turbulence model itself, as it may not predict the flow separation at high angles of attack well. In addition, this deviation may also be attributed to the forced transition in the experiment, as the transition is natural in our simulations. Considering this, most of the following calculations are performed at low to moderate angles of attack. The present rain model has a desirable accuracy for the following rain study.
Lift and drag force data
In the present work, the pressure-based unsteady solver with the first-order implicit scheme is adopted; the calculation condition of rain is shown in Table 1.
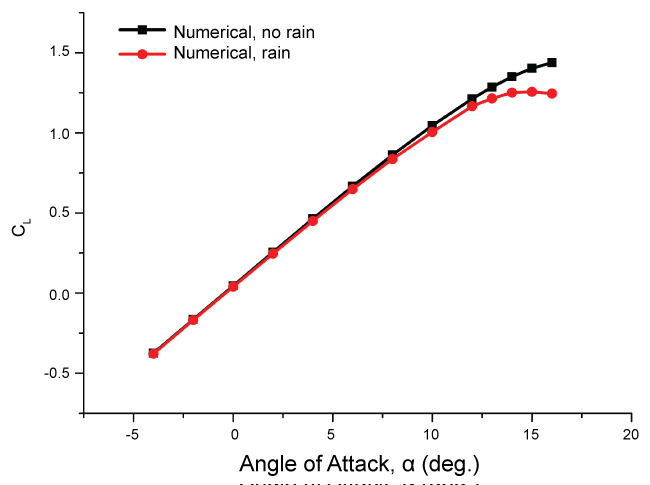
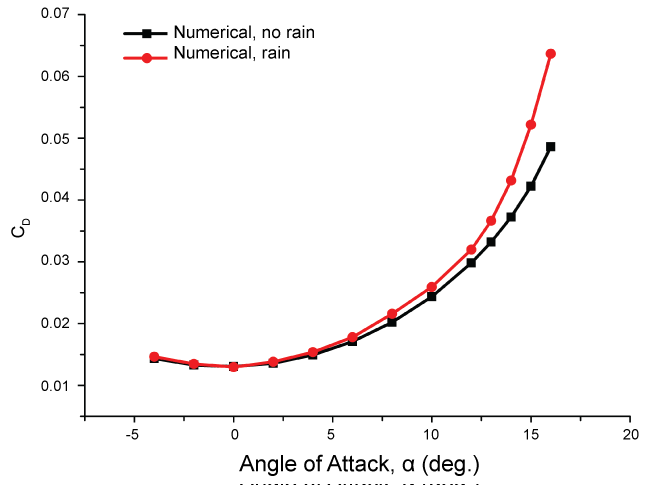
Figure 9 and Figure 10 show the lift and drag coefficients, respectively, for the wing in the rain and no rain conditions. It is easy to see that the influence of rainfall on the aerodynamic performance of the wing airfoil is very regular. Rainfall leads to decrease in the lift and increase in the drag. With the increase of attack angle, the effect of rainfall becomes more and more obvious until stalling speed. In contrast with the dry results, the maximum percentage of lift reduction is 13.4% and the maximum percentage of drag increase is 30.9%.
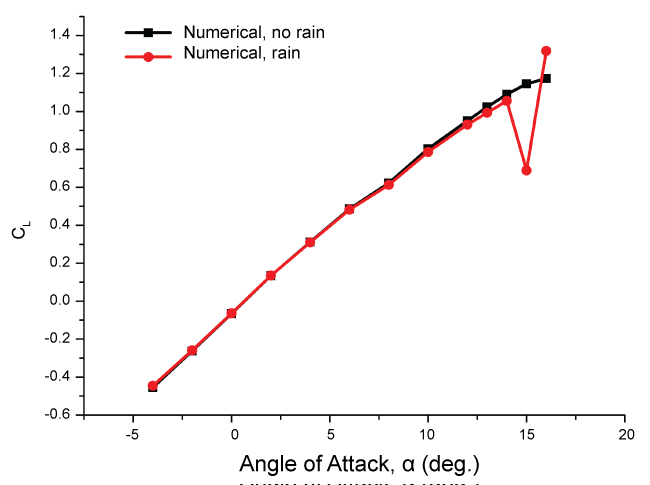
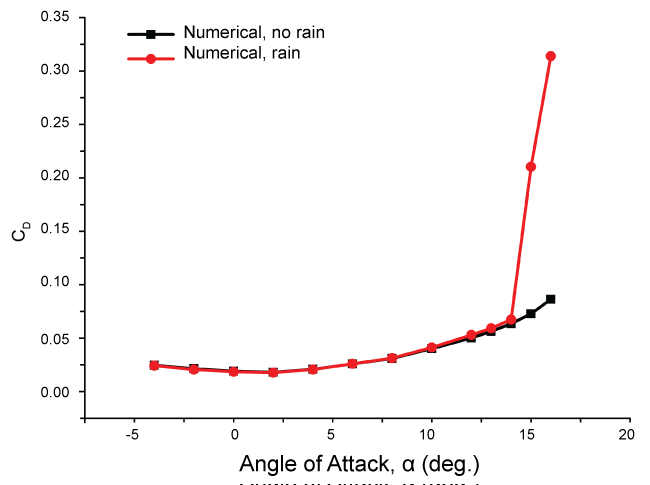
Figure 11 and Figure 12 present the lift and drag coefficients, respectively, for the horizontal tailplane airfoil in the rain and no rain conditions. It is shown that the trend of decrease in lift force and increase in drag force is still there due to rainfall. The effect of rainfall becomes more and more obvious with the increase of angle of attack. The maximum percentage of lift reduction reaches by 3.2%, and the maximum percentage of drag increase reaches by 6.1%. When the angle of attack increases to 15 or 16 degrees, the impact is much greater (more than 50%), where stall is expected to occur.
Flow field characteristics
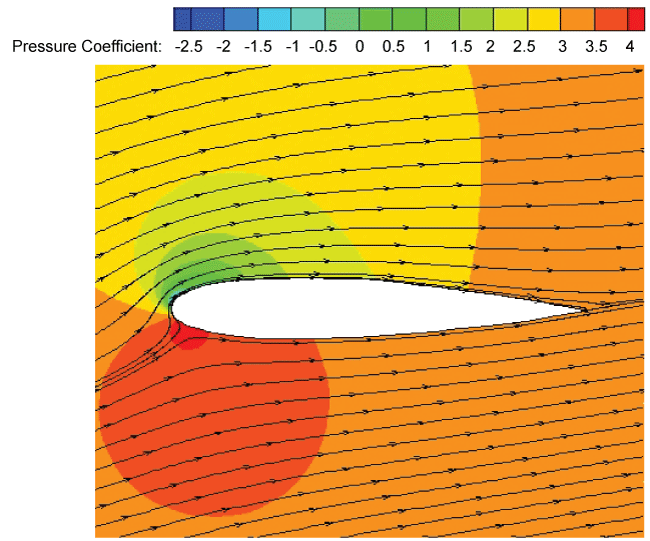
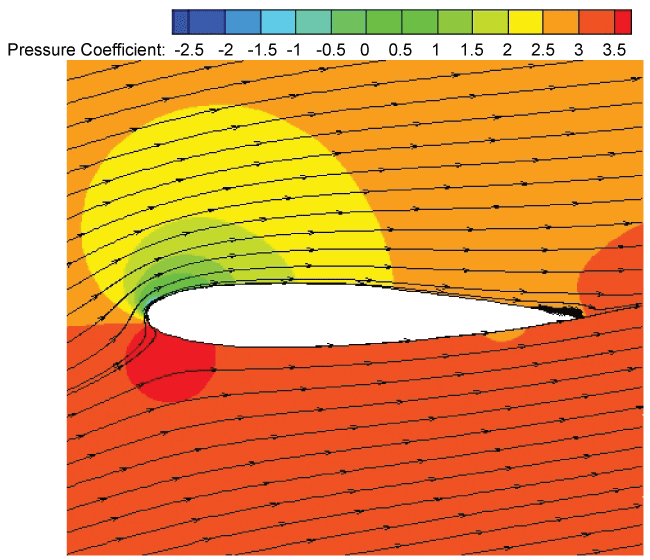
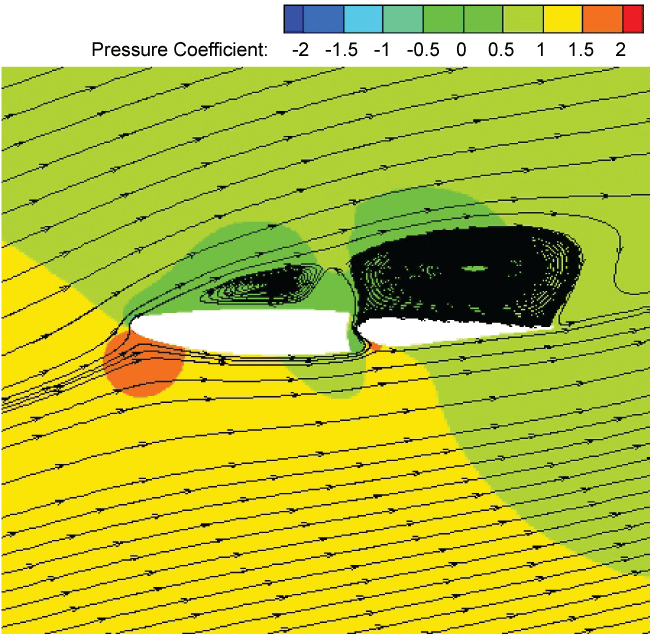
Figure 13, Figure 14, Figure 15 and Figure 16 show the pressure coefficient contour and the streamline distribution around the DHC-6 Twin Otter wing airfoil at AOA = 13 degree and the tailplane airfoil at AOA = 15 degree in the dry and rain conditions, respectively. The operating pressure is 101325 Pa. In the dry condition, the boundary layer has no rain-induced changes at the moment. While in the rain condition, the boundary layer has separated due to rain. The four contours reveal that premature boundary-layer separation occurs due to the existence of rain, which is consistent with the conclusion in [6]. Besides, the difference of the pressure coefficient distribution on the upper and lower surfaces of the leading edge of the both airfoils decreases with rain, thus the lift coefficients decrease in the rain.
Conclusion
In summary, this paper analyzes the aerodynamic performance loss of the DHC-6 Twin Otter aircraft wing and tailplane in the rain and no rain conditions qualitatively and quantitatively. In this study, many practical methods for numerical simulation approach are also found. Some new findings and conclusions of the present study are listed as follows:
(1) The influence of rainfall on airfoil aerodynamic performance can be simulated by numerical simulation. Compared with wind tunnel test, it can save manpower, resource and time.
(2) Rainfall induces adverse penalties on the aerodynamic performance, which leads to decrease of lift coefficient and increase of drag coefficient.
(3) With the increase of attack angle, the adverse influence of rainfall on the aerodynamic performance of airfoil increases.
(4) When the angle of attack is greater than a certain angle, the airfoil will stall in advance associated with premature boundary-layer separation.
References
- Haines PA, Luers JK (1982) Aerodynamic Penalties of Heavy Rain on a Landing Aircraft. NASA Technical Reports Server 72.
- Luers JK, Haines PA (1983) Heavy Rain Influence on Airplane Accidents. Journal of Aircraft 20: 187-191.
- Luers JK, Haines PA (1981) The effect of heavy rain on windshear attributed accidents. 19th Aerospace Sciences Meeting St Louis, MO, USA.
- Venkat L, Upadhyay A, Singh KK (2009) SVM based Aerodynamic Analysis of Cable Stayed Bridges. Journal of Advances in Engineering Software 40: 830-835.
- Rhode RV (1941) Some Effects of Rainfall on Flight of Airplanes and on Instrument Indications. United States.
- R John Hansman, Anthony P Craig (1987) Low Reynolds Number Tests of NACA 64-210, NACA 0012, and Wortman FX67-K170 Airfoils in Rain. Journal of Aircraft 24: 559-566.
- Campbell BA, Bezos GM (1989) Steady State and Transitional Aerodynamic Characteristics of a Wing in Simulated Heavy Rain. United States.
- Yip LP (1985) Wind Tunnel Investigation of a Full-Scale Canard-Configured General Aviation Aircraft. United States.
- Hansman RJ, Barsotti MF (1985) The Aerodynamic Effect of Surface Wetting Effects on a Laminar Flow Airfoil in Simulated Heavy Rain. Journal of Aircraft 22: 1049-1053.
- Bezos GM, Dunham RE Jr, Garl L Gentry Jr, et al. (1992) Wind Tunnel Aerodynamic Characteristics of a Transport-Type Airfoil in a Simulated Heavy Rain Environment. United States.
- Thompson BE, Jang J, Dion JL (1995) Wing Performance in Moderate Rain. Journal of Aircraft 32: 1034-1039.
- Thompson BE, Jang J (1996) Aerodynamic Efficiency of Wings in Rain. Journal of Aircraft 33: 1047-1053.
- Valentine JR, Decker RA (1995) A Lagrangian-Eulerian Scheme for Flow around an Airfoil in Rain. Int J Multiphase Flow 21: 639-648.
- Valentine JR, Decker RA (1995) Tracking of Raindrops in Flow over an Airfoil. Journal of Aircraft 32: 100-105.
- Thompson BE, Marrochello MR (1999) Rivulet Formation in Surface-Water Flow on an Airfoil in Rain. AIAA Journal 37: 45-50.
- Wan T, Wu SW (2009) Aerodynamic Analysis under Influence of Heavy Rain. Journal of Aeronautics Astronautics and Aviation 41: 173-180.
- Wan T, Pan SP (2010) Aerodynamic Efficiency Study under the Influence of Heavy Rain via Two-Phase Flow Approach. 27th International Congress of the Aeronautical Sciences, Republic of China.
- Wan T, Chou CJ (2012) Reinvestigation of High Lift Airfoil under the Influence of Heavy Rain Effects. 50th AIAA Aerospace Science Meeting including the New Horizons Forum and Aerospace Exposition, Nashville, Tennessee.
- Wan T, Song BC (2012) Aerodynamic Performance Study of a Modern Blended-Wing-Body Aircraft under Severe Weather Simulation. 50th AIAA Aerospace Science Meeting including the New Horizons Forum and Aerospace Exposition, Nashville, Tennessee.
- Zhang RM, Cao YH (2010) Study of Aerodynamic Characteristics of an Airfoil in Rain. Journal of Aerospace Power 25: 2064-2069.
- M Ismail, Cao Yihua, Zhao Ming, et al. (2012) Numerical Study of Airfoils Aerodynamic Performance in Heavy Rain Environment. World Academy of Science Engineering and Technology 7: 1053-1060.
- M Ismail, Cao Yihua, A Bakar, et al. (2013) Aerodynamic Efficiency Study of 2D Airfoils and 3D Rectangular Wing in Heavy Rain via Two-Phase Flow Approach. Proceedings of the Institution of Mechanical Engineering Part G: Journal of Aerospace Engineering.
- Zhenlong Wu, Yihua Cao, M Ismail (2013) Numerical Simulation of Airfoil Aerodynamic Penalties and Mechanisms in Heavy Rain. International Journal of Aerospace Engineering.
- http://download.csdn.net/detail/xiaofengqing/1412390.
- Spalart P, Allmaras S (1992) One equation model for aerodynamic flows. In: AIAA 92-0439, 30th AIAA Aerospace Science Meeting & Exhibit, Reno, Nevada, USA.
- C BEST (1950) The size distribution of raindrops. Quarterly Journal of the Royal Meteorological Society 16-36.
- Carlton W Ulbrich (1983) Natural Variations in the Analytical Form of the Raindrop Size Distribution. Journal of Climate and Applied Meteorology 1764-1774.
- Marshall JS, Palmer W McK (1948) The Distribution of Raindrops with Size. Journal of Meteorology 5: 165-166.
- Joss J, Waldvogel A (1969) Raindrop Size Distribution and Sampling Size Errors. Journal of the Atmospheric Sciences 26: 566-569.
- Markowitz Allan H (1976) Raindrop Size Distribution Expressions. Journal of Applied Meteorology 15: 1029-1031.
- Mundo M Sommerfeld, C Tropea (1995) Droplet-Wall Collisions: Experimental Studies of the Deformation and Breakup Process. International Journal of Multiphase Flow 21: 151-173.
- Dale H, Michael M, Karine LN, et al. (2000) DHC-6 Twin Otter Tailplane Airfoil Section Testing in the Ohio State University 7x10 Wind Tunnel. United States.
Corresponding Author
Zhenlong Wu, School of Aeronautic Science and Engineering, Beihang University, Beijing, People's Republic of China, China.
Copyright
© 2017 Benyin L, et al. This is an open-access article distributed under the terms of the Creative Commons Attribution License, which permits unrestricted use, distribution, and reproduction in any medium, provided the original author and source are credited.