Candidates with an Initial Estimated Post Transplant Survival (EPTS) Score > 90% Were Less Likely to Receive Kidney Transplant Mainly due to Very Low Rate of Living Donor Kidney Transplant
Abstract
Background
The new kidney allocation system (KAS) and the Estimated Post Transplant Survival (EPTS) score were introduced in the United States. The transplant rate among very high EPTS candidates (> 90%) may be impacted by lack of KAS priority and geographic factors based on the location of the listed Organ Procurement Organization (OPO).
Methods
The Organ Procurement Transplantation Network/United Network for Organ Sharing (OPTN/UNOS) data of newly listed first-time transplant candidates from 2015-2018 were included. Individuals listed for multiple organs, at multiple centers, and age < 18 years were excluded.
Results
A total of 114,870 candidates were included. Candidates with EPTS > 90% (9.74%) had a lower rate of overall transplant compared with EPTS ≤ 90% (13.6 vs. 26.6 /100 patient-years, p < 0.0001), lower rate of deceased donor kidney transplant (11.9 vs. 16.2/100 patient-years, p < 0.0001) and lower rate of living donor kidney transplant (LDKT) (1.7 vs. 10.4/100 patient-years, p < 0.0001). Overall median waiting time to transplant was 444 days compared to 1,025 days in those with EPTS > 90% (p < 0.001).
Conclusions
Candidates with EPTS > 90% had a longer median waiting time compared to total waitlisted in all but one OPO. Median waiting times were heavily influenced by the lower overall rate of kidney transplantation and LDKT in this group.
Keywords
Kidney transplant, Waiting time, EPTS > 90%
Introduction
In 2019, a total of 23,401 kidney transplants were performed in the United States, representing a 10.6% increase from the year prior (Base on The Organ Procurement Transplantation Network; OPTN data as of April 1, 2020). Despite this increase in kidney transplantation, approximately 102,000 candidates remained on the waiting list (Base on OPTN data as of June 3, 2020). The median waiting time to kidney transplant (deceased or living donor) was 3.4 years for first-time listed candidates and 4.3 years for repeat transplant candidates from United States Renal Data System (USRDS) latest report in 2009 [1]. However, waiting times are subject to large variances depending on where a candidate is waitlisted geographically [2,3]. Currently, the Organ Procurement Organizations (OPOs) facilitate all organ donation and allocation in their geographic local donor service areas. A candidates' position in the waitlist is predominantly influenced by their waiting time, blood type and calculated panel reactive antibody (PRA) score with exceptions for pediatric, multiorgan, and highly sensitized candidates.
In December 2014, the new kidney allocation system (KAS) was implemented in the United States. One of the main goals of the system was to increase allograft life-years of kidneys recovered for transplantation by prioritizing high quality organs to candidates with longer predicted survival. To achieve this goal the concept of "longevity matching", the Kidney Donor Profile Index (KDPI) and Estimated Post Transplant Survival (EPTS) were introduced. Every deceased donor kidney receives a KDPI score, which assesses deceased donor quality based on several variables. The KDPI score ranges from 0% to 100%, with lower scores predicting better graft survival. Additionally, each transplant candidate receives an EPTS score which incorporates their age, duration of dialysis, current diagnosis of diabetes and prior solid organ transplant status. The EPTS score ranges from 0% to 100%, with lower scores predicting longer survival. These two scores are used in the KAS to allocate organs to recipients. Candidates with EPTS score ≤ 20% receive additional allocation priority for kidneys with KDPI score ≤ 20% [4,5]
It has been shown that increased age is associated with reduced transplantation rates and higher waitlist mortality [6,7]. However, there is limited data regarding the outcomes of waitlisted candidates with an EPTS > 90%, which includes additional variables beyond age of the candidate, and association with geographic listing area. By definition, this group of transplant candidates possess medical characteristics which reduce their post-transplant survival and may contribute to accumulation of comorbidities on the waiting list which result in death or delisting. Under the current KAS, candidates with an EPTS > 20% receive no additional allocation consideration [5], which may increase waiting time in a group at increased risk. Furthermore, despite extensive changes to kidney allocation under new KAS, limited changes were made to address geographic disparities and geography remains a primary determinant of access to deceased donor kidney transplant (DDKT) [8].
Here we study the impact of new KAS, and geographic factors based on the location of the listed OPO among the candidates with EPTS > 90%. We hypothesize that the transplant rate and waiting time among very high EPTS candidates may be negatively impacted by lack of KAS priority and waitlisted OPO.
Materials and Methods
Data source and study population
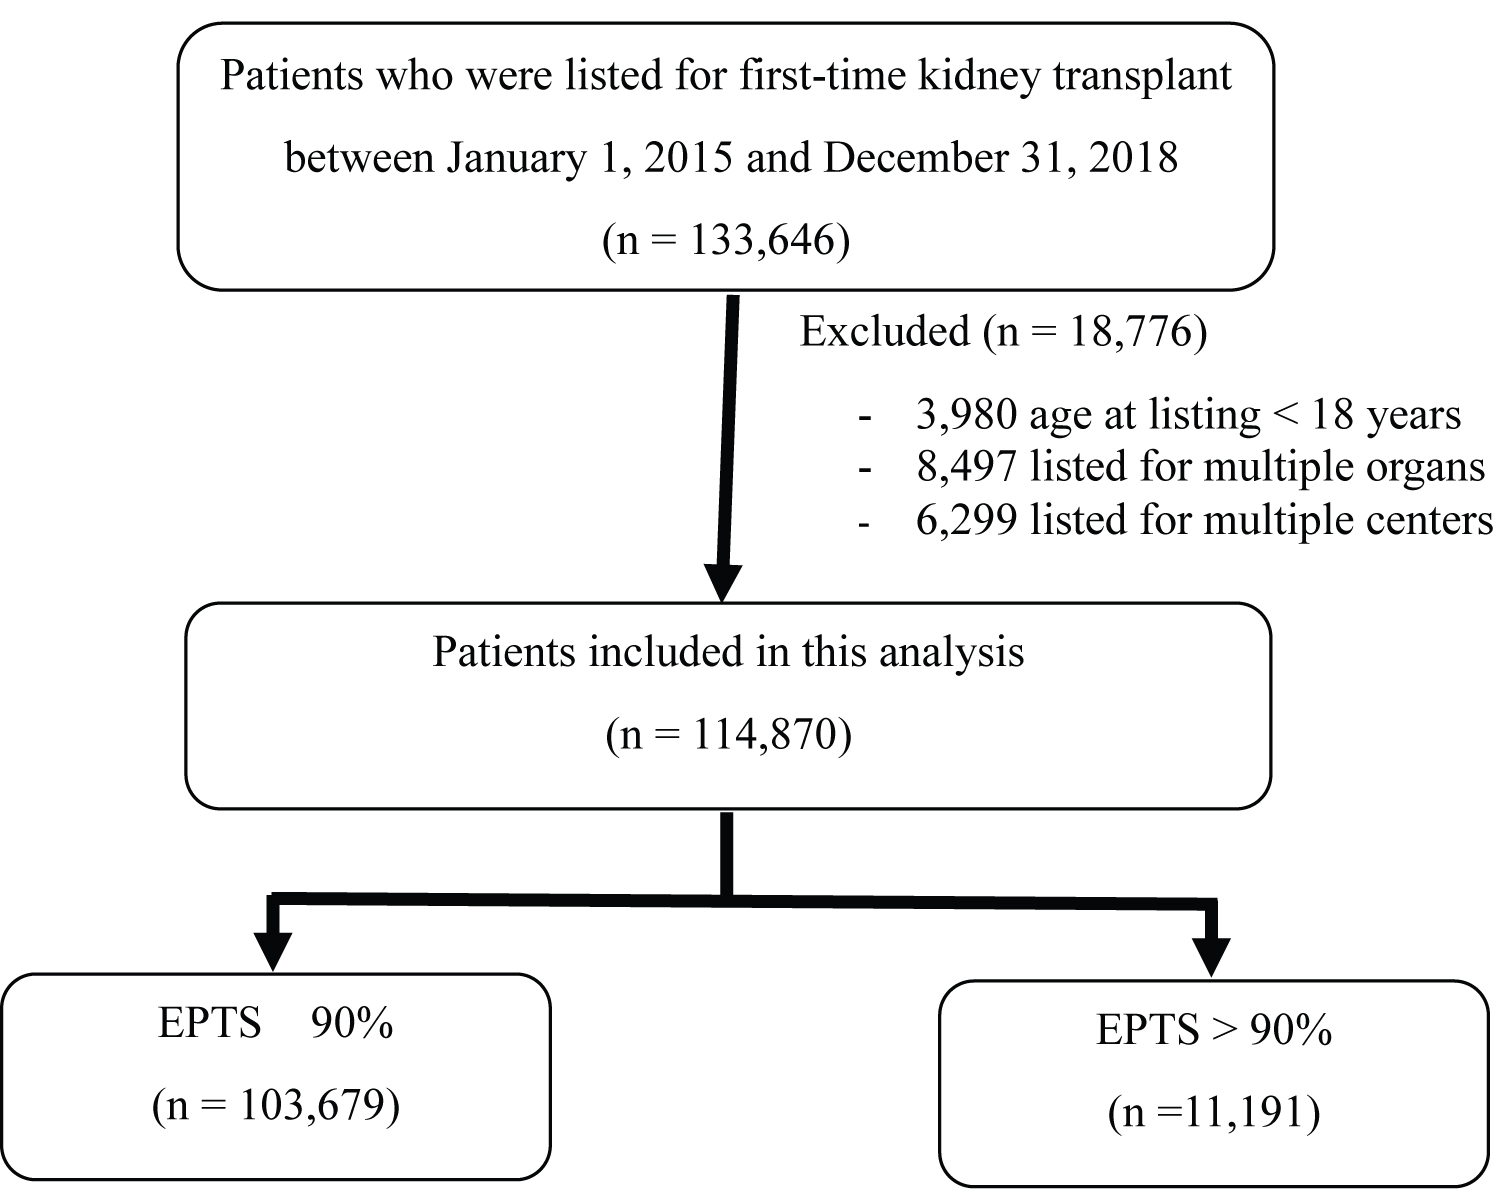
The Organ Procurement Transplantation Network/United Network for Organ Sharing (OPTN/UNOS) database as of March 20, 2020 was used in this study. All newly listed first-time kidney transplant candidates from January 1, 2015 to December 31, 2018 were included. Individuals listed for multiple organs, at multiple centers, and age at listing < 18 years were excluded. Flow chart of study inclusion is shown in Figure 1. This study was institutional review board exempt due to its use of publicly available data and absence of identification of individual candidates.
Patient characteristics including age at initial listing, gender, ethnicity, ABO blood group, diabetes status, dialysis vintage, peak PRA, primary payment, maximum acceptable human leukocyte antigen (HLA) and KDPI were collected. We categorized our study population into two groups according to EPTS score; 1) Candidates with EPTS ≤ 90% and 2) Candidates with EPTS > 90%.
Outcome measures
The study population were analyzed to determine the impact of very high EPTS (EPTS > 90%), and geographic factors based on the location of the listed OPOs on waitlist candidates' outcomes. The primary outcome was median waiting time to kidney transplant among candidates with initial EPTS > 90% based on the listed OPOs. Secondary outcomes were kidney transplant rates, death rates and delisting rates among candidates with EPTS > 90% compared to those with EPTS ≤ 90%.
Statistical analysis
Waitlist characteristics were analyzed by using median, range and interquartile range (IQR) for continuous variables, and using proportion for categorical variables. Group differences were compared using Kruskal-Wallis or Pearson's chi-squared test as appropriate. Median waiting time to transplant was calculated as the time after a candidate was initially listed until 50% of all candidates had been removed from the list due to undergoing transplant. This study included both deceased and living donor kidney transplant in the waitlist candidates' outcomes. A Kaplan-Meier model was used with censoring for 1. Candidates still waiting on March 20, 2020; and 2. Candidates removed from the list due to renal recovery which not indicated for transplantation. Candidates which were dead or removed from the list due to deteriorated medical status were considered for remaining not undergone transplant waitlist and included in the calculation. The model also included time during a candidate were in temporary inactive status [9]. The longest possible observation time in this analysis was 1,905 days (from January 1, 2015 to March 20, 2020).
Actual kidney transplant rates, death rates and delisting rates were represented as rates per 100 patient-years at risk. The different rates between study groups were compared by "test-based method" [10]. Due to the presence of competing events, the cumulative incidence function (CIF) was used to estimate the cumulative probability of events over time. Univariate cox-proportional hazards model and competing risks regression model (Fine-Gray) were used to calculate hazard ratios (HR) and subdistribution hazard ratios (SHR), respectively. In the multivariate model, we adjusted for candidates' age at initial listing, gender, ethnicity, ABO blood group, PRA, and primary payment. HLA mismatches were also used in multivariate model among candidates who received kidney transplant. All reported p -values were two tailed and p-values < 0.05 were considered significant. STATA version 13 (Statacorp, College Station, Tx) was used in all statistical analysis.
Results
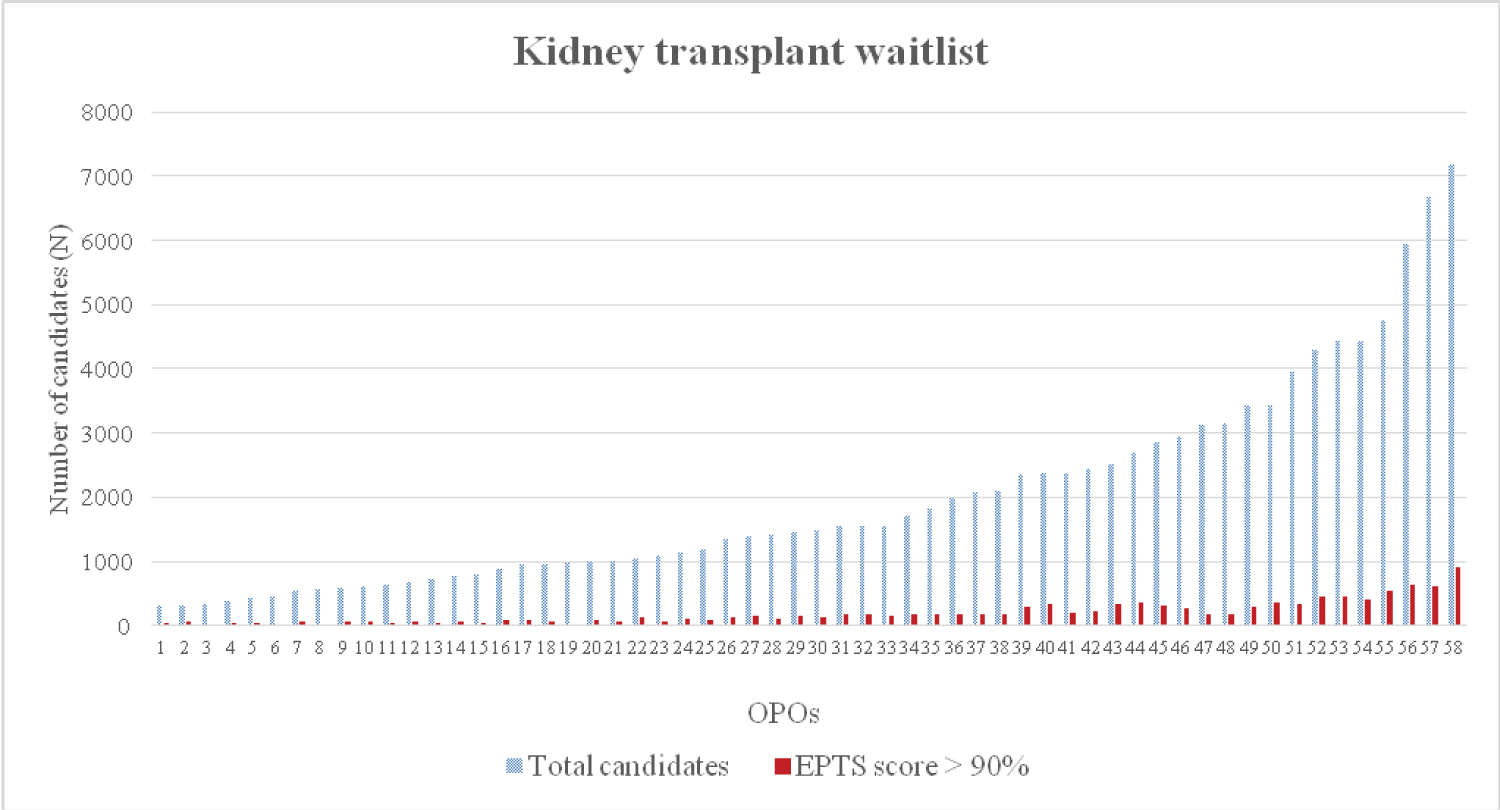
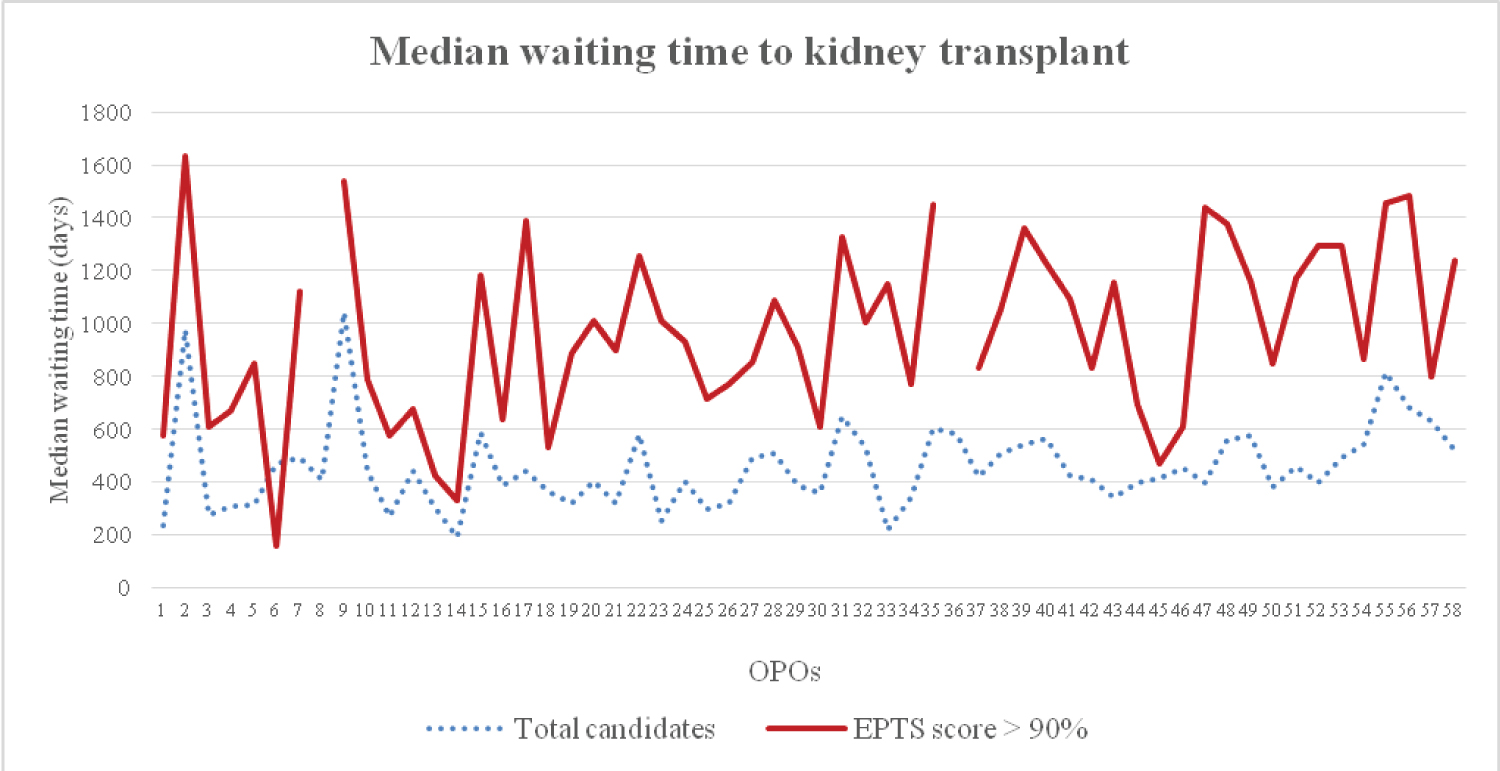
A total of 114,870 kidney transplant candidates were included in this study. Among these, 11,191 (9.74%) candidates had EPTS > 90%. Median observation time was 576 (0 - 1,904) days. Waitlist candidates' characteristics were shown in Table 1. Candidates with EPTS > 90% were more likely to have an older age at time of listing, male gender, diabetes, a longer dialysis vintage and public insurance as a primary payment compared to candidates with EPTS ≤ 90%. Additionally, they were less likely to be preemptive listed for transplantation. According to 58 OPOs, the number of waitlisted candidates ranged from 299 - 7,171 (0.26% - 6.24% of the whole country waitlist). There were 12 - 905 candidates with EPTS > 90% (2.15% - 16.19% of the total candidates among OPOs) (Figure 2). Candidates with EPTS > 90% had a significantly longer median waiting time to transplant compared to total candidates (1,025 vs. 444 days, p < 0.001). Among OPOs, overall median waiting time to transplant range from 188 -1,042 days compared to 160 -1,633 days in those with EPTS > 90%. Candidates with EPTS > 90% had a longer median waiting time compared to total waitlisted in all but one OPO (Figure 3). The missing median waiting time in candidates with EPTS > 90% among 2 OPOs indicated that less than 50% of candidates had undergone transplantation during the follow up period.
Table 2 shows characteristics of candidates with EPTS > 90% who received kidney transplant compared to who did not received kidney transplant. There were statistically significant differences between transplanted compared with non-transplanted groups. Candidates whose undergone transplant were older at time of listing (68 years vs. 67 years) and had higher proportion of blood group A and AB (36.34% vs. 28.56%) and (5.57% vs. 2.35%), respectively. Candidates who received kidney transplant had a significant longer dialysis vintage prior to listing (948 days vs. 484 days, p = 0.0001) with 44.77% of those having a dialysis vintage of more than 3 years. A lower degree of sensitization by PRA was observed in transplanted candidates (zero PRA 69.23% vs. 64.40%, p < 0.001) compared to those who did not received a kidney transplant. There was a lower proportion of transplanted candidates who accepted 6 HLA mismatch (96.93% vs. 97.64%, p < 0.001) while there was no difference of proportion of candidates who accepted KDPI > 85% (99.15% vs. 99.29%, p = 0.40).
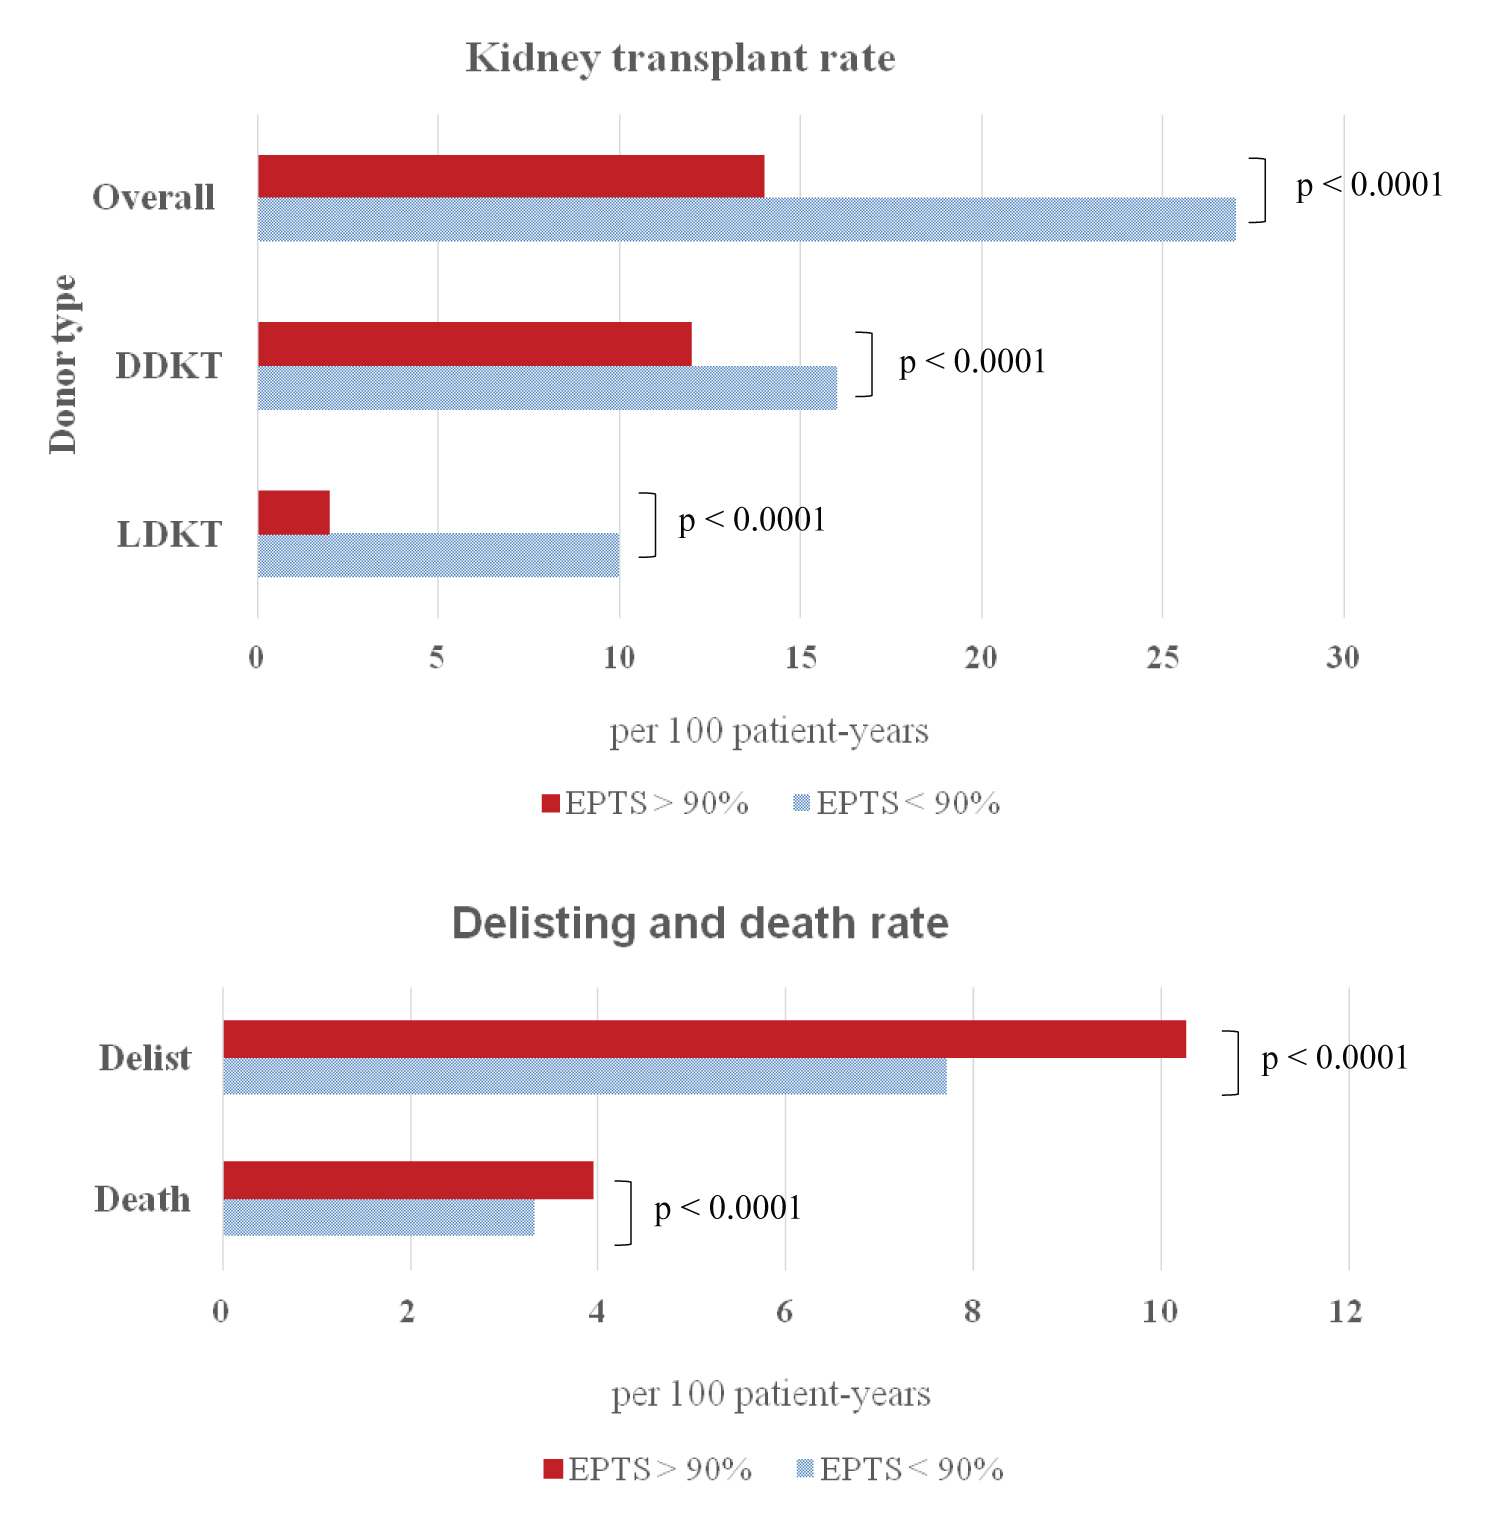
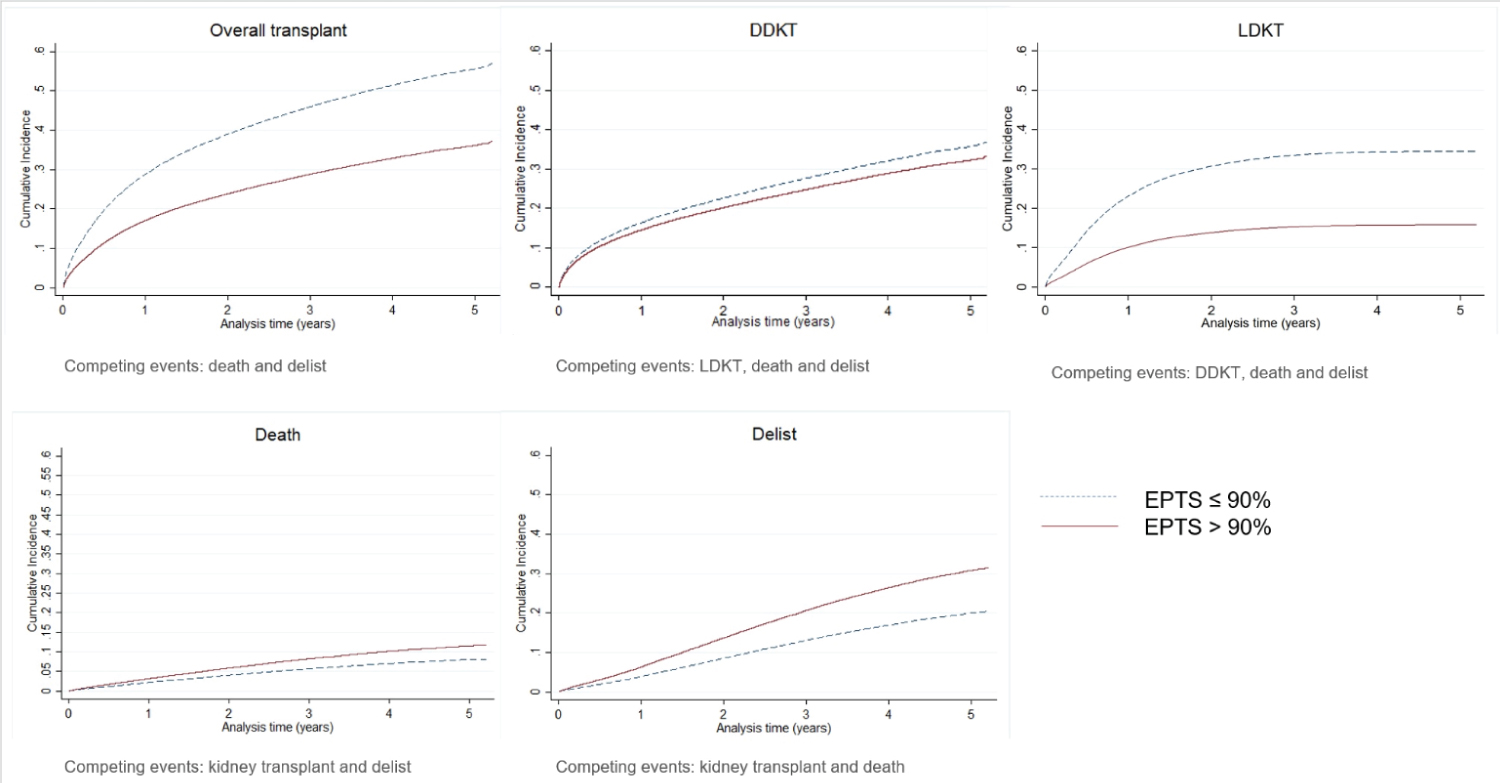
Amongst all waitlisted candidates, a kidney transplant rate of 25.05 per 100 patient-years, death rate of 3.40 per 100 patient-years, and delisting rate of 8.03 per 100 patient-years were observed. Candidates with EPTS > 90% had a lower rate of transplantation compared with EPTS ≤ 90% (13.60 VS. 26.64 per 100 patient-years, p < 0.0001), lower rate of DDKT (11.86 vs. 16.21 per 100 patient-years, p < 0.0001), lower rate living donor transplant (LDKT) (1.74 vs. 10.43 per 100 patient-years, p < 0.0001), higher death rate (3.96 vs. 3.32 per 100 patient-years , p < 0.0001) and higher delisting rate (10.27 vs. 7.72 per 100 patient-years, p < 0.0001) (Figure 4). Figure 5 shows the cumulative incidence of overall kidney transplant, DDKT, LDKT, death and delist derived by CIF comparing between candidates with EPTS > 90% and ≤ 90%. At 5.2 years, the cumulative incidence of kidney transplant is 37% vs. 57%, DDKT 34% vs. 37%, LDKT 16% vs. 35%, death 12% vs. 7% and delist 32% vs. 21%, respectively.
Using cox-proportional hazards model, candidates with EPTS > 90% are associated with a decreased chance to received kidney transplant among those who are still alive, do not removed from waitlist and do not yet received kidney transplant (adjusted HR 0.76, 95% CI 0.73-0.79). The lower chance includes both DDKT and LDKT (adjusted HR 0.89, 95% CI 0.86-0.93 and adjusted HR 0.35, 95% CI 0.32-0.39, respectively). Candidates with EPTS > 90% are associated with a decreased mortality risk (adjusted HR 0.75, 95% CI 0.70-0.82) but not associated an increased risk for delisting (adjusted HR 1.03, 95% CI 0.98-1.08). Using competing risks regression model, candidates with EPTS > 90% are associated with a decreased chance to received kidney transplant among those who have not yet received a transplant or have already died/delisted without transplant (adjusted SHR 0.62, 95% CI 0.60 - 0.65). While candidates with EPTS > 90% have a lower chance to received LDKT (adjusted SHR 0.41, 95% CI 0.37-0.45), the remaining candidates will have a higher chance to received DDKT compared to candidates with EPTS ≤ 90% (adjusted SHR 1.26 95% CI 1.22-1.31). Candidates with EPTS > 90% are also associated with an increased risk for delisting (adjusted SHR 1.38, 95% CI 1.32-1.44) among those who have not yet delisted or have already received transplant/died. Candidates with EPTS > 90% are not associated with an increased mortality risk (adjusted SHR 0.98, 95% CI 0.91-1.05) among those who are still alive or have already received transplant/delisted. (Table 3). These SHR representing a ratio in non-existing population including candidates who experienced the competing events, this may less appropriate than cox-regression analyses [11,12].
Discussion
Under the current KAS, we demonstrated that kidney transplant candidates with an initial EPTS > 90% at the time of listing had a significantly longer median waiting time to transplant compared to overall candidates at their corresponding OPO (1,025 vs. 444 days, p < 0.001). This is true in all but one OPO. The difference in waiting time varied highly depending on the geographic location of the transplant candidates. A major potential consequence of a longer waiting time is the deterioration in health resulting in death or removal from the transplant waiting list of previously qualified individuals. A previous study showed that candidates with EPTS > 90% who did not receive kidney transplant had 3-year survival only 41% after listing [13]. We also demonstrated that candidates with EPTS > 90% had a higher death rate and delisting rate while awaiting for transplantation. Candidates with an EPTS > 90% carry immutable factors which may place them at a higher risk for these adverse outcomes. The most important finding in this study is candidates with an initial EPTS > 90% compared to candidates with EPTS ≤ 90% have a much lower rate of kidney transplant (13.6 vs. 26.6 /100 patient-years, p < 0.0001) especially a lower rate of LDKT (1.7 vs. 10.4 /100 patient-years, p < 0.0001). This can be in part address by the increase in LDKT.
Amongst candidates with an EPTS > 90%, there was a significantly longer median waiting time to kidney transplantation compared to overall candidates in all but one OPO. Longer waiting time was not correlated with number of total candidates or proportion of candidates who had EPTS > 90% among OPOs. Longer median waiting time among these very high EPTS was due to a significantly lower rate of transplantation especially LDKT compared with candidates with EPTS ≤ 90%. Because candidates removed from the waitlist or die without receiving kidney transplant decrease number of patients at risk and not included in the calculation of waiting time, median waiting time calculated by using Kaplan-Meier method is always shorter than actual median waiting time [14]. Importantly, candidates with EPTS > 90% which have a high delisting and death rate will have a much longer actual median waiting time than demonstrated. From the competing risk analysis using death and delisting as competing events, only 37% of candidates with EPTS > 90% received kidney transplant during the observation time (median observation 19 months). Achieving 50% transplantation to calculate the actual median waiting time needs the longer observation.
Our analysis shows that among candidates with EPTS > 90% who received kidney transplant were more likely to be older, blood group A or AB, with a longer dialysis vintage and a lower PRA at the time of listing compared to those who did not received kidney transplant. This is consistent with previous data demonstrating that candidates with blood group O or B and previously sensitized have a longer waiting time [15].
We demonstrated that very high EPTS is associated with a lower likelihood of receiving a transplant, longer waiting time to receive a kidney transplant, and higher rate of adverse events while on the waitlist. These findings were consistent across already present geographical differences in kidney transplantation in the United States [8,16]. In the backdrop of an ongoing organ shortage, diversion of a higher quality organ away from individuals with a lower expected post transplantation survival to individuals with a higher expected survival achieves one of the primary goals of the KAS. However, in a group that already carries significant comorbidities, doubling of the waiting time for a transplant results in either death or removal from the waiting list.
Earlier transplantation in this group will likely result in improved outcomes. We found that in very high EPTS candidate, living donation rates were significantly lower. Increasing LDKT among these candidates would significantly shortening waiting time and provide a high-quality organ, with data indicating a 3-year survival of 94% [13]. Living donation may be lower in this group given the medical comorbidities, but advanced age of potential donors, and resistance of the recipient to take a kidney from a younger relative may also contribute to this reduced rate of LDKT. We also saw that a significant proportion (80.59%) of very high EPTS candidates had public insurance, which has also been shown to be associated with reduced LDKT. Clearly a multifaceted approach will be needed to increase living donation rates in this group.
A significant lower rate of DDKT among candidates with EPTS > 90% compared to candidates with EPTS ≤ 90% was also observed (11.9 vs. 16.2 /100 patient-years, respectively, p < 0.0001), which may also contribute to the increase in waiting time for transplantation in very high ETPS candidates. We demonstrated that post KAS geographic differences in transplantation remain. This is not surprising given that the KAS did not address geographic disparities. Introduction of a new system based on distance from donor hospital may improve geographic disparities in access to transplantation. However, many other factors influence candidates' chance at receiving a DDKT including: the candidate's health status beyond EPTS measurements, organ transplant logistics, and a program's organ acceptance behavior. Candidates listed at centers that are more conservative on their organ assessment are more likely to refuse offers [17]. Various approaches will be needed to improve the transplant rate in very high EPTS group. A comprehensive assessment of barriers to donor acceptance patterns at all levels will be necessary to reduce waiting time and adverse waiting list outcomes for very high EPTS candidates.
As a nature of retrospective database study, there are some limitations in our study. First, there were more than 50% missing data on candidates' causes of death. We cannot conclude that candidates with very high EPTS die from comorbid diseases and complications. Second, we included only candidates that were first-time listed for "kidney only" transplant, at one center, and age at listing ≥ 18 years. Results may not be generalized to all waitlist candidates.
In conclusion, this is the first study demonstrating kidney transplant candidates with an EPTS > 90% are much less likely to have LDKT compared to candidates with EPTS ≤ 90%, which is the major contribute to a longer median waiting times from initial listing to kidney transplant. This is highly dependent on the geographic location of the candidate. Candidates with very high EPTS were more likely to die or be removed from the waiting list, highlighting the need for earlier transplantation in this group. Additional considerations are needed to reduce the waiting time for transplantation emphasize on increasing LDKT among very high EPTS candidates who were qualified for a transplant at the time of listing.
Authorship
Authorship contributions
Piyavadee Homkrailas, participated in the research design, performed the data analysis and interpretation, and the writing of paper (drafting and critical revision of article).
Erik L. Lum, participated in the writing of paper (drafting and critical revision of article).
Nakul Datta, participated in the writing of paper (drafting of article).
Suphamai Bunnapradist, participated in the research design, performed the data analysis and interpretation, the performance of the research, critical revision of the article and contributed to the writing of paper.
Disclosure
The authors declare no conflicts of interest.
Funding Source
None.
Acknowledgement
"This work was supported in part by Health Resources and Services Administration contract 234-2005-37011C. The content is the responsibility of the authors alone and does not necessarily reflect the views or policies of the Department of Health and Human Services, nor does mention of trade names, commercial products, or organizations imply endorsement by the U.S. Government."
References
- Saran R, Robinson B, Abbott KC, et al. (2017) US Renal data system 2016 annual data report: Epidemiology of kidney disease in the United States. Am J Kidney Dis 69: A7-A8.
- Davis AE, Mehrotra S, Kilambi V, et al. (2014) The effect of the statewide sharing variance on geographic disparity in kidney transplantation in the United States. Clin J Am Soc Nephrol 9: 1449-1460.
- Davis AE, Mehrotra S, McElroy LM, et al. (2014) The extent and predictors of waiting time geographic disparity in kidney transplantation in the United States. Transplantation 97: 1049-1057.
- OPTN (2020) A guide to calculating and interpreting the kidney donor profile index (KDPI).
- OPTN (2020) A guide to calculating and interpreting the estimated post-transplant survival (EPTS) score used in the kidney allocation system (KAS).
- Danovitch G, Savransky E (2006) Challenges in the counseling and management of older kidney transplant candidates. Am J Kidney Dis 47: S86-S97.
- Hernández D, Alonso-Titos J, Armas-Padrón AM, et al. (2018) Mortality in elderly waiting-list patients versus age-matched kidney transplant recipients: Where is the risk? Kidney Blood Press Res 43: 256-275.
- Zhou S, Massie AB, Luo X, et al. (2018) Geographic disparity in kidney transplantation under KAS. Am J Transplant 18: 1415-1423.
- Scientific Registry of Transplant Recipients (2020) Technical methods for the program-specific reports.
- Sahai H, Khurshid A (1996) Statistics in epidemiology: methods, techniques, and applications. (1st edn), CRC Press.
- Noordzij M, Leffondré K, van Stralen KJ, et al. (2013) When do we need competing risks methods for survival analysis in nephrology? Nephrol Dial Transplant 28: 2670-2677.
- Schuster NA, Hoogendijk EO, Kok AAL, et al. (2020) Ignoring competing events in the analysis of survival data may lead to biased results: A nonmathematical illustration of competing risk analysis. J Clin Epidemiol. 122: 42-48.
- Sampaio MS, Lum E, Homkrailas P, et al. (2020) Survival of ESRD patients with an EPTS > 90% listed for kidney transplant. Am J Transplant 20 (suppl 3).
- Hart A, Salkowski N, Snyder JJ, et al. (2016) Beyond "median waiting time": development and validation of a competing risk model to predict outcomes on the kidney transplant waiting list. Transplantation 100: 1564-1570.
- Stewart DE, Klassen DK (2017) Early experience with the new kidney allocation system: A perspective from UNOS. Clin J Am Soc Nephrol 12: 2063-2065.
- Davis AE, Mehrotra S, Ladner DP, et al. (2014) Changes in geographic disparity in kidney transplantation since the final rule. Transplantation 98: 931-936.
- Husain SA, King KL, Pastan S, et al. (2019) Association between declined offers of deceased donor kidney allograft and outcomes in kidney transplant candidates. JAMA Netw Open.
Corresponding Author
Suphamai Bunnapradist MD, MS, Division of Nephrology, Department of Medicine, Kidney and Pancreas Transplant Research Center, David Geffen School of Medicine at UCLA, 1015 Gayley Ave, Suite 220, Los Angeles, CA 90024, USA.
Copyright
© 2020 Homkrailas P, et al. This is an open-access article distributed under the terms of the Creative Commons Attribution License, which permits unrestricted use, distribution, and reproduction in any medium, provided the original author and source are credited.