Transhemispheric Diaschisis after Unilateral Focal Cerebral Ischemia Reperfusion: A Longitudinal Voxel-Based Study by MRI
Abstract
Background
It is now little doubt that the insult of ischemia/reperfusion (I/R) impacts cerebral blood flow (CBF) not only within the lesion area but also in the area beyond the lesion territory. Focal I/R has been shown to impact the CBF dynamics even in the non-ischemic hemisphere. However, the quantitative transhemispheric CBF dynamics and its relationship to tissue microstructure changes following I/R has not been investigated.
Objective
In this study, we aimed to investigate longitudinally transhemispheric dynamics of regional CBF and tissue reorganization following I/R and find the impact of time on cerebral hemispheric diaschisis.
Methods
Regional evolutions of infarct volume, CBF and water diffusion parameters of rat models of I/R (middle cerebral artery occlusion; 90 min ischemia and reperfusion) were measured in eight consecutive in vivo imaging sessions with magnetic resonance imaging for 21 days. Both individual and group longitudinal data were analyzed statistically using a non-parametric factorial method. The difference between the relative treatment effects of time on CBF recovery was investigated in hemispheric mirror anatomical regions of interest (ROIs).
Results
After I/R, significant transhemispheric changes in CBF (p < 0.05 at 48 and 72 h), as well as fractional anisotropy (p < 0.05 at 24 and 48 h) and mean diffusivity (p < 0.05 at 14 d) were observed. We observed a variable longitudinal effect of time on CBF for all of the studied ROIs (p < 0.001). The relative effect of time on CBF recovery in hemispheric mirror ROIs was significantly different at early times following reperfusion (cortical; p < 0.05 and p < 0.01 at 12, 24 h respectively, subcortical; p < 0.01 at 12, 24, 72 h) compared to later times (7 d, 14 d, and 21 d).
Conclusions
The presence of a dynamic transhemispheric CBF and diffusion parameters are suggestive of important roles for transhemispheric plasticity following the insult of focal I/R.
Keywords
Acute stroke, Cerebral blood flow, Edema, Magnetic resonance imaging, Perfusion/Diffusion imaging, Transhemispheric diaschisis, Focal ischemia
Introduction
In a normal brain, autoregulation mechanisms tightly regulate cerebral blood flow (CBF) to adequately perfuse the brain [1]. A regional disruption of CBF, as it happens by a thrombus or embolism, perturbs hemispheric CBF [2] that leads to cerebral hemodynamics disruption [3]. This initiates focal ischemia that can lead to cerebral infarction, with ischemic core and the penumbra [4]. Restoration of CBF to the ischemic core (ischemia/reperfusion, I/R) yet remains the only effective strategy to recover viable tissues and limit ischemic injury [5]. This I/R further impacts CBF dynamics not only in the penumbra but also in remote anatomical areas that may initiate further oxidative damage in core and penumbra even in anatomical areas beyond lesion neighboring area [6].
I/R causes abrupt changes in CBF which directly affects cerebral perfusion pressure (CPP) [7]. Cerebral perfusion pressure (CPP) is the net pressure gradient that is sensed by endothelial cells. Endothelial cells, an important element of CBF autoregulation mechanisms, in both affected and unaffected hemispheres respond to CPP changes by contracting or dilating vessels [2]. This has been established by observing the bilateral failure of cerebral autoregulation in patients who developed delayed cerebral ischemia [8]. Moreover, both ischemic insult and any drastic changes in CPP alter the homeostasis of water compartments by vasogenic and/or cytotoxic edema [9]. Regardless of its pathogenesis edema, in general, hinders free diffusion of water molecules and complicates CBF [10]. This is not a reciprocal relationship, as the alteration of contralateral regional (r)CBF without a significant presence of edema has been reported [11].
Following focal I/R, opposite changes in water free diffusion parameters of cerebral hemispheres have been observed by using MR diffusion imaging techniques [12]. However, it is not clear if this opposite change has any connection with emergent rCBF interhemispheric dynamic differences. The role for longitudinal differences in hemispheric hemodynamics in predicting the recovery of ischemia has been recognized [13]. Other studies also, indicate that understanding the temporal evolution of cerebral hemodynamic and functional shock of intact regions, as well as dynamic diaschisis during and after I/R, maybe sensitive enough in predicting brain viability responses and treatment planning [14,15]. Furthermore, diaschisis ipsilateral to stroke in cortical gray matter characterized by changes in rCBF [16] as well as functional alteration as revealed by changes in GABAergic transmission and GABAA receptor subunit [17]. These pieces of evidence point to a clinical meaning of transhemispheric changes in hemodynamics parameters. However, there is no longitudinal data or longitudinal analyses of transhemispheric diaschisis evolution after the insult of focal I/R.
With advances in non-invasive ultra-high field MRI, it becomes possible to capture changes in cerebral perfusion and diffusion with high temporal and spatial resolutions [18]. As such, we aimed to assess the evolution of transhemispheric diaschisis by using arterial spin labeling (ASL) [19] and diffusion tensor imaging (DTI) [20] techniques in a rat model of focal cerebral I/R. ASL is proving to be a powerful and reliable method in the study of regional CBF [21].On the other hand, DTI has emerged as a promising technique to examine WM integrity [22] and changes in water compartments because of vasogenic or cytotoxic edema [23]. In addition, we aimed to investigate the relative ipsilateral diaschisis at different times on the evolution of the ischemic brain and balancing role of the contralateral hemisphere in recovering CBF following I/R.
Materials and Methods
Rats
Thirty-six male Wistar-Kyoto rats (280-310 g, Charles River Laboratory) were randomly assigned into two groups per each time point: (1) Control (n = 6), and (2) MCAo group (n = 30). These numbers were selected based on our previous experiments with this stroke model to attain the statistical power of 0.80 or greater. All rats received ad libitum food and water (Harlan, Indianapolis, IN, USA). Procedures were conducted in accordance with the "Guide for the Care and Use of Laboratory Rats" (Institute of Laboratory Animal Resources on Life Sciences, National Research Council, 2011) and approved by the IACUC of the University of South Florida. Twenty MCAo rats survived to the end of all imaging sessions. At the end of the experiment, all rats were euthanized according to the standard approved protocol.
Inclusions and exclusions
For all rats used in this study, successful MCAo was confirmed prior to MR imaging by Laser Doppler Flowmetry (LDF; Moor Instruments, Wilmington, DE) [24]. Rats were included in this study if, during ischemia, LDF regional CBF dropped below 15.4 ± 1.8% of the pre-ischemic level or if post-reperfusion CBF rebounded to 90.5 ± 3.6% of the pre-ischemic level. Rats were also excluded from this study if their body weight dropped below 30% of their pre-MCAo weight.
Middle cerebral artery occlusion (MCAo)/reperfusion
MCAo was performed following an intraluminal filament model as previously described [25], and reperfusion was completed after 90 min of occlusion by the gentle withdrawal of the suture. Sham animals (controls) underwent neck surgery in which a suture was simply inserted then removed. The same surgeon has performed all surgeries (ST). Within surgery, 3-4.0% isoflurane was used for induction and 2.0% for maintenance. Vital signs (core body temperature, as well as heart and respiratory rate) were monitored, and core body temperature was controlled during surgery and while in MR bore using an SAII Monitoring System (Model 1025, Small Animal Instruments, Inc. Stony Brook, NY).
NeuroImaging
MR imaging was performed with 7T BioSpec MR Scanner (Bruker Biospin, Ettlingen, Germany), equipped with 500 mT/m (rise time 80-120 µs) gradient set (for performing high-resolution small animal imaging), a small bore linear RF coil (internal diameter 119 mm) as the RF transmitter, and a 4-channel surface array coil as the RF receiver after reperfusion at 6, 12, 24, 48 hours, and 7, 14, and 21 days. These sampling times were selected because of their importance as milestones for ischemia evolution [25-27]. During MR imaging isoflurane gas was used for anesthesia with a lower possible dosage to minimize the effect of anesthesia on CBF (induction dosage 3-4% and maintenance dosage 1.5%-2%; controlled for a stable respiration rate and minimum motion), at 1 L/min compressed-air flow under spontaneous respiration throughout the entire course of each imaging session. Real-time monitoring of physiological parameters (heart rate, respiratory rate, and body temperature) was achieved during each imaging session for signs of distress (Small Animal Instruments Inc., Stony Brook, NY). Also while animal inside the magnet, the core body temperature was maintained stable with controlled-warm airflow.
MR imaging protocol for each imaging session included sequences for anatomical, diffusion, and perfusion imaging. High-resolution T2-weighted (T2w) anatomical images were acquired in the coronal plane centered 5 mm caudal from the posterior edge of the olfactory bulb using a RARE (Rapid Acquisition with Relaxation Enhancement) sequence (TR/TE 4000/65 ms, field of view (FOV) 3.7 cm × 3.7 cm, slice thickness 2 mm, slice gap 0.1 mm, contiguous slices 12, matrix 256 × 128, number of averages 5, and receiver bandwidth 250 kHz; Figure 1A). FOV of 3.7 cm × 3.7 cm and an acquisition matrix of 256 × 128 resulted in an image resolution of 0.145 × 0.296 × 2 mm3.
Mean water diffusion parameters in regions of interest (ROIs) were investigated based on DTI data. Acquisition of diffusion data was performed using DTI with echo-planar image acquisition (DTI-EPI) sequence; the same FOV and geometrical centers were used as for the anatomical image acquisition, but a smaller matrix size (128 × 128 and TR/TE 3800/44.7 ms, 30 diffusion per direction, number of averages 1, receiver bandwidth 250 kHz, d = 5 ms, D = 10 ms, and two b values of 0 and 1000 s mm-2). FOV of 3.7 cm × 3.7 cm and an acquisition matrix of 128 ×128 resulting in an image resolution of 0.296 × 0.296 × 2 mm3.
Regional CBF (rCBF) was quantified with continuous ASL (CASL) technique implemented by single-shot, gradient-echo, EPI acquisition (FAIR-EPI) [28-30]. The labeling pulse was a 1.78-s, square radiofrequency pulse in the presence of 1.0 G/cm gradient along the flow direction. The sign of the frequency offset was switched for non-labeled images (TR/TE 3300/29 ms, Number of TIR 24, FOV 3.7 cm × 3.7 cm, slice thickness 1 mm, slice gap 0.1 mm, number of slices 3 located at the center of the lesion, matrix 128 × 128 and number of averages 1).
Image processing
All raw diffusion and perfusion data were processed using the in-house developed MATLAB-based (Mathworks, Natick, MA) DTI and ASL software. Unless otherwise indicated, all images from each rat were co-registered by rigid body alignment to a standard template. Ischemic lesion volumes were determined based on T2w images with values above mean plus two standard deviations of contralateral measurements. Anatomically defined ROIs were manually traced on the template using a rat atlas [31] as a guide in Image. The ipsilateral hemisphere, contralateral hemisphere, ipsilateral cortex, contralateral cortex, ipsilateral subcortical area, and contralateral subcortical area were studied as ROIs. These ROIs were selected because of the high frequency of ischemic injury incidence in these areas, as well as relevant differences in their microvascular anatomy [32]. Corresponding contralateral ROIs were selected to mirror the damaged hemisphere ROIs and to investigate relative hemispheric changes. Quantitative hemispheric data were acquired by post-processing of voxel-based DTI and ASL data in these ROIs and their hemispheric mirror ROIs.
Post-processing of DTI data involved calculation of fractional anisotropy (FA) and mean diffusivity (MD) maps, while post-processing of ASL data involved calculation of voxel-based regional CBF. Regional CBF was calculated by fitting T1-selective and T1-nonselective values to the CASL equation [33]. Anatomical average of FA (unitless), MD (mm2/s) and rCBF (ml/100 g/min) values in mirror areas of each slice were calculated by averaging data in manually drawn ROIs and were represented as mean ± standard error of mean (SEM).
Statistical analysis
Data were subjected to both individual and group longitudinal statistical analysis for significances. Individual rCBF data were statistically analyzed for significance in longitudinal changes by using a non-parametric factorial analysis of variance (ANOVA). To investigate the impact of time on rCBF and its recovery we employed a longitudinal model and used the relative treatment effect (RTE) as a measure [34]. RTE has a value between 0 and 1 and in an ld-f1 longitudinal model [35] indicates the probability that a measurement in one condition at a given time point is larger than a value of this condition in any other combination of group and time. RTE of time was calculated for rCBF recovery at hemispherical mirror cortical and subcortical ROIs using R software (R core team 2017). Unless indicated, all other statistical comparisons between data sets were made based on the mean ± SEM representation. A two-tailed Student's t-test (parametric data) was used for the statistical analyses and the two-tailed p-value was considered statistically significant as p < 0.05.
Results
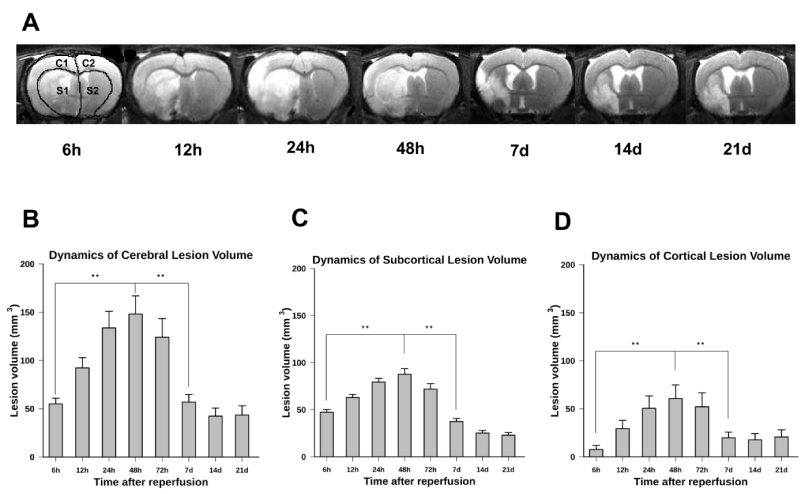
We have in vivo quantified the dynamics of cerebral ischemic lesion volume in both cortical and subcortical areas of the affected hemisphere in the MCAo model of I/R for 21 days following reperfusion (Figure 1). Representative examples of a coronal section of a rat brain indicating the dynamics of the ischemic lesion for seven consecutive measuring times are shown in Figure 1A. In this panel, the peak of ischemic lesion volume was at 48 h of reperfusion. This maximum was significantly different from its earlier volume at 6 h and 12 h (p < 0.01) as well as from its later values at 7 d, 14 d, and 21 d of reperfusion (p < 0.01). The evolution patterns of reperfusion injury at early time points after ischemia were the same in both the cortical and subcortical areas. Simple statistics of lesion volume, mean ± SEM, in three ROIs for seven measuring times, is shown in panels B, C, and D, respectively. As these panels show, the striatal lesion decreases by time until the end of the study while the cortical lesion decreases to its lowest value at the seventh day of reperfusion. The whole lesion volume reaches its maximum value at 48h after reperfusion and, afterward, continuously decreases.
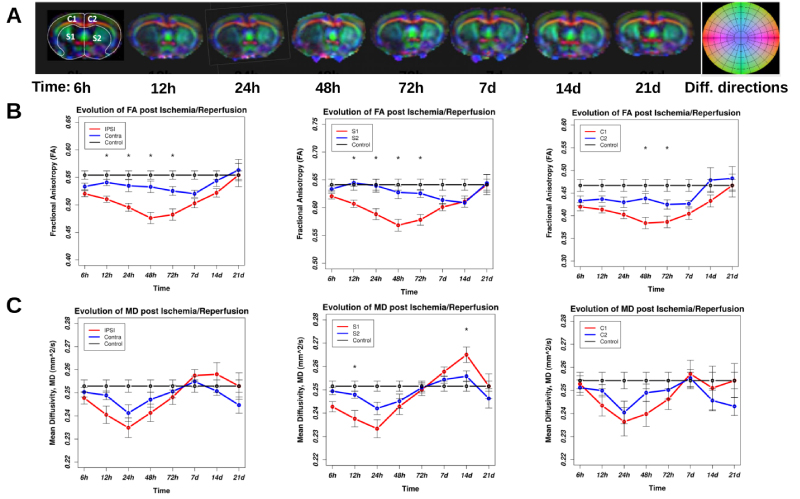
The presence of dynamics in longitudinal diffusion data indicates the evolution of water compartments due to possible time-dependent vasogenic or cytotoxic edema, as well as tissue integrity impairment due to direct impact of I/R. Figure 2 represents the spatial evolution of DTI metrics; FA and MD that are used as measures of water free diffusion in tissues. The top panel represents examples of color-coded directional FA maps of a MCAo rat brain including ischemic lesion for eight consecutive time points after reperfusion. The darker areas on all images represent lower FA, which reflects a lower directional diffusion of water molecules in underlying tissues. The middle panel of Figure 2 represents the statistical comparison of mean FA in contralateral and ipsilateral hemispheres of the rat brains. The difference between FA values calculated in contralateral and ipsilateral hemispheres was significant at 12 h, 24 h, 48 h, and 72 h of reperfusion (p < 0.05). The same significant difference was also observed when comparing FA values in the ipsilateral and contralateral subcortical area. However, the difference between the FA values in the ipsilateral cortex and contralateral cortex was only significant at 48 h and 72 h of reperfusion (p < 0.05). The bottom panel of Figure 2 presents the comparison of mean MD between contralateral and ipsilateral hemispheres for both cortical and subcortical areas of the rat brains. Even though MD in the ipsilateral hemisphere was lower than that in the contralateral hemisphere, we did not observe any statistically significant difference in contralateral and ipsilateral MDs (p = 0.12). Similarly, we observed the difference between MD values in the ipsilateral and contralateral subcortical area. However, only these differences at 12 h and 14 d of reperfusion were statistically significant. We did not observe any statistically significant differences between MDs in the ipsilateral cortex and contralateral cortex.
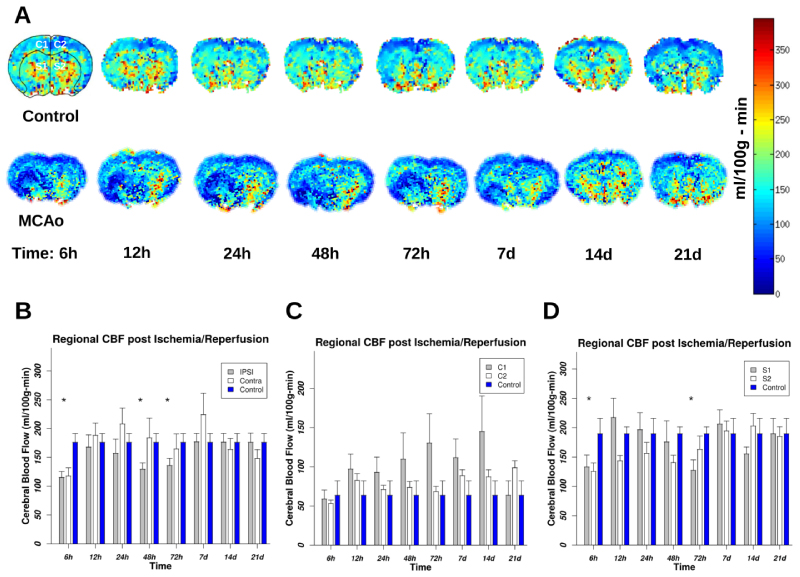
As evidenced in the figure, statistically significant differences between FA in hemispheres have occurred in I/R injury phase (up to 72 h) but not in the recovery phase. We observed a reduction in FA of ipsilateral anatomical areas, as it was expected, however, we also observed reduction in FA values in contralateral ROIs at these imaging times. The deviation of MD from baseline starts from the first imaging time and continues till 48 h of I/R then the differences start to shrink till 72 h of reperfusion where it reaches the baseline values. After that, the MD becomes higher than the baseline values with a peak at 14 d and 7 d for subcortical and cortical areas respectively. The MD's dynamics is more complex than FA's dynamics. This indicates the presence of more directional water diffusion in the contralateral hemisphere than in the ipsilateral one. At 48 h of reperfusion, this difference reached its peak as it is evident by comparing the difference between ipsilateral and contralateral FA at this time. At 7 d of reperfusion, the mean FA of the contralateral hemisphere returned to its normal value, while at this time in the ipsilateral hemisphere, the mean FA value remained lower than the normal value, possibly due to the existence of lesions and scar tissues. The deviation of MD from baseline starts from the first imaging time and continues till 48 h of I/R then the difference start to shrink till 72 h of reperfusion where it reaches the baseline values. After that the MD become higher than the baseline values with a peak at 14 d and 7 d for subcortical and cortical areas respectively. We observe that the MD's dynamics are more complex than FA's dynamics. However, after experiencing a dynamic following the insult of I/R, both MD and FA values in the ipsilateral hemisphere approaching to their baseline normal values at 21 d of reperfusion (Figure 2B and Figure 2C). Of note is that at this time the MD values in the contralateral hemisphere are below the normal baseline values, though statistically nonsignificant. Here, we in vivo measured voxel-based rCBF by employing the ASL technique in MRI. Representative color-coded rCBF maps for a coronal slice covering the largest ischemic area in a rat MCAo model along with a corresponding coronal slice in a control rat for eight sequential time points following ischemia are shown in Figure 3A. The color bar represents the color codes used for representing rCBF values in the images. Darker shades of color represent lower rCBF values; brighter colors correspond to higher rCBF values. As shown in the panel A and the statistical analysis of group data in panels B, C, and D, the lowest value of rCBF was at 72 h of reperfusion. Subsequently, rCBF started recovering to its original value in the recovery phase. Figure 3B shows the mean ± SEM of rCBF as it is calculated in a cerebral volume confined to three coronal sections containing ischemic lesion 21 d after MCAo. The largest difference between hemispherical rCBF is at 48 h of reperfusion (p = 0.035). The result demonstrates that the ipsilateral cortex (C1) had a larger variation in rCBF than the contralateral cortex (C2). Figure 3C compares the evolution of rCBF in the ipsilateral and contralateral cortex. Figure 3D compares the evolution of rCBF in ipsilateral and contralateral subcortical areas S1 and S2 respectively. We observe from this figure that after a short decrease in rCBF, there is an increase in rCBF at 12 and 24 h of reperfusion. Moreover, a delayed increase in rCBF is observed in S2. As it is evident from panels A and D of this figure, in the recovery phase we did not observe any significant differences between mean rCBF of S1 and of S2. rCBF of the contralateral hemisphere was reduced at 72 h of reperfusion, although the change in rCBF was smaller than the change of rCBF in the ipsilateral hemisphere. Interestingly, there was also a global change in CBF post ischemia. Finally, the CBF (the whole brain) was fully recovered to its normal value at 21 d after I/R (Panel B).
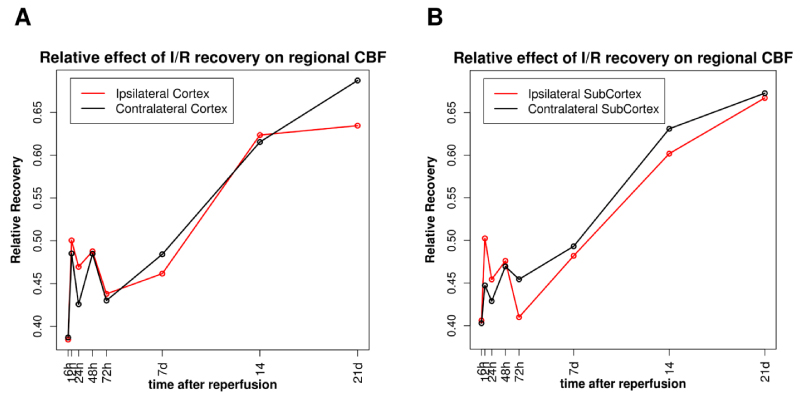
Calculated values of RTE for two hemispheric mirror anatomical regions of the brain are shown in Figure 4. Changes in RTE indicate the presence of a variable longitudinal effect of time on rCBF for all studied ROIs (p < 0.001), though non-uniform. Figure 4A represents this non-uniform RTE on rCBF for eight measured times following I/R. As it can be observed from this figure, rCBF recovery was faster in the ipsilateral cortex compared to the contralateral cortex. This is more pronounced in the injury phase. Of note is that, in the recovery phase, both hemispheres had the same impact on rCBF, however, after day 14 the contralateral cortex recovered faster (RTE > 0.63). Figure 4B represents the relative effect of time on rCBF in the subcortical area. As it is seen, at the early time after ischemia (< 48 h) rCBF has a more pronounced recovery rate in the ipsilateral subcortical area compared to the contralateral area. However, after 48 h of reperfusion, the recovery of rCBF in the contralateral subcortical area starts to improve. In contrast to the cortical area, in subcortical area after 72 d of I/R, the recovery of rCBF in the contralateral area is better than recovery in the subcortical area. We also found that perfusion duration accounted for different effects on CBF recovery in hemispheric areas (Figure 4). Early time points had more profound effects on rCBF in ipsilateral regions. Also, there were significant differences in RTE of time on rCBF recovery between the hemispheres. This relationship was more pronounced in subcortical areas (Figure 4B). The differences may result from a higher impact on the improvement of rCBF at 12 and 24 h of reperfusion in the ipsilateral subcortex than in the contralateral one.
Discussion
In this study, multiple advanced MR imaging techniques were used longitudinally to identify cerebral interhemispheric differences in diffusion and perfusion parameters following I/R. We measured the dynamics of rCBF, a marker of hemodynamic variability by using ASL technique, along with water diffusion metrics in a rat MCAo model of focal I/R. Longitudinal values of both FA and MD of water diffusion were utilized as measures of tissue microstructure and edema evolution respectively. Spatio-temporal diffusion and perfusion data were individually and group analyzed to investigate transhemispheric significance in the recovery of I/R injury. The main findings are that the dynamics of rCBF and structure of water compartments in acute phases are different between affected and unaffected cerebral hemispheres. Subsequently, the data demonstrate that post I/R FA value tends to decrease in both hemispheres, while it was decreased more in the affected hemispheres compared to the baseline for all the measuring times following the insult of I/R (see Figure 2B). Finally, we also found that the impact of time as measured by "relative effect of time" on cerebral perfusion is different in cerebral hemispheres.
Recent advances in MR quantitative techniques (such as ASL and DTI for perfusion and diffusion imaging, respectively) enable us to quantitatively monitor the evolution of rCBF [36], and changes in water diffusion parameters after the insult of ischemia [37]. ASL is a non-invasive imaging technique gaining popularity in rCBF quantification [38,39]. DTI, on the other hand, becomes more accurate in in vivo estimates of cerebral tissue microstructures [20]. The use of MRI acquired water diffusion parameters such as FA (a measure of directional water diffusion) and MD (a measure of mean diffusivity of water, a surrogate marker of cerebral edema) have become popular in cerebral ischemia injury assessment [40-43]. Each of these imaging techniques has been used to study ischemic stroke, however, the use of both imaging techniques as a multi-modal imaging approach is considered to be more effective in the characterization of cerebral ischemia [44]. More importantly, with the advance of these imaging techniques, one can collect data with higher spatial and temporal resolution gaining more insight about tissue evolution following ischemic insult.
Although the impact of cerebral focal I/R on rCBF has been recognized before [45], longitudinal details on rCBF dynamics in the non-ischemic hemisphere, and mirror anatomical areas are not being fully understood. In ischemic areas, as it has been confirmed previously, a decrease in rCBF is expected because of vascular occlusion. However, the impact of ischemia on rCBF in non-ischemic areas, particularly in the collateral hemisphere, remained to be investigated. Here, we used state of the art in vivo imaging techniques to quantitatively determine the dynamics of hemispheric cerebral perfusion along with diffusion imbalance after I/R. Our results demonstrate that the maximum difference in rCBF between the hemispheres (with ipsilateral rCBF being the lowest) happens at 3 days of reperfusion. The results are supported by previous observations by Schrandt, et al. who examined rCBF by using different approaches (multiexposure speckle and two-photon imaging) [46].
It has been shown that despite resolving cerebral occlusion, CBF does not recover fully in ischemic areas [47]. The present data not only confirm previous findings on CBF slow recovery in the ischemic area but also provide an update on CBF recovery dynamics in ischemic and non-ischemic hemisphere [48]. Several reasons have been proposed to justify the observation. First, it might be due to microvascular impairment and incomplete microcirculatory reperfusion (IMR) or no re-flow (a failure to achieve adequate reperfusion of cerebral microcirculation) that are observed in ischemic regions [49]. Second, it might be the result of endothelial swelling [50] and compression by swollen astrocyte end-feet [51] and/or transient constriction of smooth muscle cells [52]. Alternatively, Tsuchidate, et al. undertook a detailed study, using a rat model of ischemia and autoradioactive imaging techniques confirmed that after reperfusion some areas of ischemic tissues experienced hyperperfusion [53]. Together, these conflicting pieces of evidence confirm the complex nature of rCBF dynamics following I/R even in the unaffected hemisphere. However, more precise mapping of longitudinal change in rCBF would be needed to provide further clues into the cerebrovascular pathophysiology of I/R insult.
Here, we observed complex patterns in contralateral rCBF dynamics following I/R with the minimum flow at 24 h of reperfusion. Our data suggest a hemispheric decrease in contralateral rCBF compared to ipsilateral hemispheric rCBF, though it is not statistically significant. We found that at this time of reperfusion contralateral cortical rCBF was significantly reduced compared to the baseline. Of note is that our results on contralateral hemispheric rCBF (Figure 3) are not fully in agreement with data reviewed by Andrews, et al. [54]. Based on the reported data, they have concluded that rCBF in contralateral hemisphere decreased over the first week followed by a gradual return toward baseline. A possible reason for such discrepancy between our data and the data reported by Andrews, et al. is that most of the reported data came from acute ischemia with no reperfusion. A different complex mechanism may be involved in the general phenomenon of permanent ischemia, as opposed to I/R that affects the entire brain. A tentative explanation for the increase in contralateral rCBF after I/R is the following: After unilateral ischemia, there will be more vessels in contralateral areas that respond to the vascular dilation that happens post-hypoxic ischemia. However, it remains to be investigated if focal ischemia differentially changes levels of endothelial dilator/constrictor (e.g. NO, prostaglandin, angiotensin) within hemispheres.
One of the significant discovery from our study is that microstructural changes happen in both cerebral hemispheres following a focal unilateral I/R. Both FA values of the two hemispheres were significantly different from the normal baseline values in opposite directions during the acute phase of I/R (Figure 2). The underlying mechanism that leads to the FA changes in cerebral tissues is still debatable [55]. The decrease of FA in the ischemic hemisphere is mostly connected to the loss of tissue integrity and restriction of water diffusion in all directions (likely the result of cytotoxic edema and pathological damage to tissue structures). On the other hand, the increased FA in the unaffected hemisphere could be linked to the elevated directional water diffusion, a condition that arises from increased CPP.
A significant time-dependent reduction in FA, within the ischemic lesion, has been observed in patients with acute ischemia [56,57]. Liu, et al., have found that there are differences in the evolution of FA between transient and permanent occlusion models [58]. The present results extend these previous observations of FA in transient ischemic hemisphere [59]. Though the reason for such differences in FA evolution between hemispheres is not clear, the differences in the extent of cytotoxic edema between hemispheres could be a reason for observed differences in FA evolution. An increased FA, observed in hypoperfused WM in hyperacute ischemic stroke, is suggestive of early ischemic microstructural changes [40,60].
One of the major limitations of this study is the variation in survivability rates of MCAo models. In longitudinal studies of stroke, there is a concern as to whether survived samples are from the models that survived the insult of ischemic stroke. Therefore, there is bias in samples and the results of such studies should be cautiously interpreted. Another limitation of the current study is the age of rat models. The age of rats in this study mimics fairly young adults. However, stroke incidence is higher in older people [61]. Therefore, a logical continuation of this study would be the study of diaschisis following the insult of I/R on older models that provides knowledge about the plasticity and recovery of elderly patients following the insult of I/R.
Another limitation of the study is the lack of histological validation of high-resolution DTI parameters. It has been now accepted that there are significant connections between DTI parameters value and the underlying histological and chemical changes following cerebral ischemia [62-64]. However, there are controversies around the mechanism that leads to specific DTI parameter changes. For example, Tuor, et al. were investigated the potential contribution of various cellular responses to FA and MD by using ischemia/hypoxia neonatal models [43]. They have suggested that microglial or astroglial activation have modest contributions to the evolution of axonal changes in DTI parameters. On the other hand, Lodygensky, et al. have shown in the same model that glial changes without marked cell death can change MD [64]. Further histochemical studies are required to underline the mechanisms of hemispheric diaschisis and its connection with cerebral autoregulation following the insult of focal cerebral ischemia.
It is also important to note that CPP is a vital parameter in cerebral autoregulation. CPP, which is the difference between mean arterial blood pressure (MAP) and intracranial pressure (ICP), is linearly related to rCBF. In ipsilateral areas a higher ICP is expected to be accompanied with a lower rCBF, this is mainly because of lesions mass and edema in this area. This is different from what is happening in the contralateral hemisphere where there is no lesion. In contralateral hemisphere, higher cranial pressure results in a higher rCBF. Note that the relationship between CPP and rCBF becomes more complex in pathological conditions (such as focal ischemia). Therefore, the dynamics of rCBF may not correctly reflect the impaired cerebral autoregulation mechanisms. For future studies, it is advisable to measure cranial pressure in order to provide a pressure reactivity index [65,66]. This can be done by using transcranial Doppler ultrasonography [67,68]. Although the importance of the degree of diaschisis in the prediction of neurological outcomes following cerebral ischemia being appreciated [69], our experiments were the first steps in acquiring quantitative hemispheric diaschisis data. The next step of this study would be to investigate the effect of age on diaschisis.
In summary, our quantitative in vivo longitudinal imaging data provide evidence supporting the concept of transhemispheric diaschisis of both rCBF and tissue microstructural integrity following the insult of focal cerebral I/R. The study suggests that, in ischemic phases, transhemispheric diaschisis is dynamic, while in the recovery phase, it is not. Transhemispheric diaschisis may be formulated as a surrogate marker of I/R recovery. Although several mechanisms were discussed as to why this might occur, more research is required in order to substantiate this claim.
Funding
This study was funded by American Heart Association Grant (AHA-BGA0965473Z) to ST.
Declaration of Conflicting Interests
The authors declare no potential conflicts of interest with respect to the research, authorship, and/or publication of this article.
References
- Schwartz AE (2014) Cerebral and renal blood flow autoregulation. Anesthesiology 120: 1281.
- Lang EW, Yip K, Griffith J, et al. (2003) Hemispheric asymmetry and temporal profiles of cerebral pressure autoregulation in head injury. J Clin Neurosci 10: 670-673.
- Powers WJ (1991) Cerebral hemodynamics in ischemic cerebrovascular disease. Ann Neurol 29: 231-240.
- Plum F (1983) What causes infarction in ischemic brain?: The robert wartenberg lecture. Neurology 33: 222-233.
- Ribo M, Molina CA, Rovira A, et al. (2005) Safety and efficacy of intravenous tissue plasminogen activator stroke treatment in the 3- to 6-hour window using multimodal transcranial Doppler/MRI selection protocol. Stroke 36: 602-606.
- Seitz RJ, Butefisch CM, Kleiser R, et al. (2004) Reorganisation of cerebral circuits in human ischemic brain disease. Restor Neurol Neurosci 22: 207-229.
- Chan KH, Miller JD, Piper IR (1992) Cerebral blood flow at constant cerebral perfusion pressure but changing arterial and intracranial pressure: Relationship to autoregulation. J Neurosurg Anesthesiol 4: 188-193.
- Budohoski KP, Czosnyka M, Kirkpatrick PJ, et al. (2015) Bilateral failure of cerebral autoregulation is related to unfavorable outcome after subarachnoid hemorrhage. Neurocrit Care 22: 65-73.
- Donkin JJ, Vink R (2010) Mechanisms of cerebral edema in traumatic brain injury: Therapeutic developments. Curr Opin Neurol 23: 293-299.
- Le Bihan D, Iima M (2015) Diffusion magnetic resonance imaging: What water tells us about biological tissues. PLoS Biol 13: e1002203.
- Lavy S, Melamed E, Portnoy Z (1975) The effect of cerebral infarction on the regional cerebral blood flow of the contralateral hemisphere. Stroke 6: 160-163.
- Buffon F, Molko N, Herve D, et al. (2005) Longitudinal diffusion changes in cerebral hemispheres after MCA infarcts. J Cereb Blood Flow Metab 25: 641-650.
- Wu O, Lu J, Mandeville JB, et al. (2012) Dynamic functional cerebral blood volume responses to normobaric hyperoxia in acute ischemic stroke. J Cereb Blood Flow Metab 32: 1800-1809.
- Carrera E, Tononi G (2014) Diaschisis: Past, present, future. Brain 137: 2408-2422.
- Mountz JM (2007) Nuclear medicine in the rehabilitative treatment evaluation in stroke recovery. Role of diaschisis resolution and cerebral reorganization. Eura Medicophys 43: 221-239.
- Chu WJ, Mason GF, Pan JW, et al. (2002) Regional cerebral blood flow and magnetic resonance spectroscopic imaging findings in diaschisis from stroke. Stroke 33: 1243-1248.
- Le Prieult F, Thal SC, Engelhard K, et al. (2017) Acute cortical transhemispheric diaschisis after unilateral traumatic brain injury. J Neurotrauma 34: 1097-1110.
- Lovblad KO, Haller S, Pereira VM (2012) Stroke: High-field magnetic resonance imaging. Neuroimaging Clin N Am 22: 191-205.
- Hartkamp NS, van Osch MJ, Kappelle J, et al. (2014) Arterial spin labeling magnetic resonance perfusion imaging in cerebral ischemia. Curr Opin Neurol 27: 42-53.
- Parekh MB, Gurjarpadhye AA, Manoukian MA, et al. (2015) Recent developments in diffusion tensor imaging of brain. Radiol Open J 1: 1-12.
- Zaharchuk G, Martin AJ, Dillon WP (2008) Noninvasive imaging of quantitative cerebral blood flow changes during 100% oxygen inhalation using arterial spin-labeling MR imaging. AJNR Am J Neuroradiol 29: 663-667.
- Alexander AL, Lee JE, Lazar M, et al. (2007) Diffusion tensor imaging of the brain. Neurotherapeutics 4: 316-329.
- Peled S (2007) New perspectives on the sources of white matter DTI signal. IEEE Trans Med Imaging 26: 1448-1455.
- Yan J, Zhou B, Taheri S, et al. (2011) Differential effects of HIF-1 inhibition by YC-1 on the overall outcome and blood-brain barrier damage in a rat model of ischemic stroke. PLoS One 6: e27798.
- Taheri S, Candelario-Jalil E, Estrada EY, et al. (2009) Spatiotemporal correlations between blood-brain barrier permeability and apparent diffusion coefficient in a rat model of ischemic stroke. PLoS One 4: e6597.
- Pan J, Konstas AA, Bateman B, et al. (2007) Reperfusion injury following cerebral ischemia: Pathophysiology, MR imaging, and potential therapies. Neuroradiology 49: 93-102.
- Wang LY, Liu J, Li Y, et al. (2015) Time-dependent variation of pathways and networks in a 24-hour window after cerebral ischemia-reperfusion injury. BMC Syst Biol 9: 11.
- Bos A, Bergmann R, Strobel K, et al. (2012) Cerebral blood flow quantification in the rat: A direct comparison of arterial spin labeling MRI with radioactive microsphere PET. EJNMMI Res 2: 47.
- Moffat BA, Chenevert TL, Hall DE, et al. (2005) Continuous arterial spin labeling using a train of adiabatic inversion pulses. J Magn Reson Imaging 21: 290-296.
- Silva AC, Kim SG, Garwood M (2000) Imaging blood flow in brain tumors using arterial spin labeling. Magn Reson Med 44: 169-173.
- Paxinos G, Watson C (2008) The rat brain in stereotaxic coordinates. (6th edn), Elsevier.
- Lu M, Zhang ZG, Chopp M (2004) Analysis of cerebral microvascular architecture--application to cortical and subcortical vessels in rat brain. J Neurosci Methods 138: 81-87.
- Detre JA, Wang J, Wang Z, et al. (2009) Arterial spin-labeled perfusion MRI in basic and clinical neuroscience. Curr Opin Neurol 22: 348-355.
- Brunner E, Domhof S, Langer F (2002) Nonparametric analysis of longitudinal data in factorial experiments. (1st edn), Wiley-interscience.
- Davis CS (2002) Statistical methods for the analysis of repeated measurements. Springer Texts in Statistics.
- Fan AP, Jahanian H, Holdsworth SJ, et al. (2016) Comparison of cerebral blood flow measurement with [15O]-water positron emission tomography and arterial spin labeling magnetic resonance imaging: A systematic review. J Cereb Blood Flow Metab 36: 842-861.
- Ma C, Liu A, Li Z, et al. (2014) Longitudinal study of diffusion tensor imaging properties of affected cortical spinal tracts in acute and chronic hemorrhagic stroke. J Clin Neurosci 21: 1388-1392.
- Alsop DC, Detre JA, Golay X, et al. (2015) Recommended implementation of arterial spin-labeled perfusion MRI for clinical applications: A consensus of the ISMRM perfusion study group and the European consortium for ASL in dementia. Magn Reson Med 73: 102-116.
- Telischak NA, Detre JA, Zaharchuk G (2015) Arterial spin labeling MRI: Clinical applications in the brain. J Magn Reson Imaging 41: 1165-1180.
- Nael K, Trouard TP, Lafleur SR, et al. (2015) White matter ischemic changes in hyperacute ischemic stroke: Voxel-based analysis using diffusion tensor imaging and MR perfusion. Stroke 46: 413-418.
- Rossi ME, Jason E, Marchesotti S, et al. (2010) Diffusion tensor imaging correlates with lesion volume in cerebral hemisphere infarctions. BMC Med Imaging 10: 21.
- Sikio M, Kolhi P, Ryymin P, et al. (2015) MRI texture analysis and diffusion tensor imaging in chronic right hemisphere ischemic stroke. J Neuroimaging 25: 614-619.
- Tuor UI, Morgunov M, Sule M, et al. (2014) Cellular correlates of longitudinal diffusion tensor imaging of axonal degeneration following hypoxic-ischemic cerebral infarction in neonatal rats. Neuroimage Clin 6: 32-42.
- Liebeskind DS (2009) Imaging the future of stroke: I. Ischemia. Ann Neurol 66: 574-590.
- Kunz A, Iadecola C (2009) Cerebral vascular dysregulation in the ischemic brain. Handb Clin Neurol 92: 283-305.
- Schrandt CJ, Kazmi SM, Jones TA, et al. (2015) Chronic monitoring of vascular progression after ischemic stroke using multiexposure speckle imaging and two-photon fluorescence microscopy. J Cereb Blood Flow Metab 35: 933-942.
- Bandera E, Botteri M, Minelli C, et al. (2006) Cerebral blood flow threshold of ischemic penumbra and infarct core in acute ischemic stroke: A systematic review. Stroke 37: 1334-1339.
- Bokkers RP, Hernandez DA, Merino JG, et al. (2012) Whole-brain arterial spin labeling perfusion MRI in patients with acute stroke. Stroke 43: 1290-1294.
- Dalkara T, Arsava EM (2012) Can restoring incomplete microcirculatory reperfusion improve stroke outcome after thrombolysis? J Cereb Blood Flow Metab 32: 2091-2099.
- Okumura Y, Sakaki T, Hiramatsu K, et al. (1997) Microvascular changes associated with postischaemic hypoperfusion in rats. Acta Neurochir (Wien) 139: 670-676.
- Ito U, Hakamata Y, Kawakami E, et al. (2011) Temporary [corrected] cerebral ischemia results in swollen astrocytic end-feet that compress microvessels and lead to delayed [corrected] focal cortical infarction. J Cereb Blood Flow Metab 31: 328-338.
- Hill RA, Tong L, Yuan P, et al. (2015) Regional blood flow in the normal and ischemic brain is controlled by arteriolar smooth muscle cell contractility and not by capillary pericytes. Neuron 87: 95-110.
- Tsuchidate R, He QP, Smith ML, et al. (1997) Regional cerebral blood flow during and after 2 hours of middle cerebral artery occlusion in the rat. J Cereb Blood Flow Metab 17: 1066-1073.
- Andrews RJ (1991) Transhemispheric diaschisis. A review and comment. Stroke 22: 943-949.
- Alba-Ferrara LM, de Erausquin GA (2013) What does anisotropy measure? Insights from increased and decreased anisotropy in selective fiber tracts in schizophrenia. Front Integr Neurosci 7: 9.
- Zelaya F, Flood N, Chalk JB, et al. (1999) An evaluation of the time dependence of the anisotropy of the water diffusion tensor in acute human ischemia. Magn Reson Imaging 17: 331-348.
- Bhagat YA, Hussain MS, Stobbe RW, et al. (2008) Elevations of diffusion anisotropy are associated with hyper-acute stroke: A serial imaging study. Magn Reson Imaging 26: 683-693.
- Liu Y, D'Arceuil HE, Westmoreland S, et al. (2007) Serial diffusion tensor MRI after transient and permanent cerebral ischemia in nonhuman primates. Stroke 38: 138-145.
- Granziera C, Ay H, Koniak SP, et al. (2012) Diffusion tensor imaging shows structural remodeling of stroke mirror region: Results from a pilot study. Eur Neurol 67: 370-376.
- Green HA, Pena A, Price CJ, et al. (2002) Increased anisotropy in acute stroke: A possible explanation. Stroke 33: 1517-1521.
- Writing Group Members, Mozaffarian D, Benjamin EJ, et al. (2016) Heart disease and stroke statistics-2016 update: A report from the American heart association. Circulation 133: e38-e360.
- Wei PT, Leong D, Calabrese E, et al. (2013) Diffusion tensor imaging of neural tissue organization: Correlations between radiologic and histologic parameters. Neuroradiol J 26: 501-510.
- Zhang JY, Aggarwal M, Mori S (2012) Structural insights into the rodent CNS via diffusion tensor imaging. Trends Neurosci 35: 412-421.
- Lodygensky GA, West T, Moravec MD, et al. (2011) Diffusion characteristics associated with neuronal injury and glial activation following hypoxia-ischemia in the immature brain. Magn Reson Med 66: 839-845.
- Johnson U, Engquist H, Howells T, et al. (2016) Bedside xenon-CT shows lower CBF in SAH patients with impaired CBF pressure autoregulation as defined by pressure reactivity index (PRx). Neurocrit Care 25: 47-55.
- Sanchez-Porras R, Santos E, Czosnyka M, et al. (2012) 'Long' pressure reactivity index (L-PRx) as a measure of autoregulation correlates with outcome in traumatic brain injury patients. Acta Neurochir 54: 1575-1581.
- Asil T, Uzunca I, Utku U, et al. (2003) Monitoring of increased intracranial pressure resulting from cerebral edema with transcranial doppler sonography in patients with middle cerebral artery infarction. J Ultrasound Med 22: 1049-1053.
- Cardim D, Robba C, Bohdanowicz M, et al. (2016) Non-invasive monitoring of intracranial pressure using transcranial doppler ultrasonography: Is it possible? Neurocrit Care 25: 473-491.
- Joya A, Padro D, Gomez-Vallejo V, et al. (2018) PET imaging of crossed cerebellar diaschisis after long-term cerebral ischemia in rats. Contrast Media Mol Imaging 2018: 2483078.
Corresponding Author
Saeid Taheri, Ph.D, Department of Pharmaceutical Sciences, University of South Florida, 12901 Bruce B. Downs Blvd, MDC 30, Tampa, FL 33612, USA, Tel: +1-813-974-7051, Fax: +1-813-974-9890.
Copyright
© 2019 Taheri S, et al. This is an open-access article distributed under the terms of the Creative Commons Attribution License, which permits unrestricted use, distribution, and reproduction in any medium, provided the original author and source are credited.