Multi-Variate Evaluation of the Genetic Diversity in Different Rice Genotypes Tested at Pawe, Northwestern Ethiopia
Abstract
In Ethiopia, the current rice productivity is very low which is attributed to different abiotic and biotic constraints significantly impacting rice productivity particularly in the north western parts of the country. In an effort to improve the productivity of rice, the national rice breeding program of the country is introducing and evaluating different rice germplasms targeting their adaptability and agronomic performance. Likewise, 352 lowland rice genotypes were introduced and evaluated using augmented randomized complete block experimental design (Augmented-RCBD) with a plot area of 2.5 m2 involving 4 rows per plot. The seeds were drilled in rows with a seed rate of 60 kg per hectare. NPS fertilizer (124 kg per hectare) and Urea (100 kg per hectare) fertilizers were applied. The quantitative traits such as days to 50% heading, days to 85% maturity, plant height, panicle length, number of filled grains per a panicle and number of unfilled grains per a panicle, and 1000 seed weight were collected and subjected to descriptive statistics (mean performance), ANOVA and multivariate analysis (principal component analysis and clustering analysis) using SAS 9.4 and XLSTAT 2014.5.03 computer programs respectively so as to determine the extent and pattern of the genetic diversity among the tested lowland rice genotypes. From the ANOVA considering the mean square value of the quantitative traits of the treatments (Mean square (MS) of treatments) it has been observed that there is a significant variation for all the traits confirming the presence of genetic variability among the genotypes. The first three principal components (PC1, PC2 and PC3) were identified with a total cumulative variation of 78.90% showing that the genotypes could be grouped into different classes and from the distribution plot, the tested genotypes were almost uniformly distributed in four quadrants pointing the presence of genetic diversity among the genotypes. The clustering analysis result also strengthened the presence of a genetic diversity among the tested rice genotypes where the genotypes were grouped into five clusters with different Euclidian distances.
Keywords
Analysis of variance, Genetic diversity, Lowland rice, Multivariate analysis
Abbreviations
cm: Centimeter; CSA: Central Statistical Agency of Ethiopia; gm = Gram; IRRI = International Rice Research Institute; kgh-1 = Kilogram per hectare; masl = Meter above sea level; NPS = Nitrogen, phosphorous, Sulphur; PARC = Pawe Agricultural Research Center; PCA = Principal Component Analysis
Introduction
Rice (Oryza sativa L., 2n = 2x = 24) is the second most widely grown cereal crop and the staple food for more than half of the world's population, providing two-thirds of caloric intake for more than three billion people in Asia and one-third of nearly 1.5 billion people in Africa and Latin America [1] and is increasingly important in Ethiopia and named as the "millennium crop" to ensure food security of the country though the crop is relatively a new grain to the country, with its introduction only taking place in the 1970s [2,3].
Although Ethiopia is situated in tropical zone, its wide range of altitude (below sea level to over 3000 meter above sea level), gives it a wide range of climate from humid tropics to alpine, where most types of crops like rice could successfully be grown [4]. It is estimated that the country is endowed with about 30 million hectares of land, of which 5.6 million hectare is categorized as highly suitable for rice production [5-7] but the current rice production area is only 85,288.87 hectares [8].
In an effort to improve the productivity of rice and increasing its annual production and area coverage, the Ethiopian national rice breeding research program introduced and evaluated germplasms from external sources targeting for their environmental adaptability and agronomic performance regarding with their high grain yield, tolerant for biotic and abiotic stresses and for other quality traits. Measuring the available genetic diversity is of utmost importance for effective evaluation and utilization of germplasms [9] to explore their variability so as to identify desirable agronomic attributes [10]. Thus, this research activity was designed to asses and determine the extent and pattern of genetic diversity among the introduced lowland rice genotypes grown under upland rainfed conditions based on their agro-morphological quantitative traits in order to identify the well adapted genetic materials to be used in the subsequent rice breeding program.
Materials and Methods
Description of the experimental site
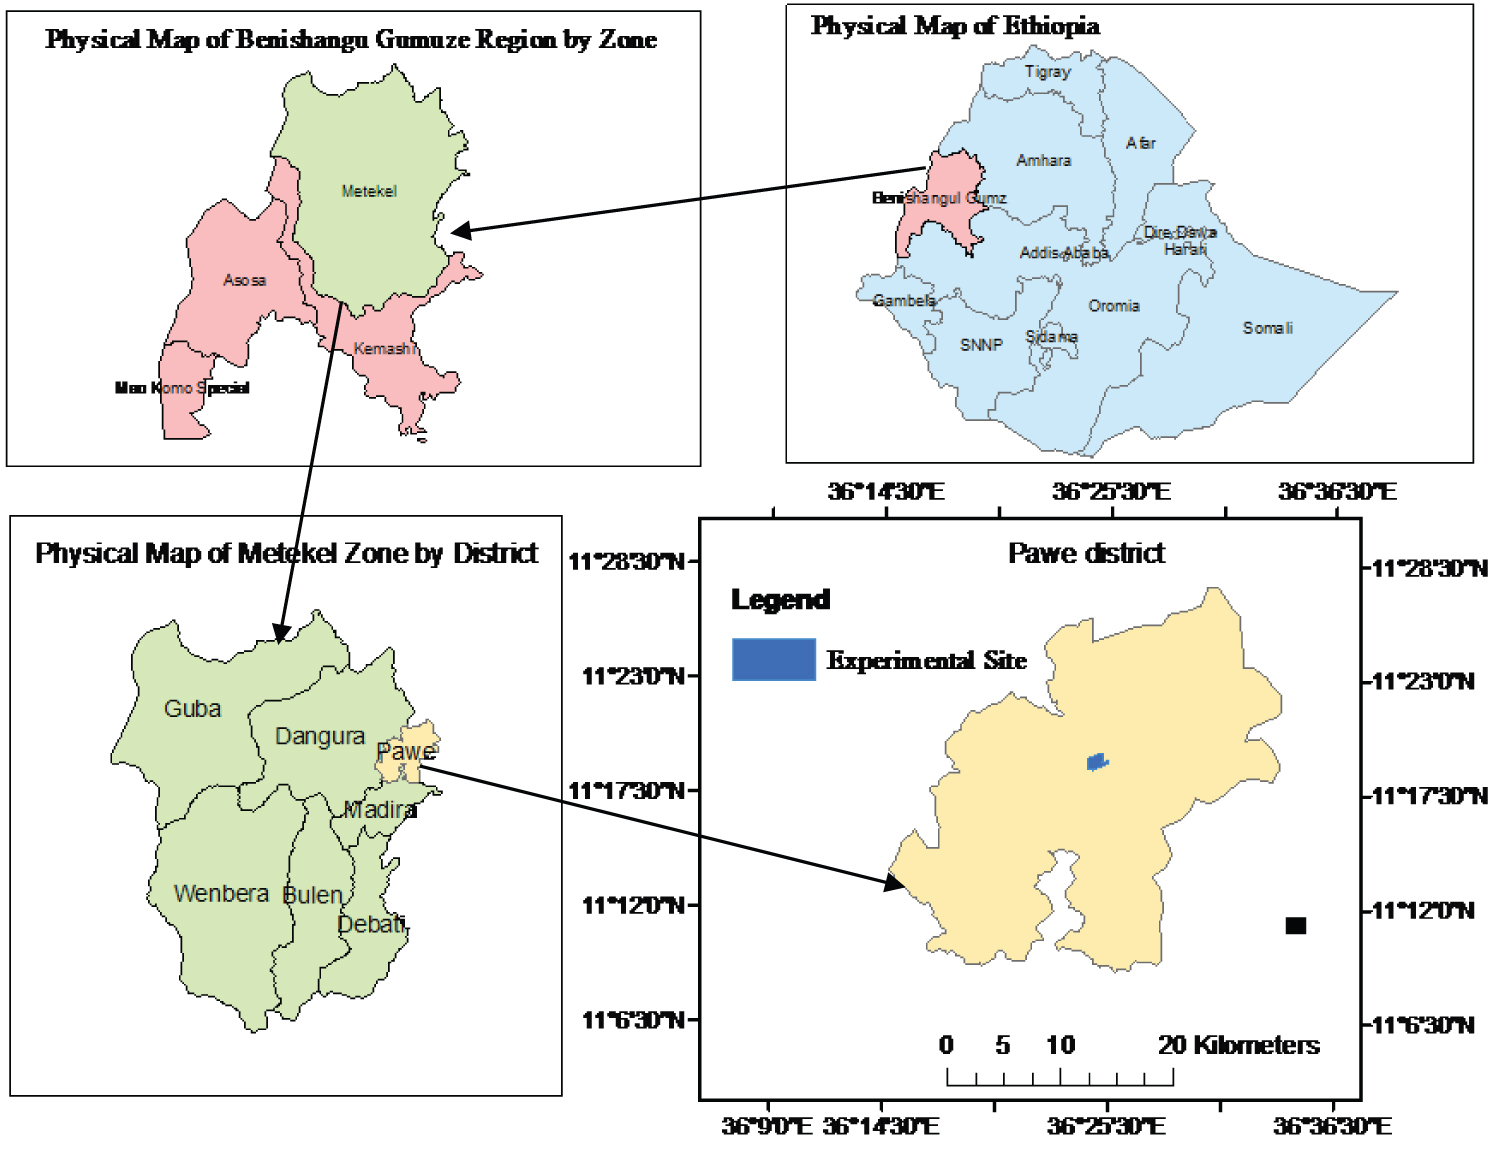
The trial was conducted at Pawe agricultural research center experimental station (Figure 1) for a year during 2019/20 main cropping season under rain-fed. The trial station is located in Pawe district, Metekel zone, Benishangul-Gumuze regional state, northwestern part of Ethiopia at about 575km north west of Addis Ababa at a latitude of 11°19'N and longitude of 36°24'E and at an elevation of 1120 masl. The area is characterized by hot to warm moist conditions with mean minimum and maximum temperature of 16 ℃ and 32 ℃, respectively with an average annual rainfall of 1587mm with five to seven months duration [11].
Plant materials
352 lowland rice genotypes with 4 standard checks (supplement 1) were used. The genotypes were collected and introduced from China and Japan in collaboration with IRRI and AfricaRice rice research project.
Experimental design and procedures
An augmented randomized complete block design (Augmented-RCBD) was employed with a total of 32 blocks and 4 checks replicated in each block containing a total of 15 experimental units (plots) each with a size of 2.5 m2 (2.5 m × 1m) with four rows. A spacing between plots and between blocks of 0.5 m and 1m respectively was used. An inter-row spacing of 0.25 m and a seed rate of 60 kgha-1 was used. Inorganic fertilizers (NPS = 124 kgh-1; Urea = 100 kgh-1) was applied. The total NPS fertilizer was applied at planting, whereas the urea was applied with three splits (1/3 at planting, 1/3 at tillering after weeding and 1/3 at the crop's panicle initiation stage).
Data collection and statistical analysis
Data were collected on plot and plant bases following the appropriate growth stage of the crop for each respective measured trait. Data on days to 50% heading and days to 85% maturity were measured on a plot basis. Plant height (cm), spike length (cm), number of filled grains per a main panicle of the central plant, number of unfilled grains per a main panicle of the central plant and 1000 seed weight (gm) were recorded from five randomly selected different plants sampled from the central parts of the middle two rows of each plot, and their mean values were used for the statistical analysis. 31 newly introduced and tested lowland rice genotypes failed to germinate and hence data were not collected on plots where they were planted. The whole measured traits were considered and subjected to analysis of variance (ANOVA) and multivariate statistical analyses (principal components and clustering analyses) so as to estimate the presence of genetic diversity among the tested lowland rice genotypes based on the respective traits. Prior to the statistical data analysis, the descriptive statistical estimation of the measured traits such as mean, range, standard deviation and coefficient of variation (CV) were calculated for each trait. was computed so as to organize, simplify and summarize the data to make it easily understandable as the starting point of for data analysis.
The over-all analysis of variance (ANOVA) was computed using SAS computer program [12] following the procedures designed by Federer [13] for augmented agricultural research design (Table 1) where the test of significance was performed using Fisher's (F) test to determine the level of variation among the tested lowland rice genotypes. R2 as the coefficient of determination was computed in order to explain how much of the variability of the modeled variable has been explained by the explanatory variables.
The principal component analysis (PCA) was computed to identify large contributing traits to the total variation among the germplasms on which the principal components having eigen value greater than 1 unit were considered as significant using XLSTAT 2014.5.03 statistical software [14] where bi-plots were drawn separately based on the first two respective PCA's, which facilitate visualization of genotypes by trait associations.
The automatic average linkage hierarchical clustering analysis was also computed to re-check the presence of genetic diversity among the tested lowland rice genotypes by measuring the proximity between two genotypes that at what point the genotypes are dissimilar using Euclidian distance (Ward's method) while clustering the genotypes using XLSTAT 2014.5.03 software[14].
Results
Descriptive statistical estimation of the quantitative traits
From the descriptive statistical analysis of seven quantitative traits of 321 lowland rice genotypes which were tested under upland conditions (Table 2), it was observed that an average value of 131 days for 85% days to maturity (DM) was obtained. The genotypes also obtained a plant height value ranging from 46.80 to 123.60 cm and an average panicle length (PL) of 18.97cm. For number of filled grain per a central main panicle (NFG), the average value of 95 grains (ranged from 45 to 172 grains) was obtained with the 1000 seed weight (TSW) ranged from 17.89 to 36.88 gm with an average value of 24.84 gm where 155 genotypes scored more than the average value of TSW and of these, 30 genotypes scored a better TSW when compared to a standard check called ‘Ediget' with the TSW value of 28.30 gm (Supplement 1).
Analysis of variance
The Analysis of variance among the over-all evaluated lowland rice genotypes were computed based on the mean square values of the corresponding seven quantitative traits. The ANOVA (Table 2) showed a significant variation (P ≤ 0.05) for all the measured quantitative traits predicting that there was a genetic variability among the genotypes though a lesser variation was observed for their 1000 seed weight. That is, the tested lowland rice genotypes had a highly significant variation on their mean values of days to heading (DH), days to 85% maturity (DM), panicle length (PL), number of filled grains per a central main panicle (NFG), number of unfilled grains per a central main panicle (NUFG). They were also slightly and significantly varied on their 1000 seed weight (TSW). Likewise, a significant difference among 64 rice genotypes on their days to heading, days to maturity and plant height has been reported by Girma, et al. [15], Dev Tiwari, et al. [16] also reported the significant variation among seven early maturing rice genotypes which had been evaluated under rainfed lowland environments of Nepal while considering their plant height, days to maturity and 1000 seed weight. Similarly, a significant variation among 26 advanced lowland irrigated rice genotypes on their maturity, plant height, panicle length and 1000 grain weight was reported [17].
While emphasizing the most grain yield contributing traits such as number of filled grains per a panicle (NFG) and panicle length (PL) as highly preferable quantitative traits of rice, the model explained about 90% of the total variability among the tested lowland rice genotypes to their panicle length and number of filled grains with a CV value of 6.27 and 13.69 respectively.
The newly introduced and tested lowland rice genotypes were highly significant (p-value < 0.05) for their plant height, panicle length and 1000 seed weight. A lesser variability on their days to 50% heading and 85% maturity was also observed among these genotypes. But the comparative variability on the newly tested lowland rice genotypes versus the checks was not significant in their all-measured quantitative traits.
Principal component analysis
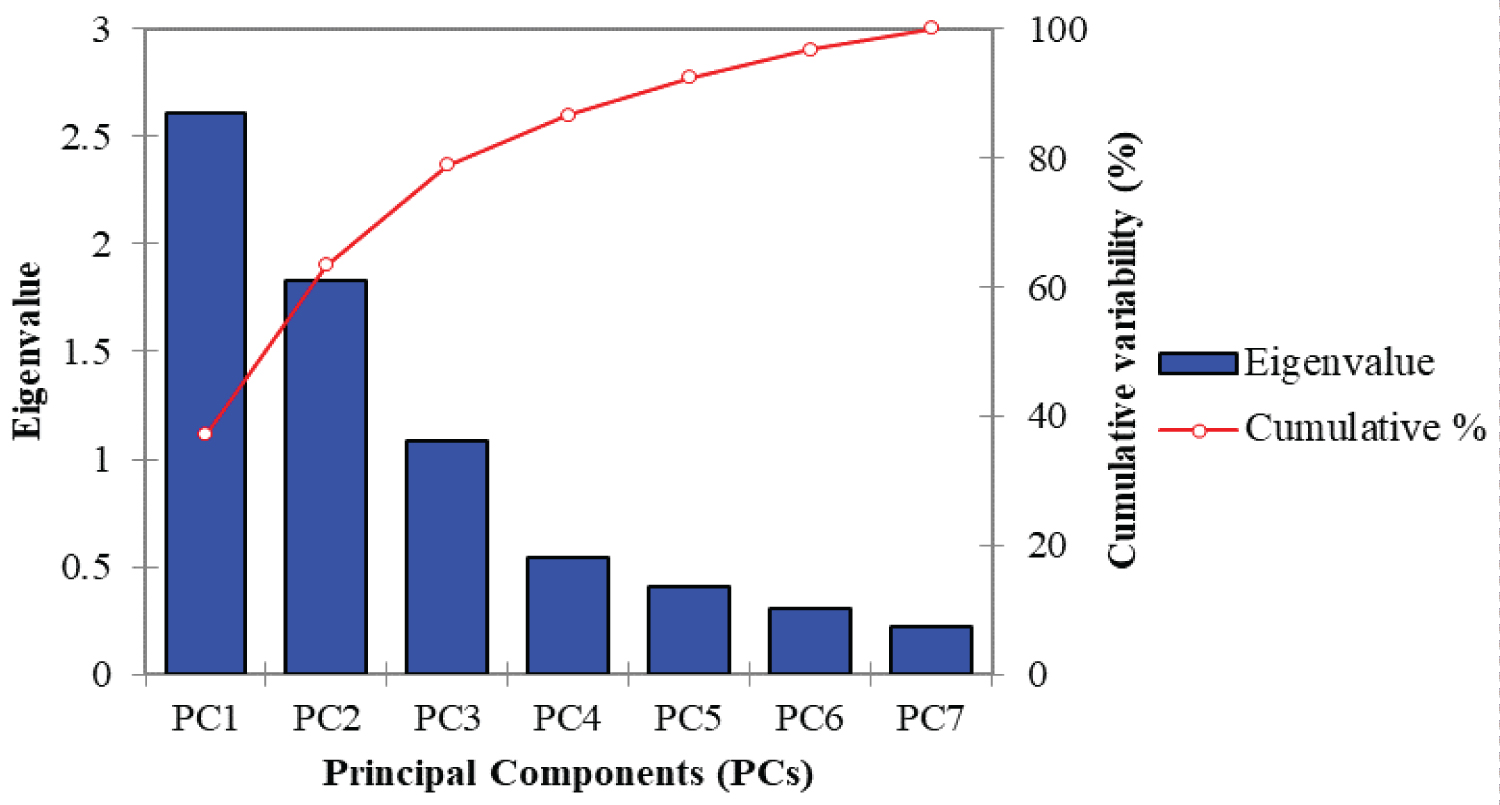
From the principal component analysis of 321 lowland rice genotypes, the first three principal components were observed with the eigen values greater than 1 unit (Table 3) and the scree plot line (Figure 2) after the third principal component were almost flat indicating that the first three principal components were accounted for higher amounts of the cumulative variability of the tested lowland rice genotypes for a total cumulative variance of 78.90 % where the largest variance was contributed by PC1 (37.25%) with an eigen value of 2.61. With a similar fashion, Chakma, et al. [18] reported the first three principal components with eigen values above a unit and accounted for 65.79% of the total variation among 39 rice genotypes. Girma, et al. [15] also explained 64% % of the cumulative variability using the first three principal components among 64 rice genotypes using seven morphological traits. With a little difference to this report, four principal components with eigen values 6.01, 1.88, 1.77 and 1.54 for PC1, PC2, PC3 and PC4 respectively were reported for a total variability of 80.04% [19], and two principal components (PC1 and PC2) contributing for 56% of the total phenotypic and morphological variation were also reported while evaluating a collection of rice genotypes [20].
From the eigen vector values of principal component analysis for seven quantitative traits (Table 3), it had been observed that plant height, panicle length and 1000 seed weight contribute positively to PC1 with a contributing coefficient of 0.46, 0.25 and 0.48 respectively whereas days to 50% heading, days to 85% maturity, number of filled grains per a panicle and number of unfilled grains per a panicle were a negative contributor. The variability on PC3 was positively contributed by number of filled grains per a panicle and number of unfilled grains per a panicle but negatively contributed by the other five quantitative traits. Altaye, et al. [21] also discussed that the variability on PC1 was positively contributed by plant height, panicle length and 1000 seed weight, and negatively contributed by days to 50% heading and days to 85% maturity but positively contributed to the variability on PC2. Unlike this report the author reported a positive contribution of days to 50% heading and days to 85% maturity to the observed variability on PC3.
The principal component loadings for the quantitative traits of the tested rice genotypes (Table 3), showed that the total variability of PC1 was highly and positively loaded by plant height (0.74), panicle length (0.41) and 1000 seed weight (0.77).
The variability of PC2 was highly loaded by number of filled grains per a panicle (0.88) and panicle length (0.67) on which the traits contributed highly and positively on its total variability. Number of unfilled grains per a panicle (0.60) had a high loading on PC3. Similarly, a positive and high loading of plant height (0.33) and panicle length (0.37) for the cumulative variance of PC1(29.72%), days to 50% heading (0.59) for the cumulative variance of PC2 (50.63%) and a negative loading of days to 50% heading (-0.02), plant height (-0.42) and panicle length (-0.35) was also reported [22]. In contrast with our study the author also recorded a positive loading of days to 50% heading (0.15) and days to 85% maturity (0.21) for PC1 and a negative loading of plant height (-0.24) and panicle length (-0.11) on PC2, and 1000 seed weight on PC1. In addition, Maji & Shaibu [23] also reported a PC1 positively loaded on plant height and 1000 grain weight, and a PC2 positively loaded on number of unfilled grains per a panicle.
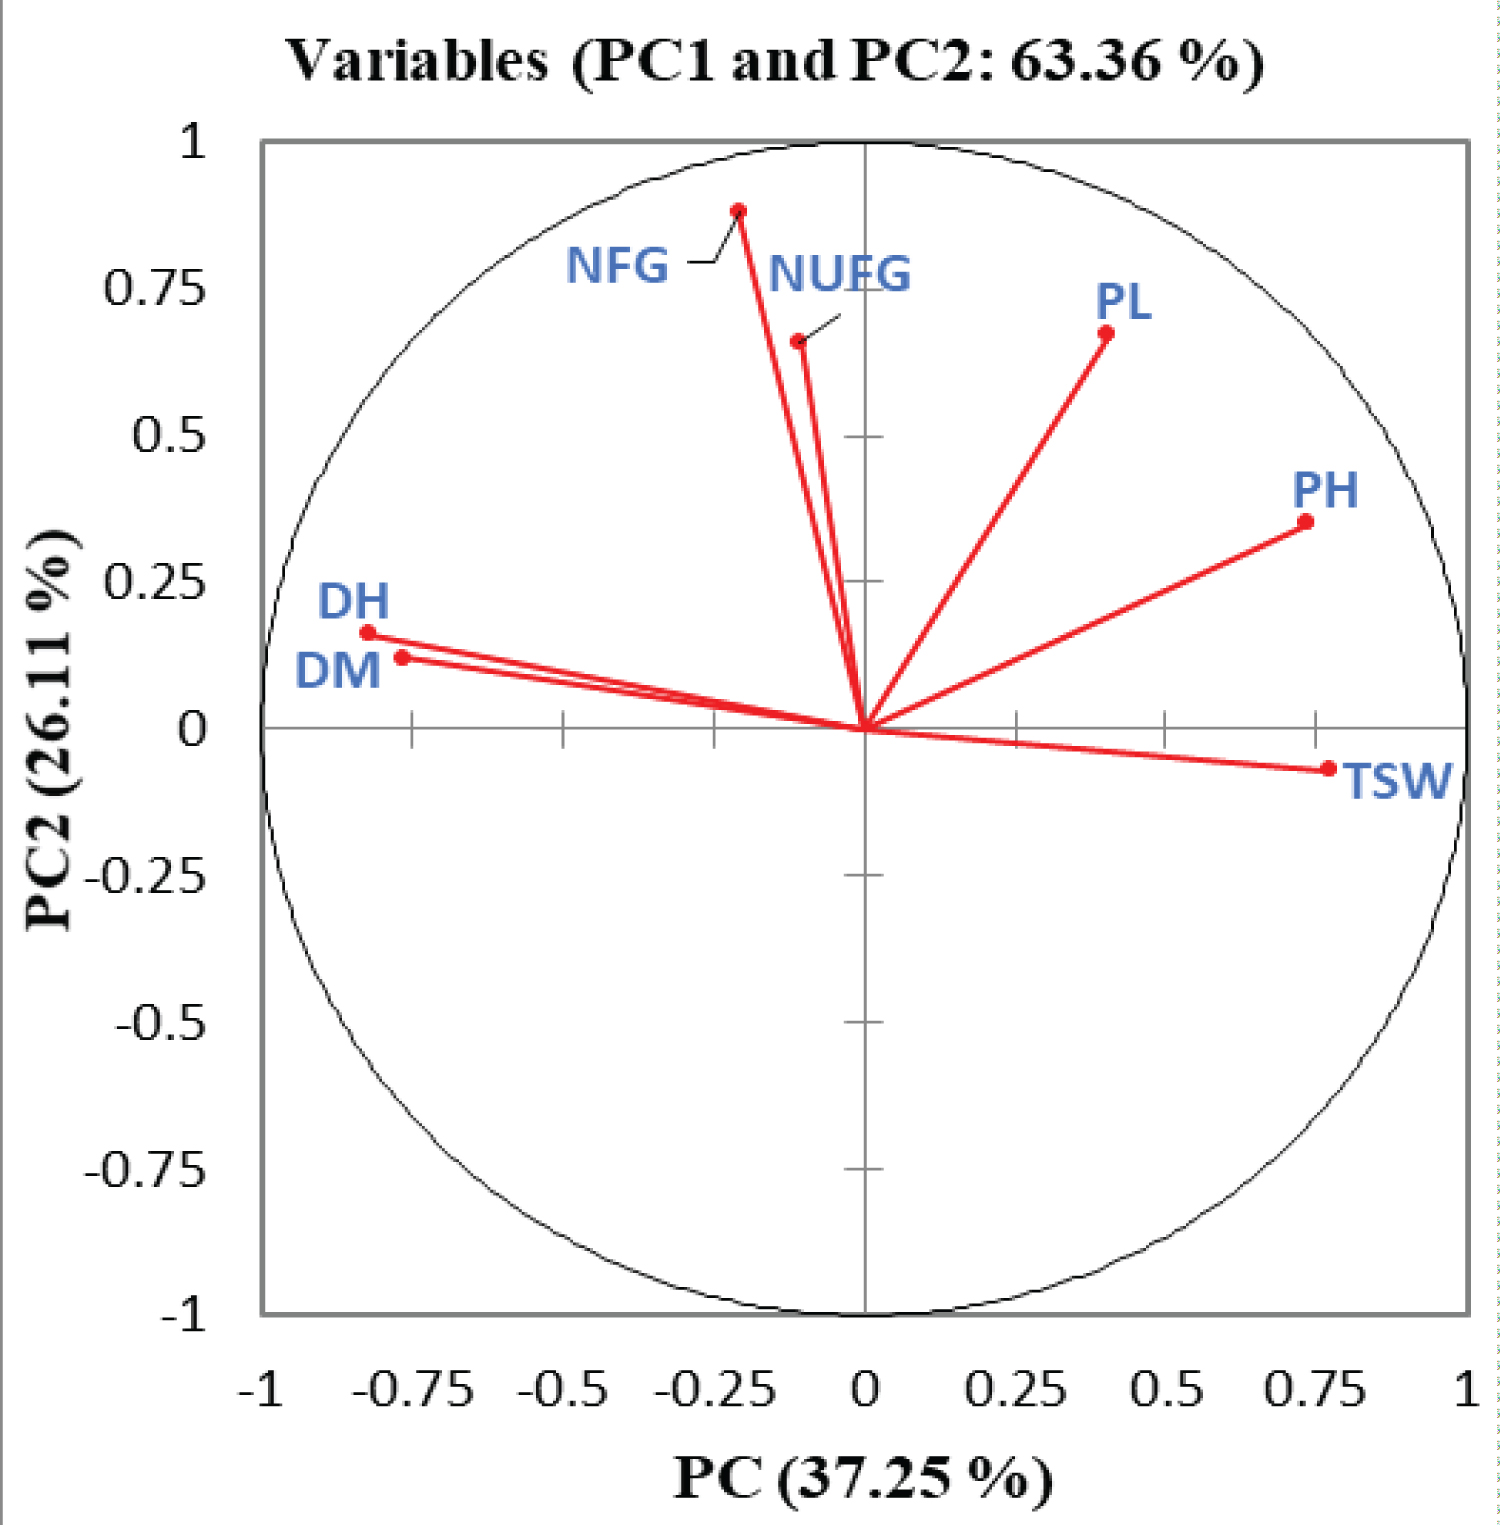
From the correlation circle formed by correlating the first two principal components with the measured quantitative traits (Figure 3), it was observed that the vector lengths of days to 50% heading (DH) and days to 85% maturity (DM) formed a narrow angle indicating that these two traits were positively correlated with each other. The right angles formed by the vector length of number of unfilled grains per a panicle (NUFG) and plant height (PH) showed that these two traits were highly unrelated to each other. It has been clearly showed that days to 50% heading (DH), days to 85% maturity (DM), plant height (PH) and 1000 seed weight brought a higher contribution to the total variability of PC1 (25.76%, 22.33%, 20.72% and 22.81% respectively) whereas panicle length (PL), number of filled grains per a panicle (NFG) but number of unfilled grains per a panicle (NUFG) showed a lower contribution (Table 4) to its total variability.
Number of filled grains per a panicle (NFG) had a highest contribution (42.26%) to the total variability of PC2 whereas 1000 seed weight (TSW) was the least contributed trait (0.27%) to this principal component. The total variability percentage of PC3 was highly contributed by number of unfilled grains per a panicle (33.37%) and days to maturity (20.48%). Mahendran, et al. [24] also reported that plant height showed a higher contribution for the total variability of PC1 (23.35 %) but with a contrasting report that panicle length and number of filled grains per a panicle contributed negatively to PC2 while studding the genetic diversity of 36 upland rice genotypes in southwestern Ethiopia.
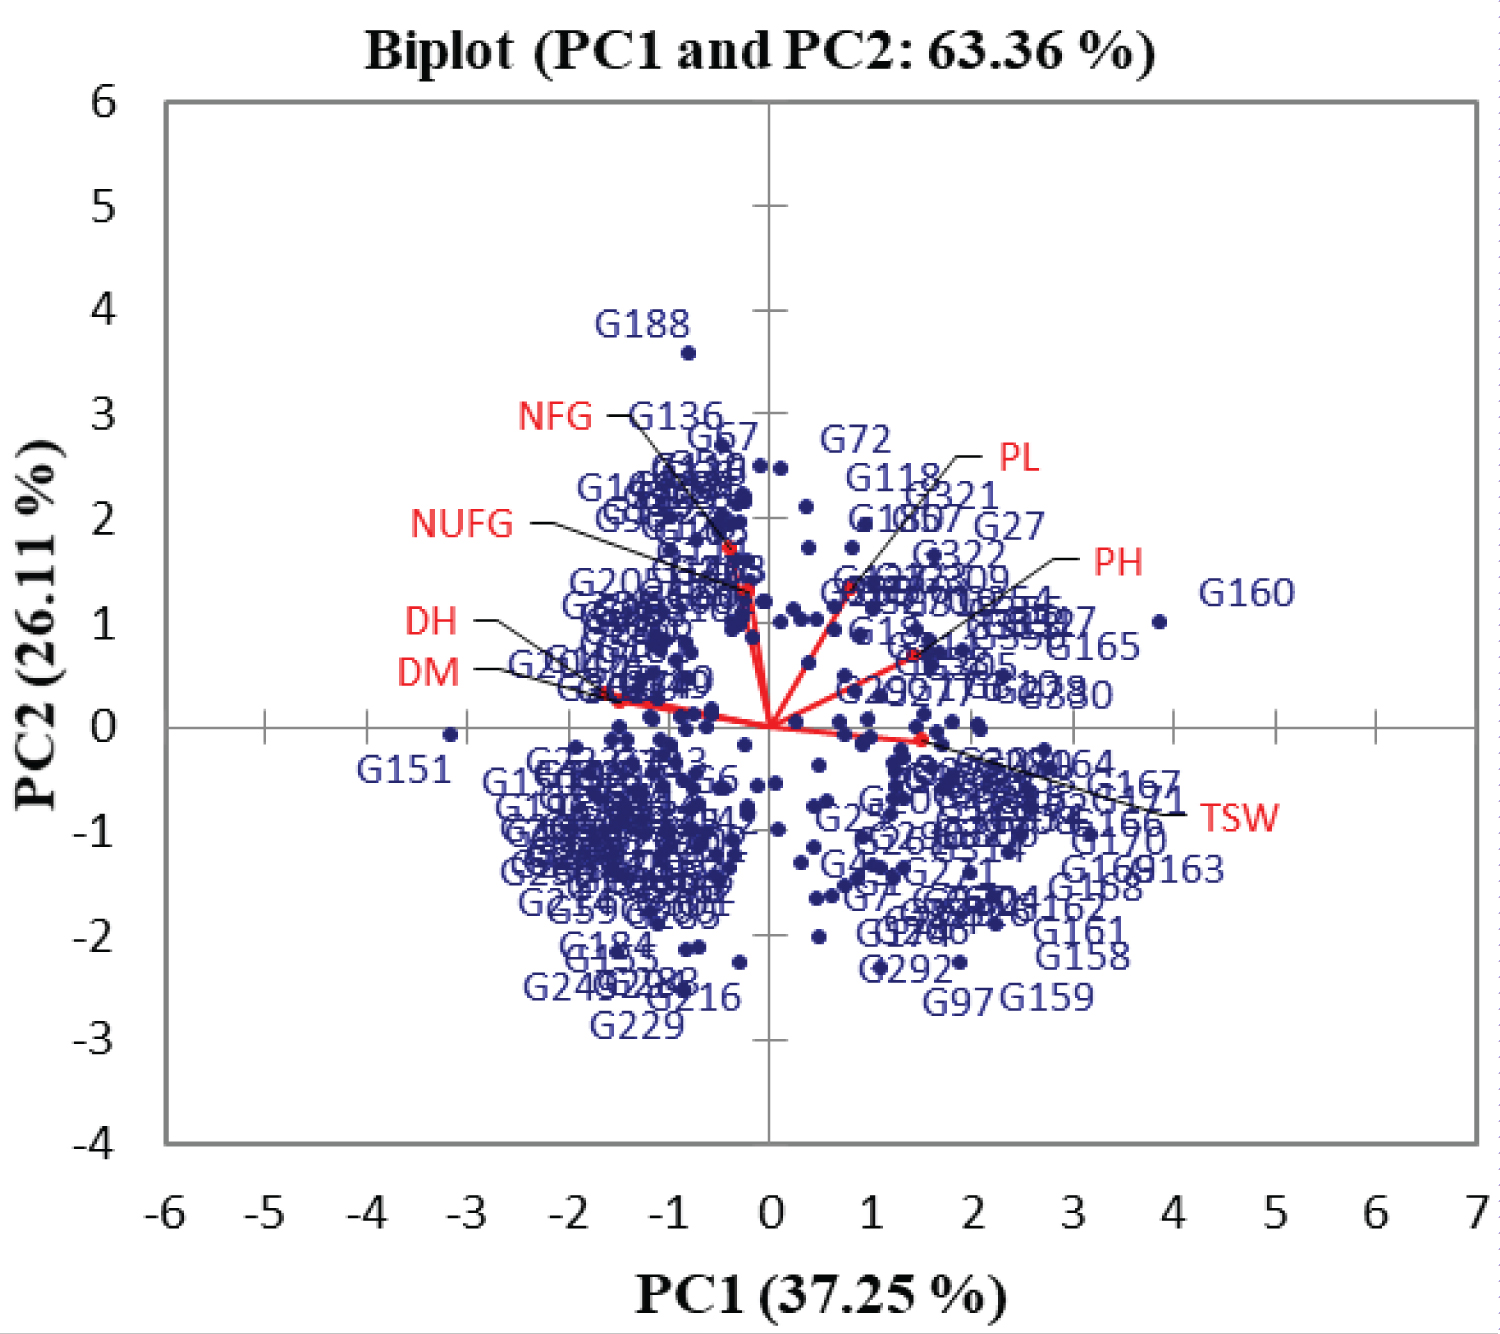
To clearly identified that which quantitative trait is well linked with each principal component, the squared cosine of each trait was considered (Table 4). From the cosine square result, it was observed that DH, DM, PH and TSW were well linked with PC1 whereas PL, NFG and NUFG were highly linked with PC2, and PC3 had relatively a higher linkage with DM and NUFG. From the distribution pattern of 321 rice genotypes explained by seven different quantitative traits (Figure 4) it was also observed that the genotypes were distributed in different coordinates directing the presence of genetic diversity among the tested genotypes.
Cluster analysis
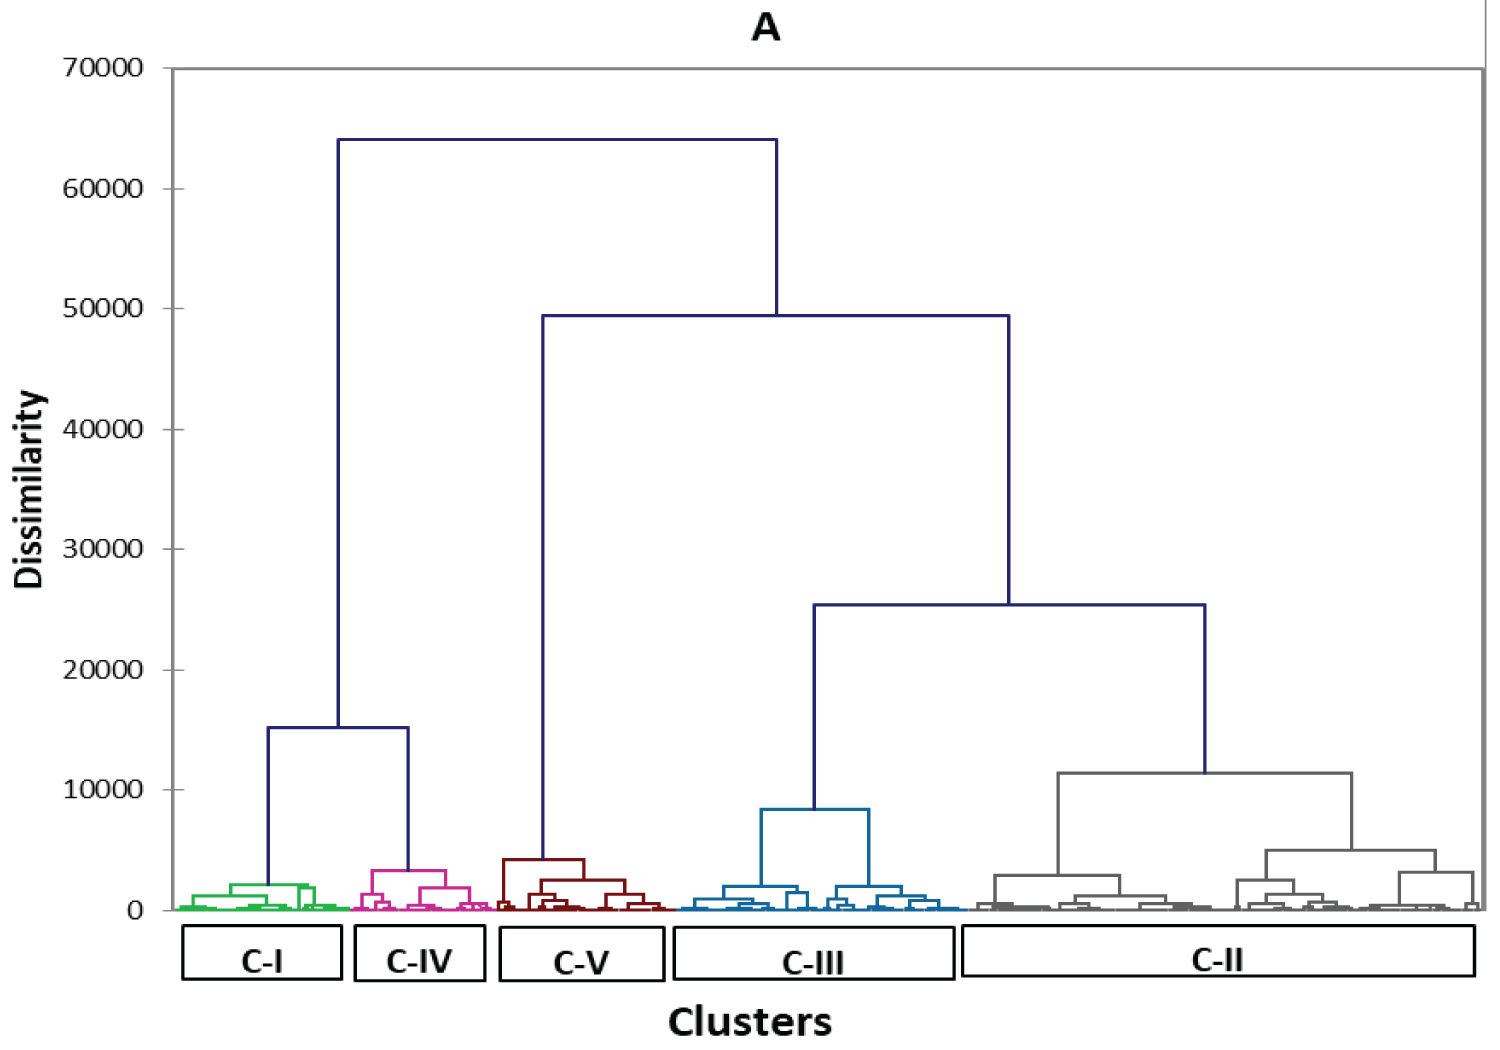
From the clustering report, 321 lowland trice genotypes were grouped into five main clusters (Figure 5 where the reported clusters (Table 5 and Table 6) contained 126 genotypes in cluster-II to 36 genotypes in cluster-I on the clustering patterns of 321 lowland rice genotypes.
An average cluster mean value of 85% days to maturity (DM) ranging from 123 to 134 days was obtained for genotypes grouped under cluster-I and-III respectively while clustering the tested lowland rice genotypes (Table 7).
The cluster mean values of plant height (PH) ranged from 63.47 cm for cluster-III to 92.33 cm for cluster IV was also recorded for the tested rice genotypes. A highest cluster mean value of panicle length (20.38 cm) and number of filled grains per panicle (127 grains) was obtained for cluster-V.
While computing the distance between the cluster centroids for each quantitative trait dissimilarity (Euclidean distance), the maximum centroid distance was obtained between cluster I and V (60.97) while clustering 321 rice genotypes (Table 8).
Cluster II, IV and V had the highest intra-cluster distances (53.64, 44.04 and 47.40 respectively) indicating that there was a high genetic diversity among the tested genotypes grouped under in these clusters.
Discussions
The analysis of variance among 321 lowland rice genotypes was computed based on the mean square values of the corresponding seven quantitative traits where the tested genotypes showed a significant variation (P ≤ 0.05) for all the measured quantitative traits directing that there was a genetic variability among the genotypes. The genotypes were highly and significantly varied on their days to 50% heading, days to 85 % maturity (DM), plant height, panicle length, number of filled grains per a panicle (NFG), number of unfilled grains per a panicle (NUFG) and 1000 seed weight (TSW). Similarly, Girma, et al. [15] reported significant differences among 64 rice genotypes on their days to heading, days to maturity and plant heigh. A significant variation for plant height and panicle length was also reported by Shrestha [25] while studying the variability of 40 rice genotypes. The variability among the newly introduced and tested genotypes was highly significant for their plant height, panicle length and 1000 seed weight were less significant for the measured traits of days to 50% heading and days to 85% maturity. However, the variability among the checks was significant only for their unfilled grains per a panicle.
Standards of grouping the rice genotypes based on their duration of physiological matirity, the rice genotypes can be classified as extra early maturing (95 days), very early maturing (96-110 days), early maturing (111-125 days), medium maturing (126-140 days) and late maturing (141 days and above) [26]. Thus, the genotypes coded as G-160 (showing the least number of days to maturity (94 days) and G-163 (showing a lesser number of days to maturity (95 days) could be classified as an extra early maturing genotype. 91 rice genotypes (with days to maturity ranging from 113-125 days) were considered as an early maturing, 180 of the genotypes showed to be medium maturing (126-140 number of days to maturity) from which those genotypes over-smarting the standard checks in their agronomic performance could be recommended for the next breeding program to be implemented in the north western and other related areas of Ethiopia since the area is characterized with a medium rainy season, whereas 48 rice genotypes were found to be late maturing with a number of days to maturity ranging from 141 to 151 days.
151 genotypes scored more than the average value of number of filled grains per a central panicle ensuring the higher probability of getting the rice genotypes with a better expected grain yield where 52 genotypes scored a higher NFG when compared to the most dominant standard check lowland land rice variety called ‘Abay' which scored a better value of 111 number of filled grains per a central panicle and 67.91 % of the genotypes had indeterminant number of unfilled grains per a central panicle which was less than and equal to the average value of the trait indicating that these genotypes had a higher predicted yield potential when compared to the best performing rice varieties among the checks directing that they will have a greater chance to be subjected to further rice breeding program focusing on grain yield as the trait of preference. A high 1000 seed weight will increase germination percentage, seedling emergence, tillering efficiency, plant population density, and grain yield [27]. Therefore, the higher 1000 seed weight for 30 lowland rice genotypes is an indication for the presence of most promising lowland rice genotypes with a better genetic advantage over the best performing standard checks for their population density, seedling vigor, tillering efficiency and yield potential.
While manipulating a principal component analysis, the principal components with an eigen value of less than a unit account for less variance than did the original variable (which had a variance of 1.00 unit), and so are of little use and usually such a component should be eliminated so that fewer components are dealt with [20,28]. In addition to the value of eigen values, the scree plot which is a simple line segment that shows the fraction of total variance in the data is also a useful visual aid for determining an appropriate number of principal components [29]. Therefore, from the principal component analysis of 321 lowland rice genotypes, the first three principal components were observed with an eigen value greater than a unit and the scree plot line after the third principal component were also almost flat indicating that those principal components were accounted for lesser amounts of the cumulative variability. Therefore, based on the eigen values of each principal components and the appearance of the scree plot, it has been confirmed that the quantitative traits with a higher loading on PC1, PC2 and PC3 contributed the most variability observed in the corresponding seven quantitative traits where a great emphasis had been given for those traits having a higher loading on the first three principal components. The correlation circle formed with a narrow angle by the vector lengths of days to 50% heading and days to 85% maturity confirmed that these quantitative traits were positively correlated with each other while correlating the first two principal components with the respective quantitative traits. It has been clearly showed that days to 50% heading, days to 85% maturity, plant height and 1000 seed weight brought a higher contribution to the total variability of PC1 (25.76%, 22.33%, 20.72% and 22.81% respectively) whereas panicle length, number of filled grains per panicle but number of unfilled grains per a central panicle showed a lower contribution to its total variability. Number of filled grains per a central panicle had a highest contribution (42.26%) to the total variability of PC2 whereas 1000 seed weight was the least contributed trait (0.27%) to this principal component. The total variability percentage of PC3 was highly contributed by number of unfilled grains per panicle (33.37%) and days to maturity (20.48%). The total variability of PC1 (23.35 %) contributed by plant height but a negative contribution of panicle length and number of filled grains per a central panicle to PC2 was reported while studding the genetic diversity of 36 upland rice genotypes in southwestern Ethiopia [24]. The greater the squared cosine, the greater the link with the corresponding principal components [14]. Hence, days to 50% heading, days to 85% maturity, plant height and 1000 seed weight were well linked with PC1 whereas panicle length, number of filled grains per a central panicle and number of unfilled grains per a central panicle were highly linked with PC2, and PC3 had relatively a higher linkage with days to 85% maturity and number of unfilled grains per a central panicle. The distribution pattern of 321 lowland rice genotypes explained by seven different quantitative traits confirmed that the genotypes were distributed in different coordinates, which clearly showed the presence of a genetic diversity among the tested rice genotypes.
From the clustering report, the lowland rice genotypes were grouped into five main clusters approving that there was a genetic variation among the tested lowland rice genotypes. An average cluster mean value of days to 85% maturity ranging from 123 to 134 days was obtained for genotypes grouped under cluster I and III respectively while clustering 321 lowland rice genotypes that indicated as there is a greater chance of obtaining medium maturing genotypes which were grouped under all these clusters. Tall varieties (104 cm and taller) are suitable for flood-prone and unleveled fields where lodging may be a problem. Medium height varieties (100 to 102 cm) are suitable for most areas and are not as susceptible to lodging when fertilizer is used. Short varieties (less than 100 cm in height) are best suited to level fields especially in irrigated areas and they are responsive to fertilizers [26]. Most lowland rice genotypes included under all the five clusters had a plant height less than 1 meter which indicated that the genotypes were relatively grouped under short rice varieties which confirmed the possibility of getting many lowlands rice genotypes which are more responsive to fertilizers and could be best suited to level fields especially in the irrigated areas. A highest cluster mean value of panicle length (20.38 cm) and number of filled grains per a central panicle (127 grains) was obtained for cluster-V directing that genotypes with the better expected grain yield potential could be obtained from this cluster when compared to genotypes in other clusters while considering the fact that the rice plant yield could be determined by indirect traits like panicle length and lower number of unfilled grains per a central panicle as well as direct traits like filled grains per a central panicle and 1000-seed-weight [30]. Therefore, a better attention could be given for those genotypes included under cluster-V while considering grain yield as the primary breeding objective.
Inter cluster distance is the main criterion for selection of the genotypes implying that the genotypes belonging to clusters with maximum inter cluster distance are genetically more divergent suggesting that selection of genotypes should be based upon large cluster distances, which may lead to broad spectrum of favorable genetic variability [31]. Therefore, in this study it was confirmed that selection of genotypes for improvement of traits of interest will be focused on genotypes grouped under cluster-I and cluster-V.
Conclusions and Recommendations
Since a highly significant wide range of variation among the newly introduced and tested lowland rice genotypes was observed on their plant height, panicle length and 1000 seed weight these highly preferable rice characteristics must be considered while selecting the materials for the next rice breeding research program with a lesser attention for their days to 50% heading and 85% days to maturity which were contributing a less significant variation for the genotypes. The distribution plot where the tested rice genotypes grouped into different quadrant indicates the presence of genetic diversity among the tested lowland rice genotypes and number of filled grains per a panicle, days to 50% heading, days to 85% maturity, plant height and 1000 seed weight contribute to the highest total variability of the genotypes. The total variability percentage of the tested lowland rice genotypes is less contributed by number of unfilled grains per a panicle. Such a result that the total variability of each significant principal components contributed by different quantitative traits predicts the presence of a genetic diversity among the tested rice genotypes.
The clustering analysis results with three different five clusters also confirms the presence of a genetic diversity among the tested rice genotypes. The cluster mean value of days to 85% maturity ranging from 123 days to 134 days for cluster-I and cluster-II respectively indicates that there is a greater chance of obtaining medium maturing rice genotypes under all the five clusters.
From the descriptive statistical analysis, a total of 180 rice genotypes shows to be medium maturing with days to maturity ranging from 126-140 days from which, the genotypes over-smarting the standard checks could be recommended for the next breeding program to be implemented in those area with a medium rain fed cropping season. The finding of two rice genotypes with a maturity duration of 94 days for genotype coded as G-160 and 95 days for genotype coded as G-163 confirms that there is a possibility to develop two highly promising irrigated rice varieties.
The result that a higher number of filled grains per a panicle (NFG) for 52 rice genotypes when compared to the better performing standard check called ‘Abay' indicates that there is a possibility of obtaining promising rice genotypes with a higher predicted yield potential with a greater chance to be subjected to further rice breeding program focusing on grain yield as the trait of preference. In addition, a better 1000 seed weight (TSW) values scored by 30 genotypes while comparing to a standard check called ‘Ediget' also provides a hint for the presence of most promising rice genotypes with a better genetic advantage for their population stand, seedling vigor, tillering efficiency and yield potential. Thus, it is recommended that an attention should be given for those genotypes with a greater value of number of filled grains per panicle, 1000 seed weight but with a lower number of unfilled grains per panicle while selecting genotypes for improving the desired traits of the genotypes to be implemented in the rice breeding research program.
Acknowledgement
We acknowledge the researchers who are working as a rice breeder at Pawe Agricultural Research Center (PARC) and Fogera National Rice Research and Training Center (FARTC). The technical staff of Pawe Agricultural Research Center has also appreciated for their generous participation in collecting the phenotypic data and managing the overall activities of this rice breeding trial. Gratitude will also go to the Ethiopian Institute of Agricultural Research (EIAR) for its full financial support. We also thank IRRI and Africa Rice research project for their support in providing the seeds of the tested lowland rice genotypes.
References
- Mudasir H, Zahoor A, Sher A (2015) Breeding strategies for improving rice. Agricultural Sciences 6: 467-478.
- Dawit Alemu (2015) Rice in Ethiopia: Progress in production increase and success factors. A report on 6th CARD (Coalition for Africa Rice Development) general meeting.
- Astewel Takele (2017) Determinants of rice production and marketing in low producer farmers: The Case of Fogera district, north-western Ethiopia. International journal of environment, agriculture and biotechnology2: 2534-2545.
- http://www.ricehub.org/.
- Dawit A, John T (2020) The emerging importance of rice as astrategic crop in Ethiopia. Working Paper 44, Future Agricultures Consortium, Brighton.
- Abebaw D (2020) Rice breeding achievements, potential and challenges in Ethiopia. International Journal of Research Studies in Agricultural Sciences (IJRSAS) 6: 35-42.
- Alemu D (2019) A historical analysis of rice commercialisation in Ethiopia: The case of the fogera plain. APRA brief 16, Future Agricultures Consortium.
- CSA (2021) The Federal democratic republic of ethiopian central statistical agency agricultural sample survey 2020/21 (2013). Statistical report, the federal democratic republic of ethiopian central statistical agency, Addis Ababa.
- Syafii M, Cartika I, Ruswandi D (2015). Multivariate analysis of genetic diversity among some maize genotypes under maize-albizia cropping system in Indonesia. Asian Journal of Crop Science 7: 244-255.
- Bhattarai U, Subudhi PK (2019) Genetic diversity, population structure, and marker-trait association for drought tolerance in US rice germplasm. Plants 8: 530.
- Gedifew G, Tsige G (2019) Morphological characterization and evaluation of sorghum [Sorghum bicolor (L.) Moench] land races in Benishangul Gumuz, North-western Ethiopia. Greener Journal of Agricultural Sciences 9: 37-56.
- SAS Institute Inc (2019) SAS/STAT® 9.4 User’s Guide. SAS Institute Inc, Cary, NC, USA.
- Federer WT (1961) Augmented designs with one-way elimination of heterogeneity. Biometrics 17: 447-473.
- IRRI (1984) International Rice Research Newsletter. Manila, Philippines.
- https://help.xlstat.com/s/article/principal-component-analysis-pca-in-excel?language=en_US
- Girma BT, Kitil MA, Banje DG, et al. (2018) Genetic variability study of yield and yield related traits in rice (Oryza sativa L.) genotypes. Adv Crop Sci Tech 6: 381.
- Dev Nidhi Tiwari, Santosh Raj Tripathi, Mahendra Prasad Tripathi, et al. (2019) Genetic variability and correlation coefficients of major traits in early maturing rice under rainfed lowland environments of Nepal. Advances in Agriculture.
- Adhikari BN, Joshi BP, Shrestha J, et al. (2018) Genetic variability, heritability, genetic advance and correlation among yield and yield components of rice (Oryza sativa L.) . Journal of Agriculture and Natural Resources 1: 149-160.
- Chakma SP, Huq H, Mahmud F, et al. (2012) Genetic diversity analysis in rice (Oryza sativa L.). Bangladesh J Pl Breed Genet 25: 31-39.
- Atsedemariyam T, Wassu M, Alemayehu A (2019) Genetic diversity analysis of upland rice (Oryza Sativa L.) genotypes in benshangul gumuz, Ethiopia. International Journal of Research Studies in Agricultural Sciences (IJRSAS) 5: 22-28.
- Shaibu AA, Uguru MI (2017) Application of multivariate analysis to access selected rice germplasm phenotypic diversity. Journal of Experimental Agriculture International 16: 1-8.
- Altaye T, Wosene G, Abush T (2019) Genetic diversity study on upland rice (Oryza sativa L.) genotypes based on morphological traits in southwestern Ethiopia. Asian journal of crop science 11: 17-24.
- Alamir A, Tiegist D, Fisseha W (2020) Genetic divergence analyses of lowland rice genotypes in North Western Ethiopia. African Journal of Plant Science 14: 165-171.
- Maji AT, Shaibu AA (2012) Application of principal component analysis for rice germplasm characterization and evaluation. Journal of Plant Breeding and Crop Science 4: 87-93.
- Mahendran R, Veerabadhiran P, Robin S, et al. (2015) Principal component analysis of rice germplasm accessions under high temprature stress. International Journal of Agricultural Science and Research (IJASR) 5: 355-360.
- Shrestha J, Subedi S, Kushwaha UKS, et al. (2021) Evaluation of growth and yield traits in rice genotypes using multivariate analysis. Heliyon 7: e07940.
- Moshatati A, Gharineh M (2012) Effect of grain weight on germination and seed vigor of wheat. International Journal of Agriculture and Crop Sciences 4: 458-460.
- Jain S, Patel P (2016) Genetic diversity and principle component analyses for fodder yield and their component traits in genotypes of forage sorghum (Sorghum bicolor L. Moench). Annals of Arid Zone 55: 17-23.
- Mbe OJ, Saraswathi R, Jeyaprakash P, et al. (2019) Valuation of genetic diversity for quantotatove traits in rice (Oryza sativa L) genotypes. Nigerian Agricultural Journal 50: 200-207.
- Ronghua L, Meijuan L, Umair A, et al. (2019) Exploring the relationships between yield and yield-related traits for rice varieties released in China from 1978 to 2017. (T. Miedaner, Ed.) Front Plant Sci 10: 1-12.
- Singh RK, Dubey BK, Gupta RP (2013) Intra and inter cluster studies for quantitative traits in garlic (Allium sativum L). SAARC J Agri 11: 61-67.
Corresponding Author
Gedifew Gebrie. Pawe Agricultural Research Center, Ethiopian Institute of Agricultural Research, Pawe, Ethiopia, Tel: +251-94-645-4437, Fax: +251585500272.
Copyright
© 2022 Gedifew G and Desta A. This is an open-access article distributed under the terms of the Creative Commons Attribution License, which permits unrestricted use, distribution, and reproduction in any medium, provided the original author and source are credited.