School-Based COVID-19 Case Growth Rates in the US, What a Crowdsourced Dataset Can Tell Us
Abstract
Importance: Different reopening plans were implemented to bring students back to schools in anticipation of school-related COVID-19 outbreaks. The hybrid reopening plan was considered a medium-risk option to mitigate greater risk than in-person and remote reopening plans. In the absence of an official in-school transmission surveillance system and the relevant data, whether hybrid reopening plan could protect students and decrease in-school transmission rates remains unknown.
Objective: To estimate the case growth rates of the school districts chose remote and hybrid reopening plans compared with those chose in-person reopening plans.
Design, setting, and participants: Using a validated crowdsourced dataset maintained by the National Education Association, we grouped 742 school districts in 49 states reopened between August 10, 2020 and November 12, 2020 into hybrid (46%), remote (15%), and in-person (40%) reopening plans. We used a retrospective cohort design with the three reopening plans as the exposures to assess area-risk factors and the COVID-19 case growth rates by different reopening plans.
Main outcomes and measures: Factors associated with choosing remote, hybrid, and in-person reopening plans and the case growth rates among the three reopening plans.
Results: School districts with a low proportion of white students, a high background risk, in an urban county, or with a Democratic governor, were more likely to choose remote or hybrid than in-person reopening plans. With the in-person reopening plan in referent, the odds ratios of the case growth rates for remote and hybrid reopening plan were 0.988 (95% CI: 0.986-0.989) and 1.014 (95% CI: 1.013-1.015), respectively. The consistent results were found among school districts with a high background risk.
Conclusions: School districts reopened with the hybrid reopening plan had higher case growth rates among low and high background risk areas than those reopened with the in-person plan. In-person reopening plan may be a better option than hybrid reopening plan as far as the COVID-19 case growth rates in the beginning of the semester are concerned.
Keywords
Crowdsourced data, COVID-19, School reopening, Case growth rate, Hybrid
Introduction
In Mid-March of 2020, all K-12 public schools in the US were closed due to the Coronavirus Disease 2019 (COVID-19) pandemic. School closures had an immediate effect on the labor market [1] and might lead to more profound influences to the Unites States. A study indicated that 35.2% US adults had direct or within-household connections to elementary or secondary schools [2]. At least 55 million students from over 120,000 schools had been affected by closures since March 2020 [1]. In addition, despite its impacts on COVID-19 transmission and the labor market, school closure could also affect the development of children. The studies reported that the fully remote learning plan had negative impacts on the mental health and the behavioral development of children [3,4], though it might eliminate the school-based COVID-19 transmission.
To balance the advantages and disadvantages of the effects of school closures, a hybrid reopening plan was brought in, which alternated remote learning and in-person learning by separating a class into two groups, with each group takes in-person learning two days a week and a hygiene day in between. The hybrid learning plan is a logic alternative reopening option of the fully remote learning plan, as it can facilitate non-pharmaceutical measures to necessary extents and alleviate the disadvantages of the remote learning plan. Both the Centers for Disease Control and Prevention (CDC) [3] and the American Academy of Pediatrics (AAP) [5] recommended reopening K-12 schools with an in-person component. Therefore, in the preparation of reopening K-12 public schools for the fall 2020 in the US, there were three reopening plans: remote reopening plan, hybrid reopening plan, and in-person reopening plan [3]. Based on our statistics, school reopening policies were adopted differently across the school districts. The majority of large school districts in the US reopened with remote reopening plan (e.g., school districts in Atlanta, Chicago, Houston, Los Angeles, Las Vegas, Phoenix, San Diego, San Francisco) [6], while in many school districts located in the rural areas recommended in-person reopening plan or they did not provide a school reopening plan [7].
According to our previous study [8], higher case growth rates were seen in some school districts implemented hybrid reopening plan compared to those implemented remote reopening plan. School reopening with in-person component could increase the risk of school-based transmissions, and ignite COVID-19 outbreaks in K-12 schools [9,10]. In fact, new pediatric COVID-19 cases did increase rapidly in October 2020 in the US after school reopening [11-13]. However, we could not simply attribute the increase of pediatric case to in-person learning alone, because children could infect and transmit COVID-19 in both schools and communities [14-16]. When adding the background risk of COVID-19 transmission, the contribution of the school reopening plan to case growth rates in that school district became uncertain.
To evaluate the influence of the school reopening plans on the COVID-19 transmission in each school district, we analyzed the National Education Association (NEA) COVID-19 outbreak datasets, which were consolidated from varies individual crowdsourced data collection efforts. Lacking detailed information from the federal and local governments, crowdsourced data had become more important in the COVID-19 related studies, such as assessments of COVID-19 related demographics, mental health, and perceived severity [17-19]. The NEA hosted a hub for educators to report the numbers of COVID-19 cases by student, staff, and other categories within a school. The NEA verified and validated the reports, and integrated them to the crowdsourced datasets. Therefore, the datasets we obtained from the NEA could be considered reliable.
In general, school district enrollment factors, county-level factors, and state-level factors could affect the school reopening plans. Thus, they may also lead to the changes in the COVID-19 case growth rates. In this study, we included racial distribution (indicated by the proportion of white students) to represent the district enrollment factor, because CDC had recognized significant race and ethnicity disparities with respect to COVID-19 infections, hospitalizations, and deaths [20]. We also included two factors as the county-level factors, which are community background risk (infected case per 1,000 people) and the locations of school districts (in the metropolitan area, yes or no). As we mentioned above, community exposure of COVID-19 could also increase children's risk of being infected. However, community-based risk could not be estimated in the rural areas. Therefore, we included the factor, which was whether the school district was located in the metropolitan area, to indicate the socioeconomic conditions in that area. These two factors together could better demonstrate the background infection risks at the county-level. For state-level factor, we included the party of the state (democratic or republican), for the school district. Because the two parties tended to differ in school reopening plans: the Republican governors supported to reopen the school as soon as possible; the Democrat governors preferred to let children to study at home [21].
In this study, we employed these factors as control variables to the regression models to examine how case growth rate varied with three school reopening plans, and consequently find out which one was the most effective plan in terms of COVID-19 mitigation.
Method
Data and sample
Two types of data were used in this study, the school-based COVID-19 outbreak data, and the school reopening plan data. The data included in the study were between August 10 and November 12, 2020. The school-based COVID-19 outbreak datasets were downloaded from the NEA School and Campus COVID-19 Reporting Site [22]. We integrated and de-duplicated these datasets for our study period. The school reopening plan data were mainly extracted from the Education Week's dataset, which had 2020 Fall semester school reopening plans, school start dates, and last verified dates of 901 school districts [23]. We deterministically linked the Education Week's reopening plan dataset with the NEA's dataset using school name, school district, city, and state. If a reporting school could not be linked, we manually retrieved the school reopening plan from the school's official website and the local news.
According to the NEA, the definitions of the three major school reopening plans were described as follow: (1) The remote reopening plan refers to 100% remote or distance learning (all students take online courses 5 days a week, except students who get permit to take in-person classes); (2) The hybrid reopening plan refers to the majority of students received alternate in-person and remote reopening plan (2 days in-person learning and 3 days online courses, also called blended reopening plan); and (3) The in-person reopening plan is that all students can choose a fully in-person learning option (5 days a week physically present in school). For the consistent analysis and data interpretation, we used a school reopening plan implemented on the first school day.
Empirical strategy
To analyze the COVID-19 cases over time, we pooled all confirmed COVID-19 cases together by date, and also by school district, which is because most reopening plans were developed at the school district level. In order to detect the increase or decrease trends as well as to maintain the modelling stability and validity, we included school districts in the analyses based on the following criteria: (1) The school district must have more than one date of entry with at least one positive case; and (2) The initial case entry cannot be missing or zero. The final analyzable sample included 742 school districts from 49 states, and covered 3,400 schools. No school district from the State of New Mexico and the District of Columbia were included, due to no eligible entry. We further validated the final sample with a national sample survey hosted by Emily Oster at Brown University (Appendix), which was updated bi-weekly [24]. The enrollment data for the validation in our study were extracted from the 2018-2019 National Center for Education Statistics [25] by hybrid and in-person reopening plans from August 31 to October 25, 2020 - the same as the presented study data with Emily Oster's COVID-19 School Response Dashboard. The number of confirmed cases at baseline from all eligible school districts was 2,364. On average, the case reporting frequency was 3.74 entry points (dates) per school district.
Statistical analysis
We categorized the school districts by three school reopening plans, and summarized the total cases, mean cases, proportion of race/ethnicity, and geographical and administrative characteristics for overall and each plan. The statistical results are shown in Table 1. We used a multinomial logistic model to calculated crude odds ratios (cORs) and adjusted odds ratios (aORs), and 95% confidence intervals (CIs) between each covariate and three school reopening plans. School districts implemented in-person reopening plan were selected as the reference group. The control covariates included the proportion of white students, county-level background risk of the school district (infected case per 1,000 people), metropolitan (yes or no), and the party of the state where the school district located in (democratic or republican.) After reporting cORs for each covariates, we included statistically significant covariates in the final adjusted multinomial logistic regression model. Results are showed in Table 2.
Then we used Poisson regression in our second analyses which included three models. In the Model 1, we modeled the overall cumulative case count indexed by school-districts. In the Model 2, we re-performed Model 1 for each background risk group separately. In the Model 3, we performed the regression for low, medium, and high background risk school districts separately included same variables (Date, Plans, interaction term of Date and Plans, Metropolitan, and State) used in the Model 2. In this retrospective cohort study, the reopening plan was the main independent variable, and case growth rates were the main outcomes [26,27]. The purpose of performing three models in this step was to check whether the main result would still valid in each level of the Background Risk. The multinomial logistic regression model was perform using R version 4.0.2 [28]. The rest of statistical analyses were performed using SAS 9.4 (SAS Institute Inc, Cary, NC). The outcome analyses were conducted at a two-sided 5% level; thus, all presented CIs will be 95% CIs, and p-value < 0.05 were considered as statistically significant.
The following function shows the models we performed:
Where case count was indexed by three reopening plans (i) and dates (t). The Plan variable had three categories superscripted β1 (i = 1 to 3 for remote, hybrid, and in-person); its main effects captured case levels with the in-person as reference. Date was the number of days since school reopened, which indexed the cumulative cases by entry dates (t). The interaction term, Plan*Date, was our main interest, which captured case growth rate differentials according to the three reopening plans. All the other variables were control variables. The Background Risk Level indexed by j, which was calculated as the seven-day-average COVID-19 confirmed cases per 1,000 people in the county where a school district located, and then divided into tertiles, which were low (lower than 8.5 cases per 1,000 people), medium (8.5 to 14.5 cases per 1,000 people), and high (more than 14.5 cases per 1,000 people). The Metropolitan variable had two categories, which were metropolitan county and other county. The State variable was included in the models to control for state-level enrollments and statewide plans with 48 fixed effects in the reference to the grand mean or α for the first state (j = 1 to 49).
Result
The baseline descriptive statistics showed in Table 1. Among the 2,364 COVID-19 cases, 397 cases were from the remote reopening plan, 898 were from the hybrid reopening plan, and 1,069 were from the in-person reopening plan. The remote reopening districts had the highest mean confirmed cases, which was 3.64, followed by the in-person (3.62) and the hybrid (2.66) reopening districts. The remote reopening districts had lower proportion of white students (56%), compared to the in-person (68%) and hybrid (71%) reopening districts.
The statistics of school districts in the aspects of background risk level, metropolitan status, and state governor's party affiliation were also shown in Table 1. Among all school districts, 46% adopted the hybrid reopening plan, 40% adopted the in-person reopening plan, and only 15% adopted the remote reopening plan. Districts in high background risk level showed the similar distribution pattern to the overall result that the hybrid reopening plan was in the dominant role (51%), the remote reopening plan accounted for the least, except that the difference between the in-person reopening plan (29%), and the remote reopening plan (20%) were much smaller than the others. The proportions in districts with low and middle background risk levels both increased from the remote plan to in-person plan, and then to hybrid plans. Most metropolitan school districts (50%) chose to reopen with a hybrid plan, while only 28% of non-metropolitan areas chose this plan. On the other hand, most non-metropolitan school districts (61%) chose the in-person plan, while the proportion was 34% for the metropolitan school districts. The remote plan was the least chosen by both metropolitan (16%) and non-metropolitan school districts (11%). The adopted learning plans were distributed differently in terms of state governor's party affiliations, which were the Democratic Party and the Republican Party. In the Democratic states, the hybrid plan (54%) was dominant, while in the Republican states, the in-person plan (52%) was dominant. The lack of consistency among three plans with regard to the background risk levels suggested that our separate analysis strategy in the Model 3 was warranted.
The results of multinomial log it estimates of factors, which are the proportions of white students, background risk level, non-metropolitan area, and state governor's party being Democratic, associated with the reopening plans were shown in Table 2. Results showed that the school districts with a lower proportion of white students (aOR = 0.16, 95% CI: 0.05-0.47), a high background infection risk (aOR = 1.05, 95%: 1.02-1.08), in metropolitan area (aOR = 1.89, 95% CI: 1.04-3.45), and in the Democratic states (aOR = 2.41, 95% CI: 1.49-2.82) were more likely to choose remote reopening plan than in-person reopening plan. Similar results were found for hybrid reopening plan that higher background infection risk (aOR = 1.04, 95% CI: 1.01-1.07), in metropolitan areas (aOR = 2.78, 95% CI: 1.82-4.23), and in Democratic states (aOR = 2.84, 95% CI: 2.00-4.03) were more likely to choose the hybrid reopening plan than the in-person reopening plan, except that higher proportion of white student(aOR = 2.27, 95% CI: 0.94-5.46) was significantly associated with the hybrid reopening plan.
The overall log-growth rates (Model 2) for the three reopening plans and the ORs were shown in Table 3. Both the hybrid reopening plan (4.2%) and the in-person reopening plan (2.8%) districts had greater growth rates than the remote reopening districts (1.6%). The aORs of remote and hybrid reopening plan were 0.988 (95% CI: 0.986-0.989) and 1.014 (95% CI: 1.013-1.015), respectively.
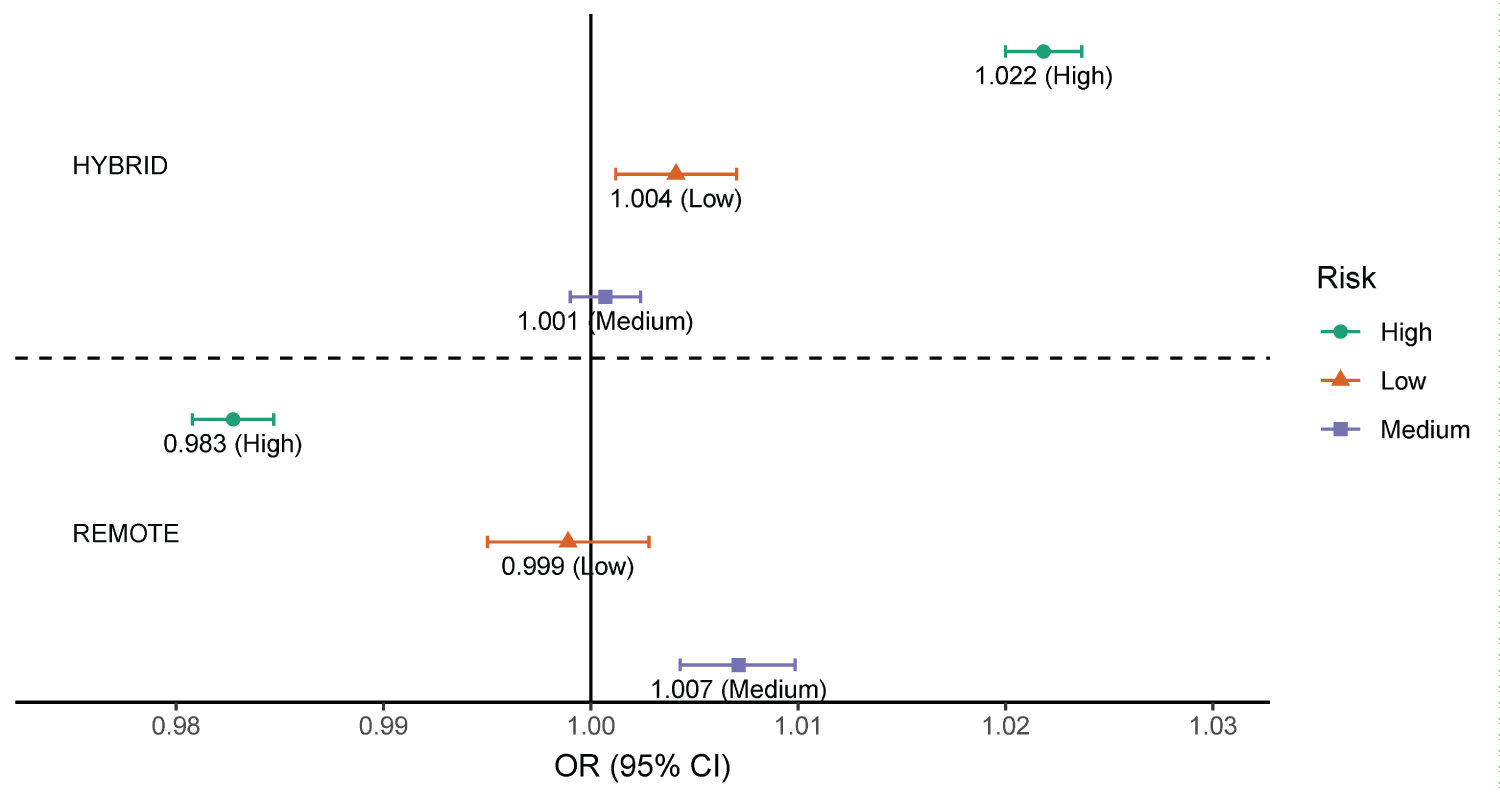
The results of the Model 3 were shown in Figure 1, which evaluated the effects of hybrid and the remote reopening plans on the cumulative case growth rates to the in-person reopening plan as reference in different background risk areas. In the high risk districts, the hybrid reopening plan, had a positive association with (aOR = 1.022, 95% CI: 1.020-1.024) the cumulative case growth rates, while the remote learning plan had a negative association (aOR = 0.983, 95% CI: 0.981-0.985) compared to the in-person plan. In the low risk districts, the hybrid reopening plan had a positive association with the case growth rate (aOR = 1.004, 95% CI: 1.001-1.007.).
Discussion
Our results indicated the COVID-19 growth rate was highest in the hybrid reopening plan, and the lowest in the remote reopening plan. All the models were adjusted for the county-level COVID-19 background risk and the metropolitan status. There could be the potentially heterogeneous effects from state-level policies, school reopening policies, and COVID-19 restrictions. It was possible that school districts chose the hybrid reopening plan because of the relatively high COVID-19 background risk. In this context, the interaction between the community-based transmissions during off-school days and the school-based transmissions during school days could be a major contributing factor contributing to the case growth rates. Therefore, although statewide school closure was effectively implemented [3,6,29,30], school reopening should be carefully evaluated because of the complexity in transmission dynamics among households and communities [31]. We confirmed that the remote reopening plan reduced the school-based transmission, but the hybrid reopening plan with a reduced class cohort strategy was not better than in-person plan. It is highly plausible that students studied elsewhere exposed to higher risk of infection during their off-school days than they were in schools. Non-pharmaceutical measures in both schools and community learning settings, as well as community-specific demographics could contribute to the school-based transmission.
We set the context by examining areal factors associated with each plan during the evaluation of the three reopening plans, and some factors would need further discussions. Though race should not be a fact in school reopening plan, school districts that adopted the hybrid reopening plan were more likely to have higher proportions of white students, and lower mean of cases. This phenomenon could be due to racial disparities that African Americans and Non-White Hispanics were more likely to be infected with COVID-19 [20,32,33]. Our results showed that school districts from the Republican states had significantly higher proportion of choosing in-person reopening plan than the hybrid or remote reopening plan. A survey of US adults illustrated that more than 80% of Democrats thought reopen with in-person plan would bring risk to teachers and students; however, only 35% Republicans thought it would bring risk [34]. Based on another survey from Gallup conducted on July 2020, 68% of Republican parents preferred to send children to fully in-person learning schools compared to Democrats parents (11%) [35]. Not only the parents, but also some of the Republican governors and the former President Trump struggled to bring students back to five-day in-person instruction [21]. These survey results and parties' disagreements supported our finding that Republican states were more likely to choose in-person reopening plan than the Democrat states because more republican supporters were in those states.
Crowdsourced data used in this study can be a timely complement [36] for the study of school related COVID-19 outbreaks, because there were no official COVID-19 school-based surveillance system or data in the US. The crowdsourced data in the current study were initiated by volunteers in the summer of 2020, and NEA consolidated the data and made them available to the public two months after the school reopened in fall semester of 2020. The results could help the evaluation of the reopening plans, the policy development in the subsequent years, and the response to future pandemic. In fact, the Open COVID-19 Data Working Group, co-led by the Oxford Martin Programme on Pandemic Genomics, opted to endorse a crowdsourced data approach based on the experience from the past pandemics [37]. The sample size in our study was fairly large and was consistent with a sample survey in terms of COVID-19 cases per 100,000 people along the main dimension.
There are some limitations in this study. First, although it was not our main focus, variables associated with reopening plans in the multinomial logistic regression model could be further expanded. Second, the data quality limited us from analyzing this crowdsourced data more precisely. Because NEA could not validate the first entries in some school districts, 117 out of 859 school districts were excluded from our analyzable dataset. Third, the remote reopening plan could only be applied in the school settings. Students could congregate in other community-based learning sittings (e.g., churches, Young Men's Christian Association), which might result in community-based transmissions among school children. Fourth, school districts could change their reopening plans according to the background risks and other observed COVID-19 infection dynamics; and these changes could not be captured in this study. Future studies should incorporate changes in learning plans. It would be helpful if age-specific community infection rates over time can be used to validate the representativeness of the corresponding local entries. The findings based on hundreds of school districts in 49 states can serve as data points for future studies.
Conclusion
Based on the crowdsourced data in the US, this study showed that a lower proportion of white students, a higher background infection risk, a metropolitan school district, or Democratic control states had higher probabilities to choose remote and hybrid reopening plans than in-person reopening plan. In addition, the COVID-19 case growth rates among school districts chose hybrid reopening plan was higher than those chose remote and the in-person reopening plans. The results were broadly consistent with each background risk category. Moreover, the case growth rates of hybrid reopening plan districts were significantly higher than the case growth rates of the in-person reopening plan districts in both high background risk and low background risk. School districts with high background risk mainly contributed to the overall low case growth rate in the remote reopening plans. We were cautious about our results because the limitations of the crowdsourced data should not be ignored.
Conflict of Interest
The Authors declare that there is no conflict of interest.
References
- DeAngelis CA, Makridis C (2021) Are school reopening decisions related to union influence? Social Science Quarterly 102: 2266-2284.
- Selden TM, Berdahl TA, Fang Z (2020) The risk of severe COVID-19 within households of school employees and school-age children: Study examines how often persons at risk of severe COVID-19 were connected to schools, either as employees or by living in the same households as school employees or school-age children. Health Aff 39: 2002-2009.
- (2020) Preparing for a Safe Return to School. Centers for Disease Control and Prevention.
- Capaldi DM, Knoble NB, Shortt JW, et al. (2012) A systematic review of risk factors for intimate partner violence. Partner Abuse 3: 231-280.
- (2020) COVID-19 Guidance for safe schools and promotion of in-person learning. American Academy of Pediatrics.
- Grayer A (2020) Several big US school districts are extending remote classes into the fall, CNN.
- (2020) School reopenings in the 2020-2021 academic year after the coronavirus (COVID-19) pandemic. Ballotpedia.
- Liu D, Lin G, Sun X, et al. (2021) Different school reopening plans on Coronavirus disease 2019 case growth rates in the school setting in the United States. J Sch Health 91: 370-375.
- Michaud J, Kates J (2020) What do we know about children and Coronavirus transmission? KFF.
- Santora T (2020) Here are the more than 850 schools that already have COVID cases. Fatherly.
- (2020) Children and COVID-19: State-level data report. American Academy of Pediatrics.
- (2020) How to protect yourself & others. Centers for Disease Control and Prevention.
- (2020) Considerations for wearing masks. Centers for Disease Control and Prevention.
- Lopez AS, Hill M, Antezano J, et al. (2020) Transmission dynamics of COVID-19 outbreaks associated with child care facilities-Salt Lake City, Utah, April-July 2020. Morbidity and Mortality Weekly Report 69: 1319.
- Stein-Zamir C, Abramson N, Shoob H, et al. (2020) A large COVID-19 outbreak in a high school 10 days after schools' reopening, Israel, May 2020. Eurosurveillance 25: 2001352.
- Qiu H, Wu J, Hong L, et al. (2020) Clinical and epidemiological features of 36 children with coronavirus disease 2019 (COVID-19) in Zhejiang, China: An observational cohort study. Lancet Infect Dis 20: 689-696.
- Sun K, Chen J, Viboud C (2020) Early epidemiological analysis of the coronavirus disease 2019 outbreak based on crowdsourced data: A population-level observational study. The Lancet Digital Health 2: e201-e208.
- Shauly O, Stone G, Gould D (2020) The public's perception of the severity and global impact at the start of the SARS-CoV-2 pandemic: A crowdsourcing-based cross-sectional analysis. J Med Internet Res 22: e19768.
- Barzilay R, Moore TM, Greenberg DM, et al. (2020) Resilience, COVID-19-related stress, anxiety and depression during the pandemic in a large population enriched for healthcare providers. Translational Psychiatry 10: 1-8.
- (2021) COVID-19 racial and ethnic health disparities. Centers for Disease Control and Prevention.
- Weigel D (2021) Republicans unite around a message - schools should reopen, and Democrats are to blame. The Washington Post.
- (2020) USA COVID-19 K-12 school closures, quarantines, and/or deaths. National Education Association.
- (2020) School districts' reopening plans: A snapshot. Education Week.
- Oster E (2020) National COVID-19 school response dashboard.
- (2020) Elementary/secondary information system. National Center for Education Statistics.
- Lin G, Zhang T, Zhang Y, et al. (2020) Statewide stay-at-home directives on the spread of COVID-19 in metropolitan and nonmetropolitan counties in the United States. J Rural Health 37: 222-223.
- Lyu W, Wehby GL (2020) Community use of face masks and COVID-19: Evidence from a natural experiment of state mandates in the US: Study examines impact on COVID-19 growth rates associated with state government mandates requiring face mask use in public. Health Aff 39: 1419-1425.
- Team RC (2013) R: A language and environment for statistical computing.
- Kim L, Whitaker M, O'Halloran A, et al. (2020) Hospitalization rates and characteristics of children aged < 18 years hospitalized with laboratory-confirmed COVID-19-COVID-NET, 14 States, March 1-July 25, 2020. MMWR Morb Mortal Wkly Rep 69: 1081.
- Auger KA, Shah SS, Richardson T, et al. (2020) Association between statewide school closure and COVID-19 incidence and mortality in the US. JAMA 324: 859-870.
- Han MS, Seong MW, Kim N, et al. (2020) Viral RNA load in mildly symptomatic and asymptomatic children with COVID-19, Seoul, South Korea. Emerg Infect Dis 26: 2497.
- Reitsma MB, Claypool AL, Vargo J, et al. (2021) Racial/ethnic disparities in COVID-19 exposure risk, testing, and cases at the subcounty level in California: Study examines racial/ethnic disparities in COVID-19 risk, testing, and cases. Health Aff 40: 870-878.
- (2021) Health equity considerations and racial and ethnic minority groups. Centers for Disease Control and Prevention.
- Horowitz JM (2020) Republicans, democrats differ over factors K-12 schools should consider in deciding whether to reopen, Pew Reserarch Center.
- Jones JM (2020) Fewer U.S. parents want full-time in-person fall schooling, GALLUP.
- Leung GM, Leung K (2020) Crowdsourcing data to mitigate epidemics. Lancet Digital Health 2: e156-e157.
- Vespignani A, Tian H, Dye C, et al. (2020) Modelling covid-19. Nature Reviews Physics 2: 279-281.
Corresponding Author
Ge Lin, PhD, Urban Governance and Design Thrust (UGOD), Hong Kong University of Science & Technology (GZ), Tel: (852) 6120 1183.
Copyright
© 2022 Liu D, et al. This is an open-access article distributed under the terms of the Creative Commons Attribution License, which permits unrestricted use, distribution, and reproduction in any medium, provided the original author and source are credited.