A Comparative Assessment of the Potential of the Bakken Formation Oil and Gas Field Produced Water for Critical Mineral Extraction, with a Focus on the Inyan Kara Formation: An Analysis of Salinity and Infrastructure
Abstract
This study compares the salt concentration and mineral composition of water from the Bakken Formation and the Inyan Kara Formation to assess their suitability for salt/critical minerals extraction. The results reveal that the Bakken Formation exhibits significantly higher levels of dissolved solids, calcium, magnesium, and chloride compared to the Inyan Kara Formation, indicating its potential suitability for salt/critical elements extraction. Conversely, the Inyan Kara Formation water displays higher bicarbonate concentrations, which may limit its applicability in certain salt extraction processes. The Bakken Formation proves more viable for water production due to its existing oil and gas infrastructure and abundant produced water from active and abandoned oil wells. This availability of produced water wells reduces the cost of critical mineral extraction and presents opportunities for water reuse or critical minerals sale, generating additional revenue that could offset recycling and disposal costs. In contrast, the absence of water production wells in the Inyan Kara Formation hinders its economic feasibility for salt/mineral extraction. The Inyan Kara Formation has a higher volume of water, but its lower salt content limits its usefulness for some purposes, especially in the energy industry for recovering rare earth minerals. Considering the higher mineralization, the concentration of key ions, and the presence of water production infrastructure, the Bakken Formation emerges as a more favorable choice for critical mineral extraction. However, factors like environmental impact and extraction costs should be considered in determining the most suitable formation. Despite data limitations, the study utilizes a valuable database to identify regional variations in salt concentrations for critical mineral extraction.
Keywords
Critical minerals, Salt concentration, Dissolved solids, Hydraulic fracturing, Produced water
Introduction
In the Bakken field, enormous amounts of water are produced along with the oil, so it is necessary to separate the oil and dissolved essential elements from the water. The volume of produced water during water flooding in the majority of petroleum reservoirs is insufficient to effectively recover the extra petroleum. The petroleum reservoir must therefore be supplemented with additional water. In order to create the fractures and flow channels required for the extraction of oil and gas from rocks with extremely poor permeability, hydraulic fracturing involves injecting a mixture of primary water with minor amounts of various additives under high pressure into the deep formations. When using supplemental water, the produced water must be blended with it to make a chemically stable mixture in order to prevent the formation of clogging solids. More than 17,500 wells have been drilled in North Dakota's Bakken Formation [1]. A Bakken well needs 1 million to 5 million gallons of water for hydraulic fracturing. In the coming decades, the North Dakota Department of Mineral Resources predicts a need for 7.3 billion to 11 billion gallons of water per year, or 20 million to 30 million gallons per day [2].
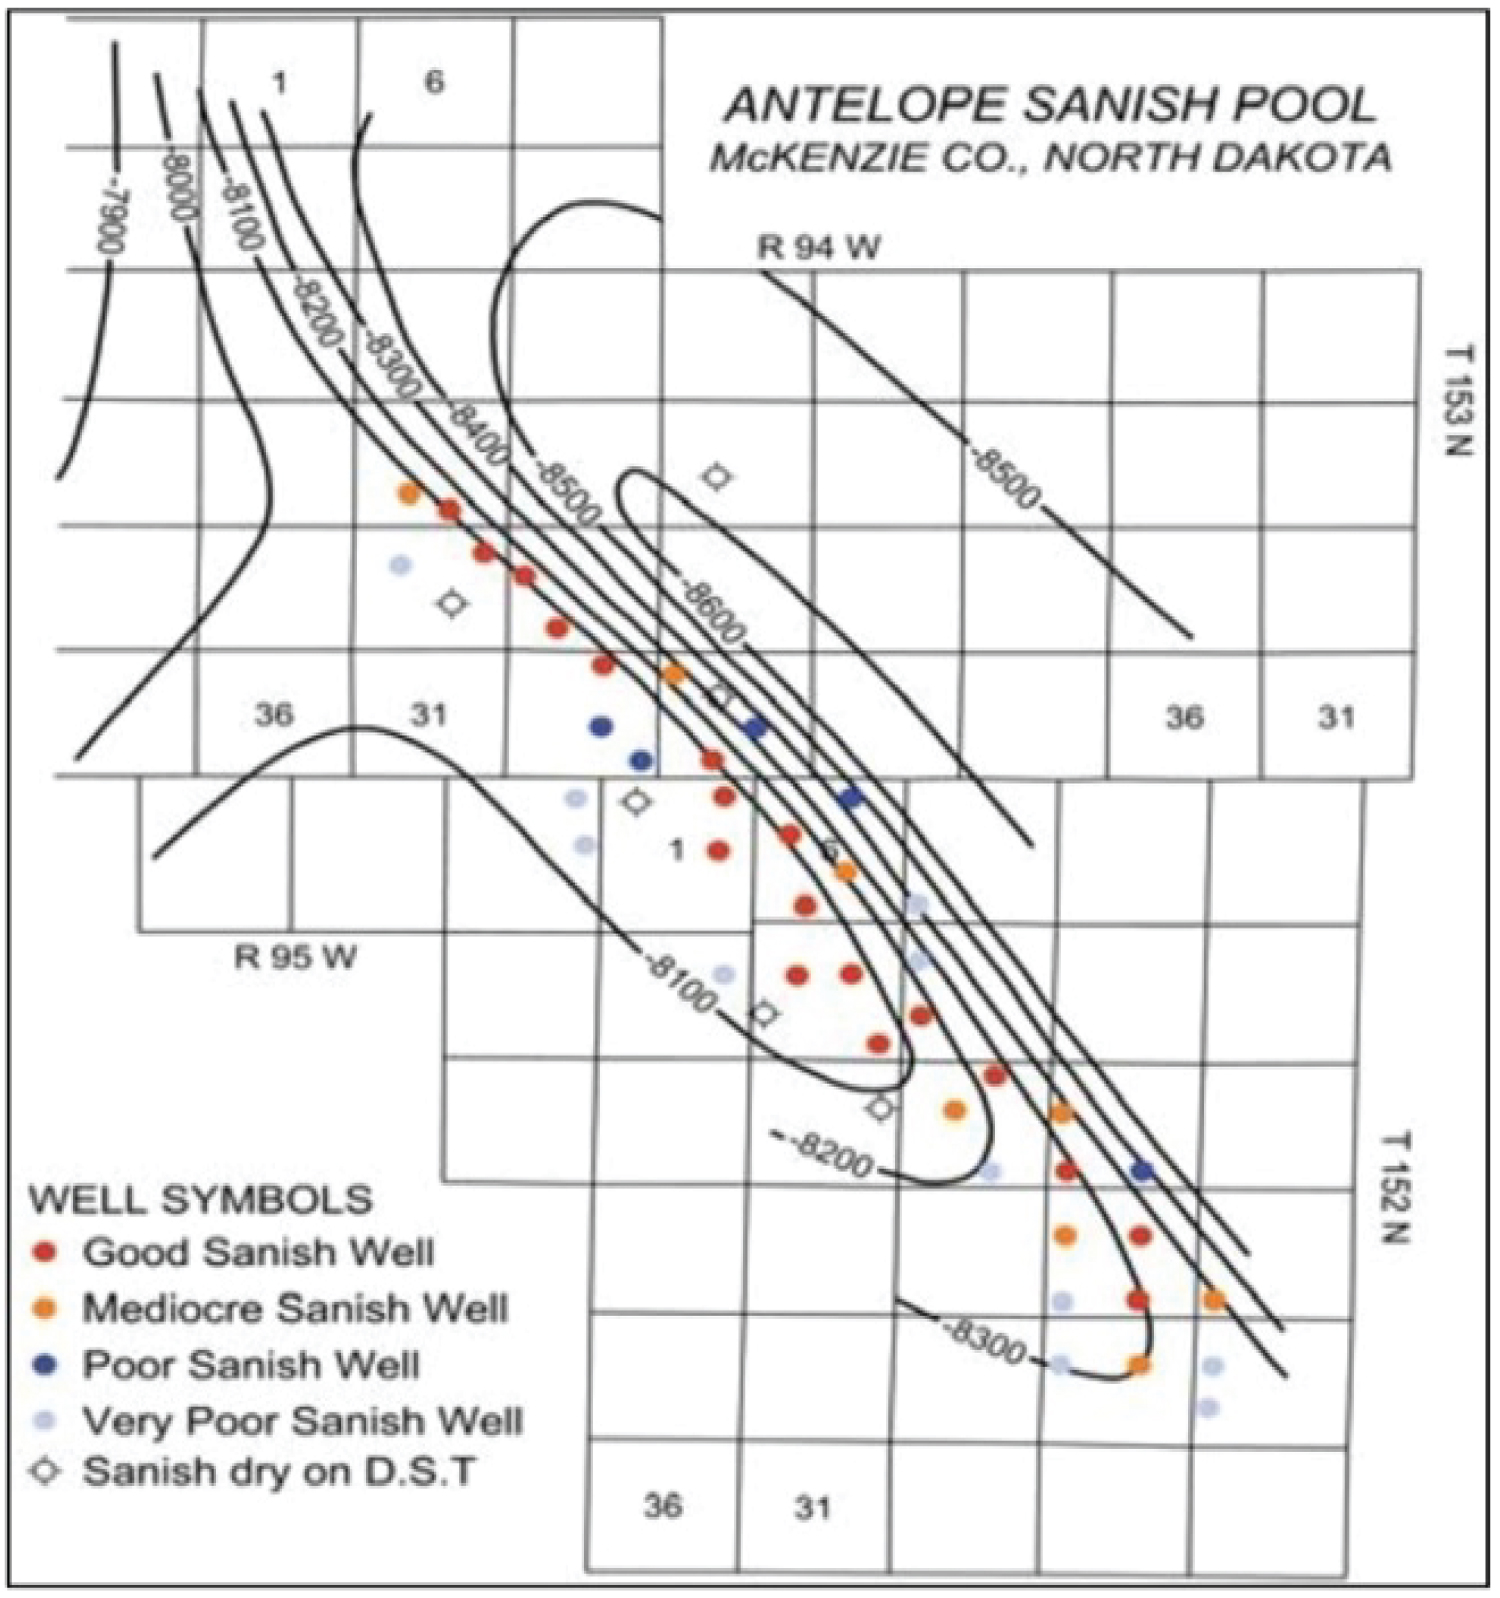
On the Antelope Anticline, however, Stanolind Oil and Gas Corp.'s drilling and completion of the #1 Woodrow Starr in 1953 marked the beginning of oil production from the Bakken (SW 1/4 SE1/4Sec.21,T152N,R94W) [3] (Figure 1).
According to a USGS analysis published in April 2008, the Bakken formation's recoverable oil reserves range from 3.0 to 4.3 billion barrels, with a mean of 3.65 billion barrels [4]. Simultaneously, North Dakota's state government unveiled a report with a lower estimate of the amount of technically recoverable oil in the Bakken, which came to 2.1 billion barrels [5]. The overall reserves, recoverable and non-recoverable with current technology, are pegged at up to 24 billion barrels, according to various different estimations. According to a recent estimate, there are 18 billion barrels [6]. The U.S. Geological Survey updated its estimate of the ultimate recovery of 4.3 billion barrels of unconventional oil in December 2015 [7]. These unconventional oil resources are being developed by horizontal drilling and hydraulic fracturing. Hydraulic fracturing enhances the release of metal ions adsorbed to clay particles in shales. Pressure is released and a portion of hydraulic fracturing fluid resurfaces, along with formation water through the fracture completion. This mixture known as flow back water typically has significantly higher concentrations of dissolved critical elements than the injected fluids. The benefit of extracting valuable constituents from oil field-produced water is expected to be greater because of their high concentration and the total dissolved solids (TDS) increase with each subsequent hydraulic fracturing operation.
A rock formation called a geothermal reservoir is capable of holding hot water. An economically viable geothermal reservoir needs to be porous enough to hold a lot of hot water and be able to produce fluids at the desired rate once it has been fully built. Most of the western part of North Dakota is covered by deep sedimentary rocks, which could produce low-temperature geothermal energy (less than 90 °C) and intermediate-temperature geothermal energy from 90 °C to 150 °C [8]. The recoverable resources are estimated to be 1.35 × 10 19 J or 2.22 × 10 9 barrels of crude oil, according to studies of geothermal resources examined within an area of around 130,000 km 2 in the Williston Basin [9]. The Dakota, Mission Canyon, Dupe row, and Red River Formations aquifers in North Dakota contain identified low and intermediate-temperature geothermal resources. With depths ranging from 2,000 to 14,000 feet, the Dakota aquifer’s Inyan Kara deposit is the shallowest and most significant geothermal aquifer for direct-use development [10].
The primary driver for researching their extraction at first was the economic potential of specialty metals, chemicals, and industrial minerals in the formation and flow back water. The primary motivators now are the environmental advantages, freshwater supply restrictions for hydraulic fracturing, and challenges with the storage and disposal of waste flow back water. Antero Resource's Clearwater treatment plant in North America is one instance. It treats generated water from the Marcellus Shale to lower environmental risk and supply fresh water for hydraulic fracturing, with ambitions to market the salts that are removed [11]. The current market environment is favorable, recoverable elements are present in high concentrations, and recovery methods involving the elimination of element co-precipitation are well established, among other factors. As a result, it is anticipated that recovering critical elements from produced water and formation water will be profitable. Additionally, in many instances, the recovery of dissolved material could at least partially offset the costs of wastewater management and disposal from oil and gas fields.
The objectives of this conceptual study are to:
1. Compare the differences between the produced water from the Bakken Formation and the Inyan Kara Formation in terms of TDS and salt content (Cl, Na, Ca, K, Fe, Mg, SO 4 2- , HCO 3 - ).
2. Discuss the availability and general market conditions for the elements (Cl, Na, Ca, K, Fe, Mg, SO 4 2- , HCO 3 - ) currently reported by the oil and gas industry as being recoverable from produced water in the Bakken.
Geological Settings of the Study Area
Bakken formation
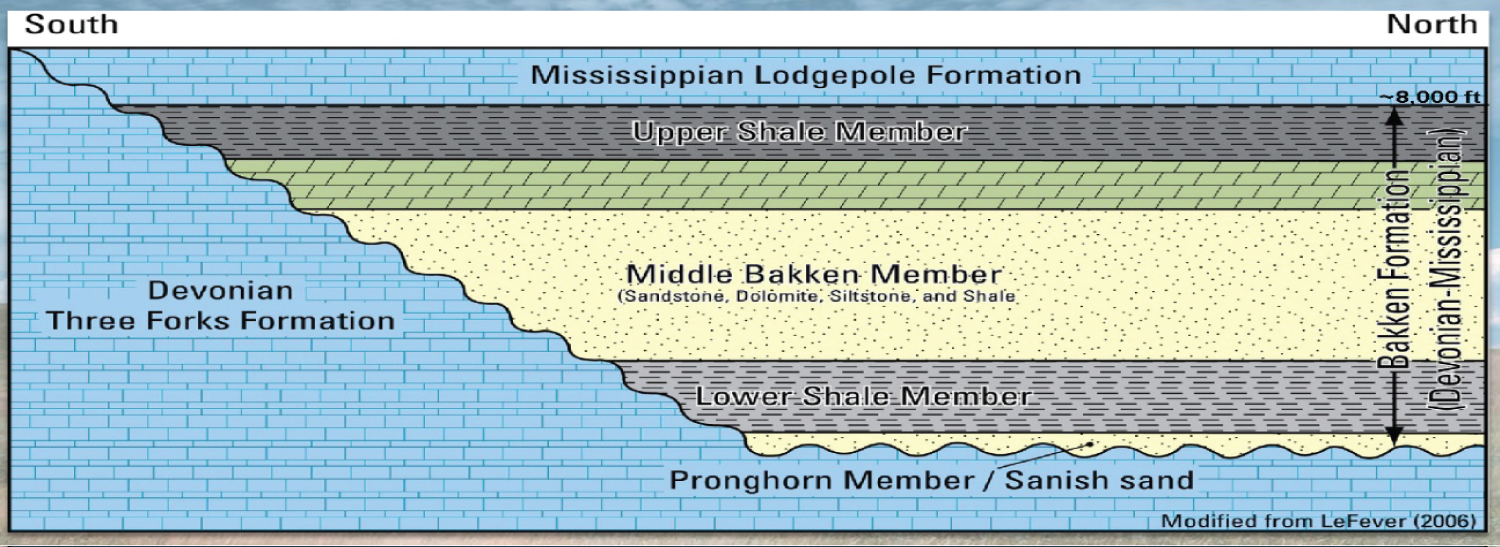
In the Williston Basin of North Dakota, the late Devonian-early Mississippian Bakken formation is made up of sedimentary deposits from offshore marine and coastal regime environments. Three sedimentary units make up this formation: The Upper and Lower are primarily made of shales, while the Middle is primarily made of carbonate and is characterized by low permeability. Oil was produced by the Upper and Lower members and ejected into the Middle member. In actuality, organic-rich shales that operate as both sources and seals surround the Bakken formation. The source-rock thickness, thermal maturity, and total organic carbon (TOC) all have a role in determining how much oil is produced and released from the shale.
The bottom member is composed of locally calcareous dark-gray to brownish-black to black, competent, massive to fissile, somewhat to strongly organic-rich shale. The Bakken's upper member, which is composed of fissile, somewhat calcareous, organic-rich shale that ranges in color from dark gray to brownish-black to black, is lithologically similar to the bottom member. It differs from the bottom part in that it contains more organic materials and lacks crystalline lime stones and greenish-gray shale deposits (Figure 2).
Inyan kara formation
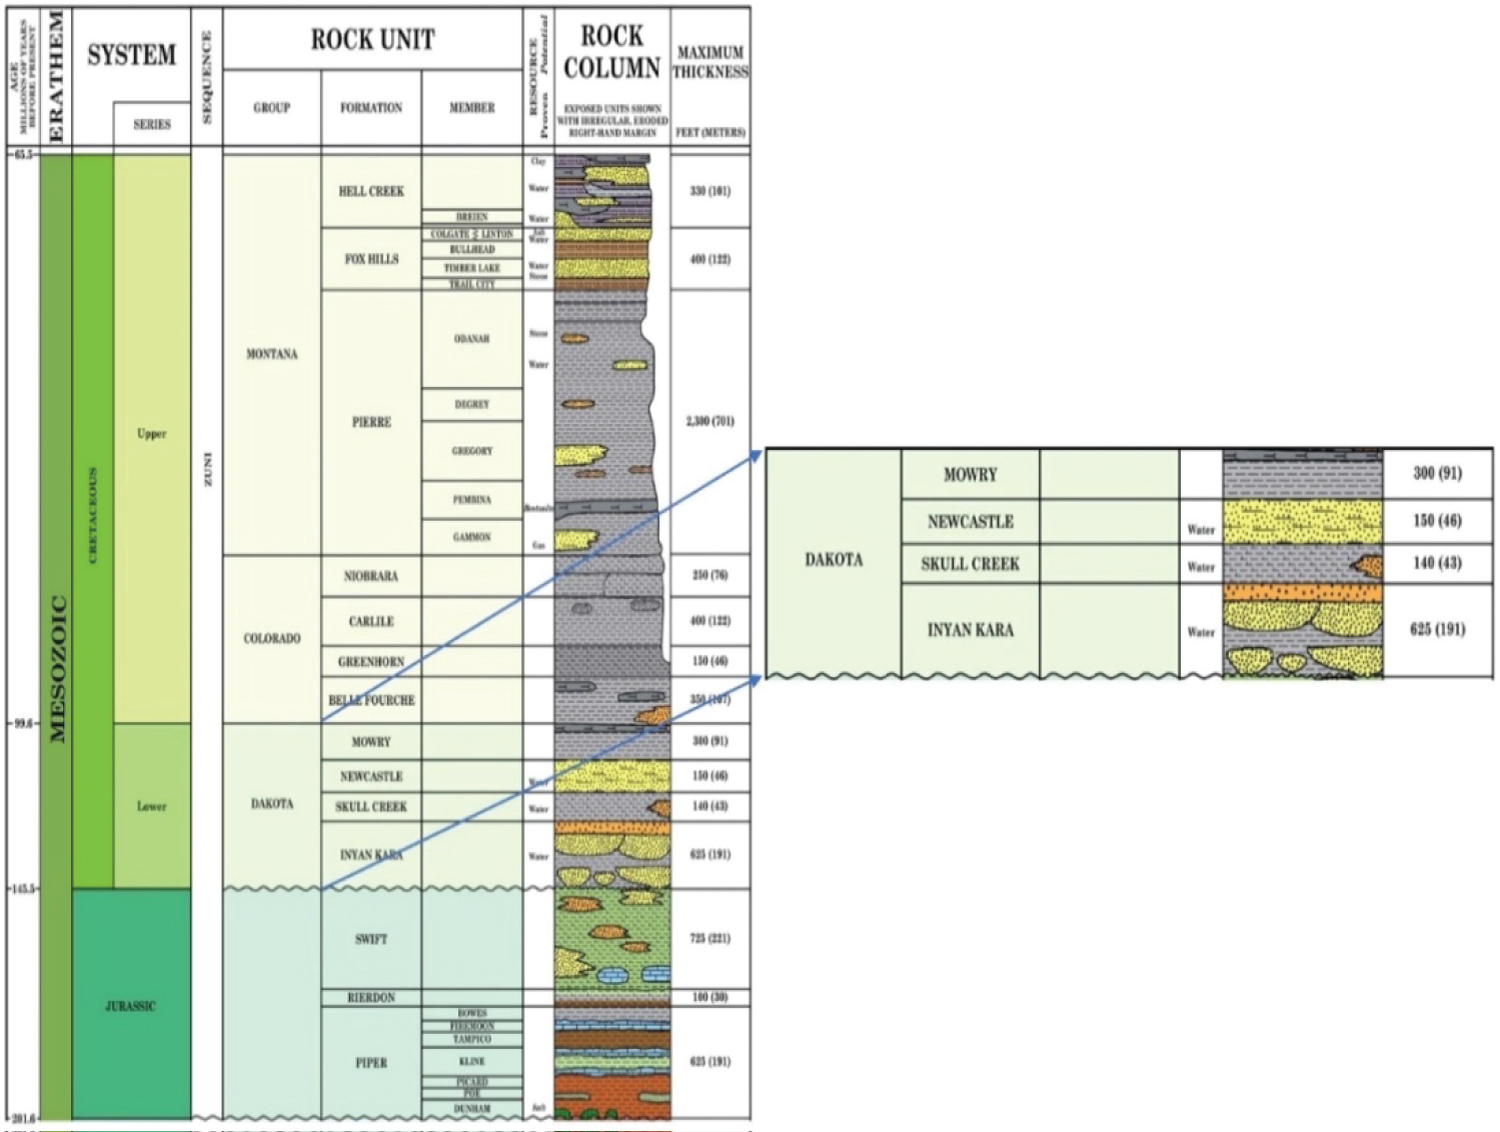
The Lower Cretaceous Dakota Group's lowest unit is the Inyan Kara Formation in North Dakota. Over a million barrels/day of produced water are injected into the formation, which serves as the main subsurface injection zone [12]. The Western Interior Seaway's initial sea level rise during the Early Cretaceous (Aptian) is where this unit starts. According to Langtry TM [13], the Inyan Kara rests irregularly on the Late Jurassic (Oxfordian) Swift Formation and congruently beneath the Skull Creek Formation (Figure 3). Inyan Kara can be divided into two units that represent the Early Cretaceous' overall sea-level rise. According to one interpretation, The bottom portion is a "fluvial-dominated, incised valley-fill complex that can be grouped into three main tracts: (1) Start with incising of the lowermost valley at the dropping phase; (2) Completing of the valley floor at the low stance and the earliest transgression; (3) First penetration of the waterway with afterward flooding and growth of the estuary deposits over transgression; and (4) Progradational aquatic contributions of the highstand. A subaerial unconformity, which is duplicated in the upper Inyan Kara and into the underlying shales of the Skull Creek Formation beneath it, caps the underlying depositional order [15].
Statistical Summary of Salts Concentrations in Bakken Field Produced Water
We can see from the data (Table 1) that the water chemistry of North Dakota's produced water from the Bakken Formation changes greatly depending on the depth of the water source.
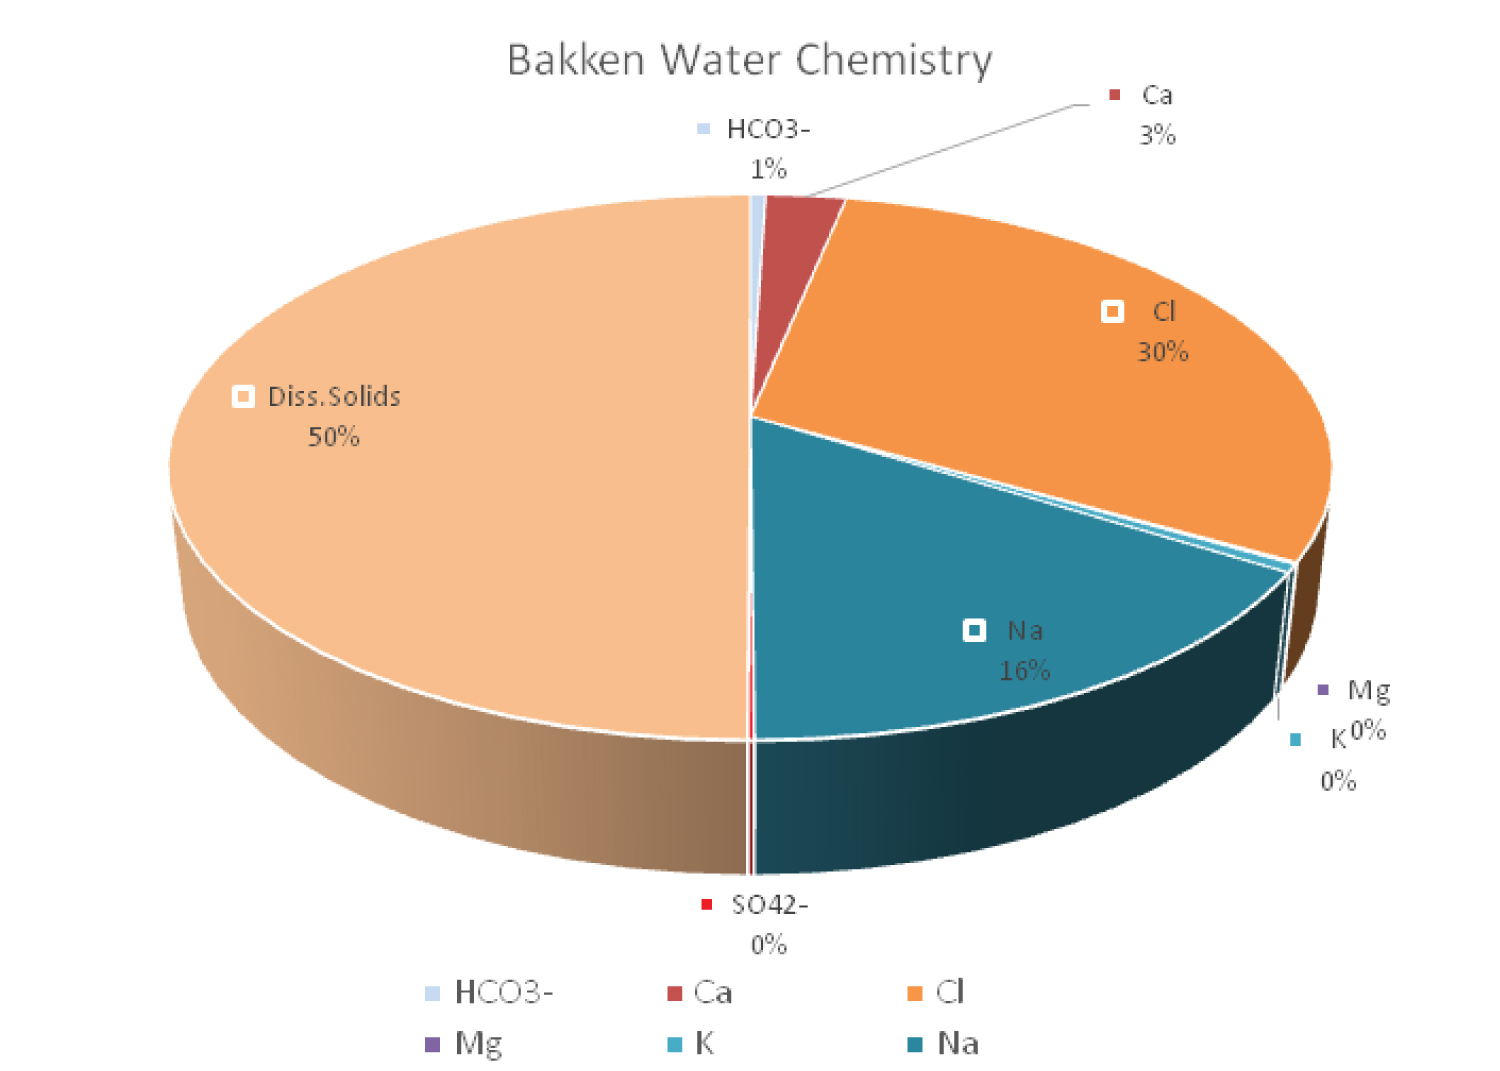
The range of dissolved solids (mg/L) readings, which show that the water is heavily mineralized, is 46815 mg/L to 327,714 mg/L. The range of HCO 3 - (mg/L) readings shows alkaline water, from 100 mg/L to 18,916 mg/L. Calcium is present in high amounts, as shown by the Ca (mg/L) values, which vary from 846 mg/L to 30,340 mg/L. Magnesium is present in a variety of amounts, as shown by the Mg (mg/L) values, which range from 25 mg/L to 1508 mg/L.
Chloride is present in high amounts, as indicated by the Cl (mg/L) readings, which vary from 16820 mg/L to 200928 mg/L. As seen by the Na (mg/L) values, which range from 10,060 mg/L to 106,954 mg/L, sodium is present in a variety of quantities. According to the K (mg/L) values, which range from 138 to 3960 mg/L, potassium is present in a variety of quantities. The SO 4 2- (mg/L) readings range from 10 mg/L to 2048 mg/L, showing that the concentration of sulfate varies.
Overall, the evidence points to highly mineralized and alkaline produced water from the Bakken Formation in North Dakota, with varied concentrations of magnesium, potassium, and sulfate depending on the depth of the water source (Figure 4).
Dissolved Critical Elements from the Inyan Kara Formation in Eastern North Dakota
The given data (Table 2) from Inyan Kara Formation contains readings from 17 different stations, with each station identified by a unique number. The parameters recorded for each station are pH, dissolved solids (in mg/L), and the concentration of various ions like iron (Fe), sodium (Na), potassium (K), calcium (Ca), magnesium (Mg), chloride (Cl), sulfate (SO 4 2- ), and bicarbonate (HCO 3 - ) (Table 2).
The pH values range from 7.1 to 8.7, with an average of around 7.8. The dissolved solids content ranges from 4130 to 6240 mg/L, with an average of approximately 5312 mg/L. The concentration of iron ranges from 0.06 to 3.4 mg/L, while that of sodium ranges from 780 to 1200 mg/L. Potassium concentrations range from 0 to 46 mg/L, while calcium ranges from 4 to 370 mg/L. Magnesium concentrations range from 1.2 to 130 mg/L, chloride concentrations range from 300 to 1600 mg/L, sulfate concentrations range from 730 to 2000 mg/L, and bicarbonate concentrations range from 1900 to 7100 mg/L.
Overall, these readings provide a comprehensive snapshot of the water quality in the 17 different stations, which can be analyzed and compared for research and management purposes.
Because of the leakage in the Inyan Kara aquifer, the anion hydrochemical facies changes from sulfate-dominated mixed facies to more saline chloride-dominated mixed facies. Also, the more saline chloride facies in the Inyan Kara aquifer may be caused by direct leakage from the Cambrian-Ordovician aquifer. The shallowest and most crucial geothermal reservoir for direct-use development is the Dakota Aquifer's Inyan Kara deposit [10]. However, this research shows the eastern part of the Inyan Kara deposit is not as suitable for the exploration and utilization of geothermal energy due to the lower temperature and poor water quality. Although in the western parts of Inyan Kara aquifer is a potential of producing low (less than 90 °C) and intermediate (90 °C 150 °C) temperature geothermal energy but greater depth, a lower anticipated flow rate that estimates how much it would cost to build and maintain a possible geothermal reservoir make it impractical for geothermal direct-use development. Unfortunately, the Inyan Kara formation's rare earth mineral data were not available at the time of the study.
Comparison of salts concentration between Dakota group and Inyan Kara formation water
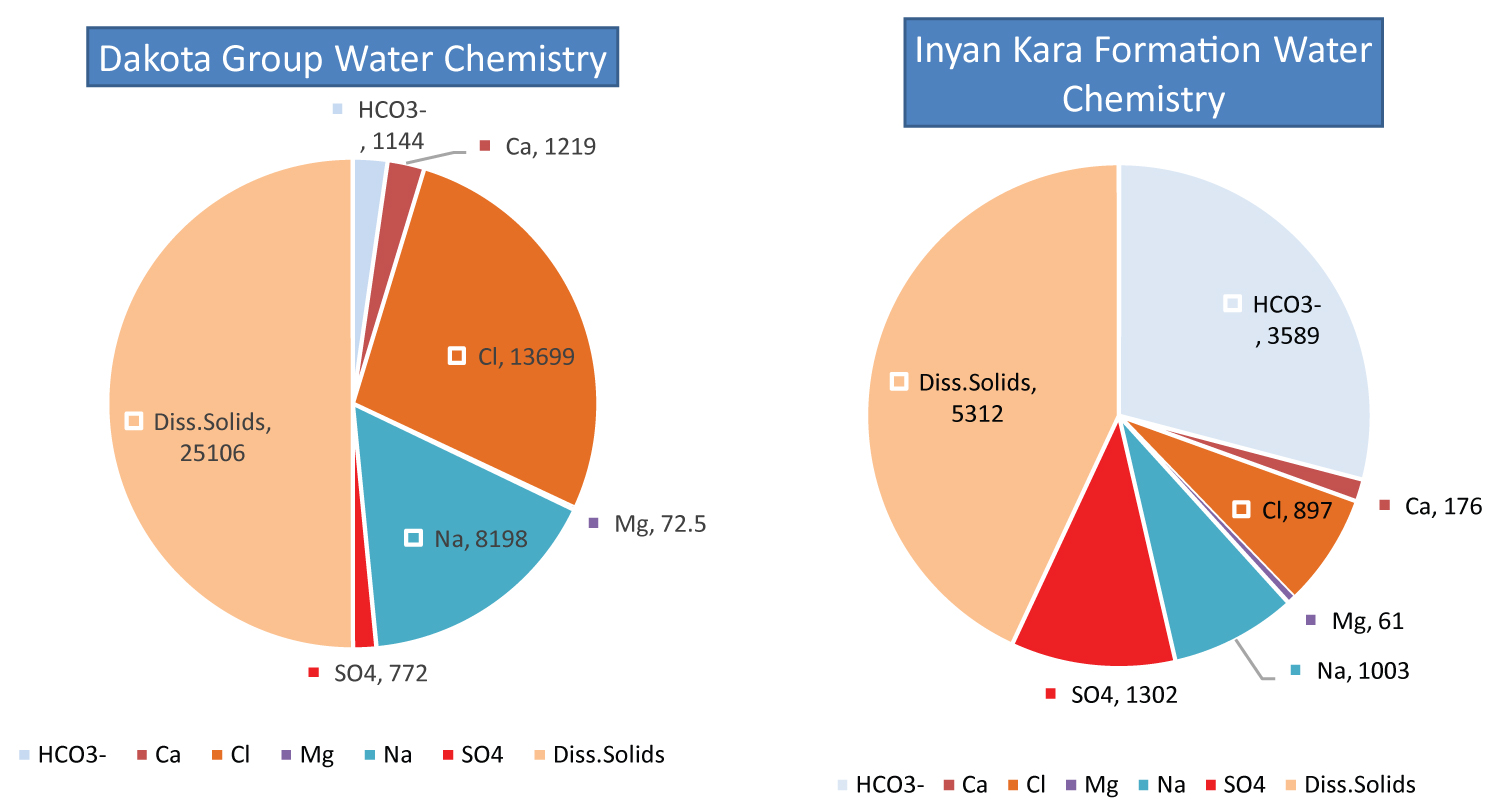
Table 3 represents the produced water chemistry data from the different depths of the Dakota Group. The Inyan Kara Formation data and the Dakota Group data both provide information on water quality, but they differ in the specific parameters measured and the depth of the water sources sampled. The Inyan Kara Formation data include measurements of pH, dissolved solids, and the concentration of various ions like iron, sodium, potassium, calcium, magnesium, chloride, sulfate, and bicarbonate. The data are collected from 17 different stations and cover a pH values from 7.1 to 8.7, and dissolved solids content from 4130 to 6240 mg/L. In contrast, the Dakota Group data includes measurements of minerals and ions such as bicarbonate, calcium, chloride, iron, magnesium, potassium, sodium, sulfate, and dissolved solids. The data cover different depths of water sources, and the concentration of bicarbonate ranges from 205 mg/L to 2125 mg/L, calcium concentration ranges from 8 mg/L to 7182 mg/L, and chloride concentration ranges from 610 mg/L to 70000 mg/L. Regarding salt concentration, the Inyan Kara Formation data provides measurements of various ions such as chloride, sulfate, and bicarbonate, with chloride concentrations ranging from 300 to 1600 mg/L, sulfate concentrations ranging from 730 to 2000 mg/L, and bicarbonate concentrations ranging from 1900 to 7100 mg/L. In comparison, the Dakota Group data includes measurements of chloride, sulfate, and bicarbonate as well, but with higher concentration ranges. Chloride concentration ranges from 610 mg/L to 70000 mg/L, and sulfate concentration ranges from 306 mg/L to 1565 mg/L. However, it should be noted that the two datasets cannot be directly compared because they are collected from different locations and represent different geological formations (Figure 5).
Comparative Differences between the Salt Content of the Produced Water from the Bakken Formation and the Water from the Inyan Kara Formation
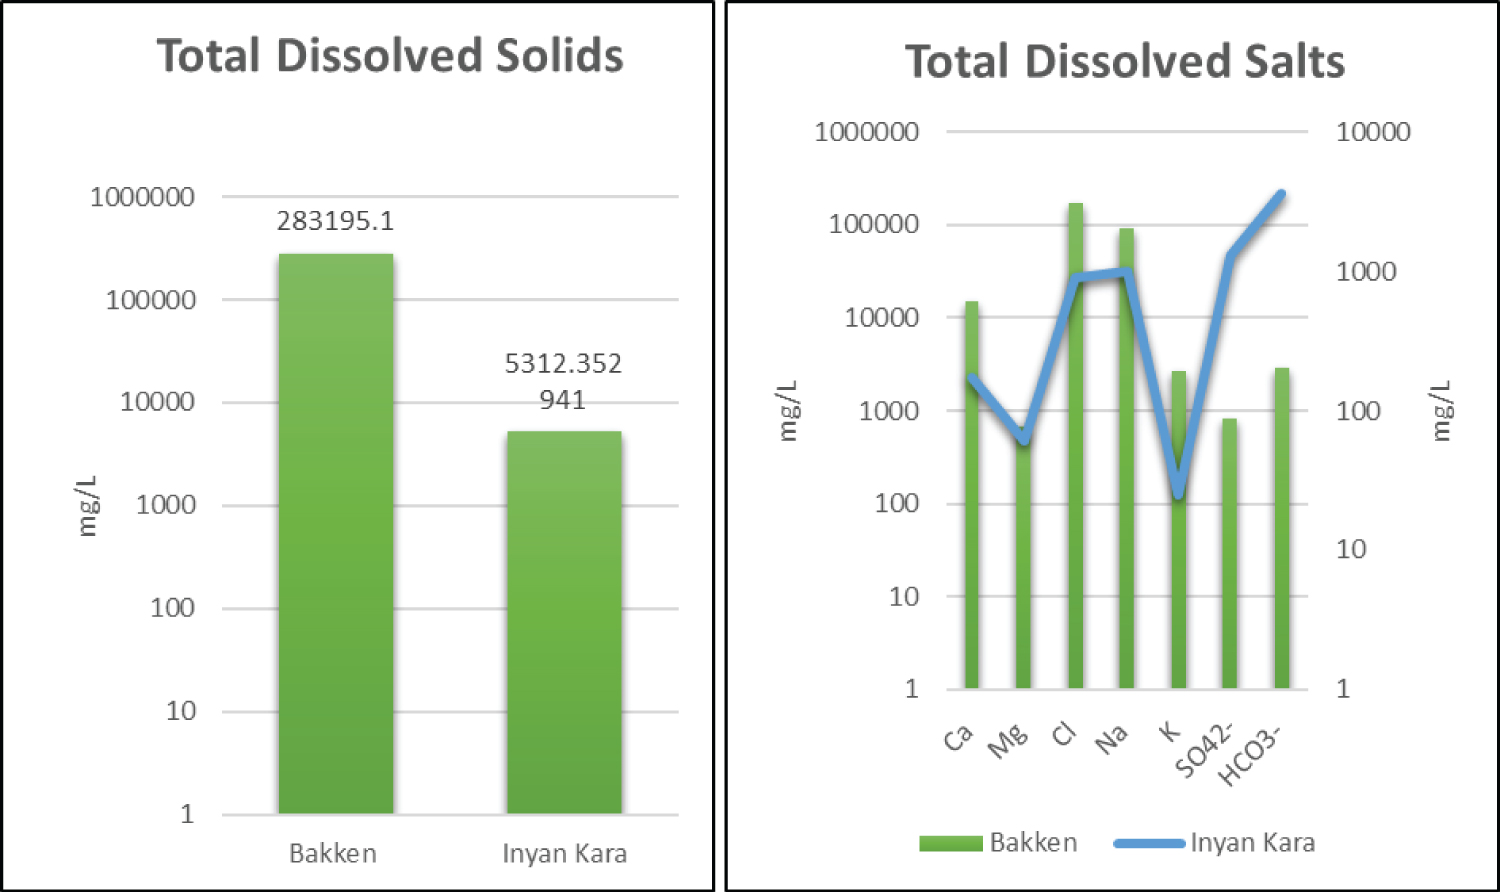
Based on the provided data, there are significant differences in salt concentration between the Bakken Formation and the Inyan Kara Formation. The Bakken Formation has much higher levels of dissolved solids, as indicated by the range of readings from 46815 mg/L to 327,714 mg/L, compared to the Inyan Kara Formation, which has a much narrower range of 4130 to 6240 mg/L (Figure 6). This suggests that the Bakken Formation water is significantly more mineralized than the Inyan Kara Formation water, making it potentially more suitable for salt extraction.
Additionally, the Bakken Formation produced water has significantly higher concentrations of calcium, magnesium, and chloride, with Ca (mg/L) values ranging from 846 to 30,340 mg/L, Mg (mg/L) values ranging from 25 to 1508 mg/L, and Cl (mg/L) readings ranging from 16820 to 200928 mg/L. In comparison, the Inyan Kara Formation has much lower concentrations of these ions, with Ca concentrations ranging from 4 to 370 mg/L, Mg concentrations ranging from 1.2 to 130 mg/L, and Cl concentrations ranging from 300 to 1600 mg/L. This suggests that the Bakken Formation water may have a higher potential for salt extraction due to the higher concentrations of these ions.
On the other hand, the Inyan Kara Formation has higher average bicarbonate (HCO 3 - ) concentrations (3589 mg/L), compared to the Bakken Formation (2902 mg/L). This indicates that the Inyan Kara Formation water is more alkaline than the Bakken Formation water, which may make it less suitable for certain types of salt extraction processes.
The Bakken Formation is more economically viable for water production compared to the Inyan Kara Formation.
The Bakken Formation has a high quantity of produced water due to its numerous active and abandoned wells. This means that the cost of extracting salt from produced water from these wells is likely to be relatively low, as the infrastructure for water production is already in place. Furthermore, the abundance of produced water could create opportunities for the water to be reused or sold, generating additional revenue streams. In contrast, the Inyan Kara Formation does not have any wells for water production, and building wells in this area would be costly. This makes water production from this formation less economically viable.
Additionally, although the Inyan Kara Formation has higher water saturation than the Bakken Formation, the lower salt concentration means that the water may not be as valuable for certain applications, such as oil and gas production.
Based on these differences, it appears that the Bakken Formation may be the better choice for starting salt extraction due to its higher mineralization and concentrations of calcium, magnesium, and chloride. However, other factors, such as the availability of water sources and the cost of extraction, should also be taken into consideration when deciding which formation is the most suitable for salt extraction. Additionally, it is important to note that both formations have unique characteristics and may have other potential uses beyond salt extraction, such as in agriculture or industry.
Therefore, from an economic perspective, it would likely be more profitable to focus on salt extraction from the Bakken formation due to its existing infrastructure and high volume of produced water.
An Overview of the Market Scenario for the Elements in North Dakota with the Highest Likelihood of Generating Revenue from the Formation-Water
It is possible to extract and sell a number of elements from produced water to contribute to paying for disposal costs. Due to their role in scaling and precipitating under operating and handling conditions, some elements, like Ca, Na, Mg, and Cl are routinely analyzed in North Dakota; however, the concentrations of other elements, like Br, I, B, K, and Li are not consistently determined or reported. Most of these theoretically recoverable goods are classified as industrial minerals or specialty metals (like magnesium and lithium), so the market constraints their production. A modified version of a method first developed by Christensen [18] for desalination investigations and briefly explained by Collins [19] can be used to rank or compare sources of produced water according to the potential for salts to recover. This strategy contains variables like brine value, maximum brine worth, and brine worth and needs further research. This sections that follow provide basic details and market conditions pertaining to potentially recoverable materials. The flow rate of produced water is a further element crucial for making informed decisions regarding the potential recovery of marketable products, and it should be considered in follow-up studies in addition to the constituent concentrations addressed in this study.
Calcium and its relative constituent
One of the most prevalent elements, calcium makes up 4.6 weight percent of the upper crust of the earth [20]. It is a significant part of limestone, which is employed in the building sector (for example, as dimension stone, aggregate, and in the manufacture of Portland cement). By crushing and milling limestone, marble, or, in rare instances, carbonates, large quantities of natural calcium carbonate products are produced for industrial (e.g., inexpensive fillers in paper, plastics, and paint), agricultural, and environmental (e.g., chemical lime used where acidity neutralization is required) uses. The term “ground calcium carbonates,” or GCCs, refers to these finely powdered, reasonably priced products [21]. In most applications, brine-derived compounds are unlikely to be able to compete with GCCs; however, reports of highly concentrated calcium chloride brine in connection with potash and salt accumulation have been obtained. They are frequently regarded as a byproduct of dolomitization reactions and, in some cases, make up the majority of the brines found in oil and gas fields where the proportion of Ca to Mg is significantly higher and the proportion of sulfate is lower [22,23].
The process of making calcium chloride from brines is comparatively well-established [24], and the Michigan Basin brines CaCl 2 (32-45%) liquor is produced as a byproduct of Mg and B compounds [25]. Depending on the state of the market, the production of calcium chloride from the formation and produced water in ND may be feasible. However, it was determined that the investment would have been uneconomic at that time based on an economic evaluation and market analysis conducted by Donald B. Cross and Associates [24]. It may be worthwhile to reevaluate the market potential now that it has been more than 30 years.
Precipitated calcium carbonates, commonly referred to as PCCs or synthetic calcium carbonates, are more expensive to purchase than GCCs. They are utilized in situations where high-quality GCC fillers are hard to come by or to meet the needs of markets that demand extreme uniformity and stringent physical criteria that are difficult for GCC producers to regularly meet. PCCs are used in coating applications or as specialized technical fillers when high whiteness and brightness, as well as small particle size, tight particle size distribution, and a particular particle shape (such as rhombohedral, orthorhombic, or hexagonal) are required. Erdogan N, et al. [26] claim that the Kraft pulping method, also known as the lime soda process (Equation 1), the carbonation process (Equation 2), and the calcium chloride process (Equation 3), can create PCCs:
Ca(OH) 2 + Na 2 CO 3 ↔ CaCO 3 + 2NaOH (1)
Ca(OH) 2 + CO 2 ↔ CaCO 3 + H 2 O (2)
CaCl 2 + Na 2 CO 3 ↔ 2NaCl + CaCO 3 (3)
Alkali factories, for whom sodium hydroxide is the primary product and PCC is only a byproduct, frequently use the lime soda process (equation 1). Equation 2 describes the carbonation process, which is the most widely utilized since it uses cheap raw ingredients. Quick lime (calcium oxide, CaO), produced by crushing and calcining limestone, and carbon dioxide are the end products. Equation 2 [27] describes how quickly lime is hydrated to create a Ca(OH) 2 slurry, also known as hydrated lime, which is subsequently reacted with CO 2 gas to create PCCs and water. Technically the simplest and most pertinent to this work is the calcium chloride method (equation 3), which produces PCCs by reacting calcium chloride solution with sodium carbonate to produce sodium chloride and PCCs. Accordingly, depending on the purity of the CaCl 2 derived from formation and produced water, and on market conditions, PCCs could be considered a value-added product obtained from CaCl 2 if a low-cost, high-purity CaCl 2 solution is easily accessible [28].
Application for calcium chloride (CaCl 2 ) and its hydrated equivalent (CaCl 2 [H 2 O] x ) include food processing, water adsorbents, and dust, snow, and ice control. In addition, calcium chloride is employed as an industrial water adsorbent, a setting accelerator for ready-mix concrete, a desiccant to scavenge moisture, and a refrigeration brine for ice rinks and cold storage facilities.
Magnesium and associated substances
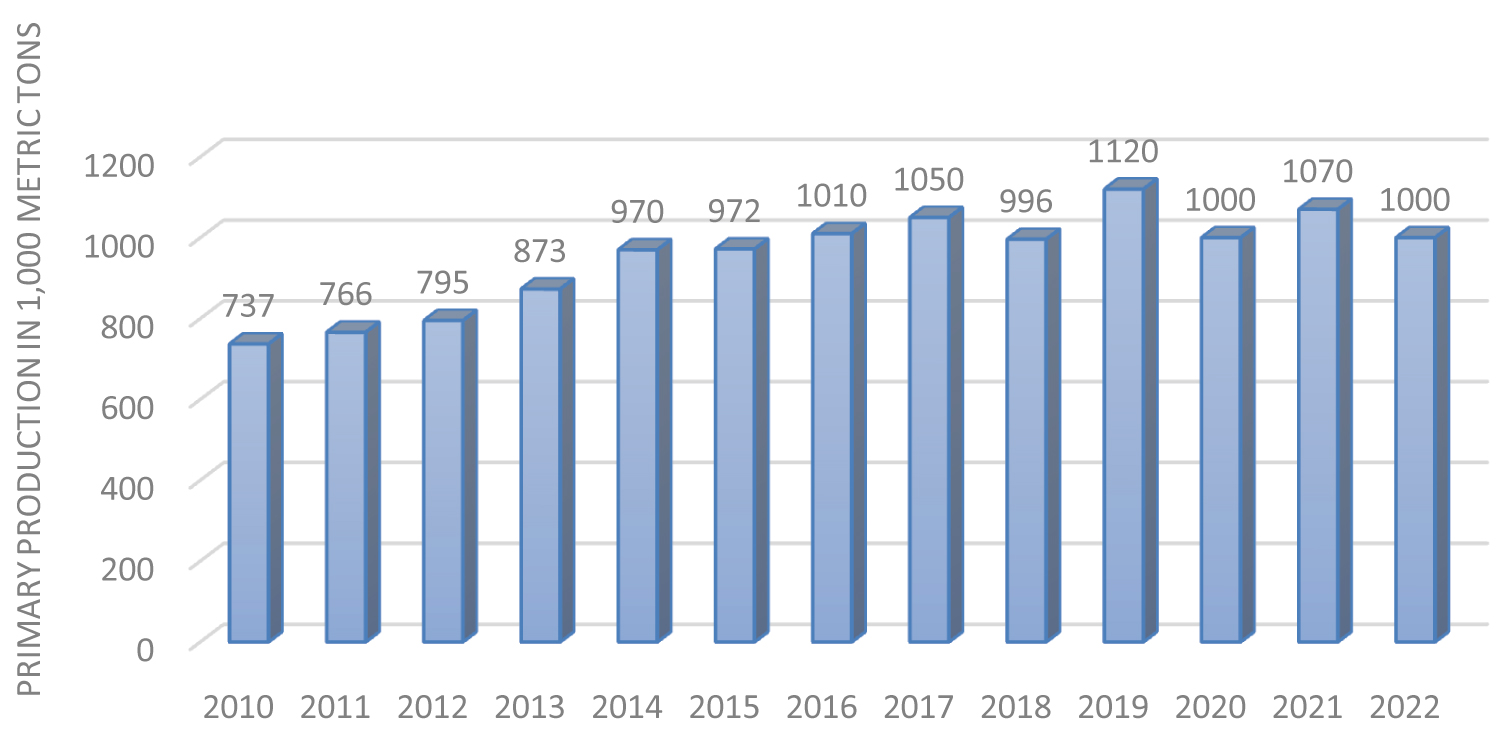
The Earth's crust contains 2.7 weight percent magnesium [20]. Dolomite, magnesite, serpentine (including chrysotile tailings), magnesium sulfate, and magnesium chloride found in brines and seas can all be converted into magnesium metal [29,30]. A total of 1000 metrictons of primary magnesium were produced worldwide in 2022 according to estimates by Garside [31], primary magnesium production peaked in 2019 at 1120 metric tons (Figure 7). Primarily used as a reducing agent in the United States for the production of titanium and other metals (33%), aluminum-base alloys for packaging, transportation, and other uses (30%), structural uses (18%), desulfurization of iron and steel (14%), and other uses (5%), primary magnesium metal is also used for structural purposes. 72.5 thousand metric tons of magnesium were recycled from new scrap in the United States alone in 2022 [32]; over 70% of this metal came from aluminum alloys, while roughly 30% came from structural purposes [33]. From 2014 through 2016, the year-end US spot magnesium metal price was US$4.74/kg; meanwhile, prices on the China free market for 2016 averaged US$2.4/kg [33].
Magnesia (MgO) is most frequently derived from magnesite, but it can also be derived from hydrated magnesium sulfate and magnesium chloride found in seawater and underground brines, such as those in the Michigan Basin and the Dead Sea in Israel, as well as from brucite and huntite [19,21,25,34]. Numerous industrial, chemical, environmental, and agricultural uses call for caustic-calcined magnesia. High-performance refractories are mostly made from fused and dead-burned magnesia [33,34]. Mg oxides are more affordable than magnesium metal, for instance, Li A [35] calculated that the cost of Chinese caustic magnesia (96% MgO), free on board China, is between US$335 and US$355 per ton.
The ionic halides magnesium chloride (MgCl 2 ) and its hydrated counterparts, such as MgCl 2 (H 2 O) x are very water-soluble. Sea and lake brine, as well as formation water, can be used to directly extract hydrated magnesium chloride [21]. Solution mining is used to remove naturally hydrated magnesium chloride (bischofite, MgCl 2 ·6H 2 O) from old evaporite deposits in northwest Europe. The main precursor to magnesium metal is anhydrous magnesium chloride. Magnesium chloride is widely utilized for a variety of purposes, including road stabilization, dust or ice management, the production of magnesium metal, water treatment, the manufacture of wallboard, fire retardant, fire extinguisher agents, Sorel cement, as a component of fertilizers, and as a magnesium supplement in animal feed.
Chlorine and sodium
The Earth’s crust contains 2.28 weight percent Sodium [36]. Halite (NaCl) or sodium chloride is most often referred to as salt. The typical amount of salt in ocean and seawater is 3.5%; in 1 km 3 of salt water, there are roughly 78 million tons of salt [21]. Bedded salt deposits underground are mined using traditional underground or solution mining techniques. Saline lakes and playas can also yield salt [21]. The cheapest ingredient used in the creation of sodium hydroxide (caustic soda; NaOH) and chlorine (Cl 2 ) is sodium chloride. The sodium chemicals sodium hydroxide and sodium carbonate (soda ash, Na 2 CO 3 ) are also crucial for commerce. In the production of pulp and paper, detergents, water treatment, insecticides, petroleum refining, and textiles, sodium hydroxide is employed.
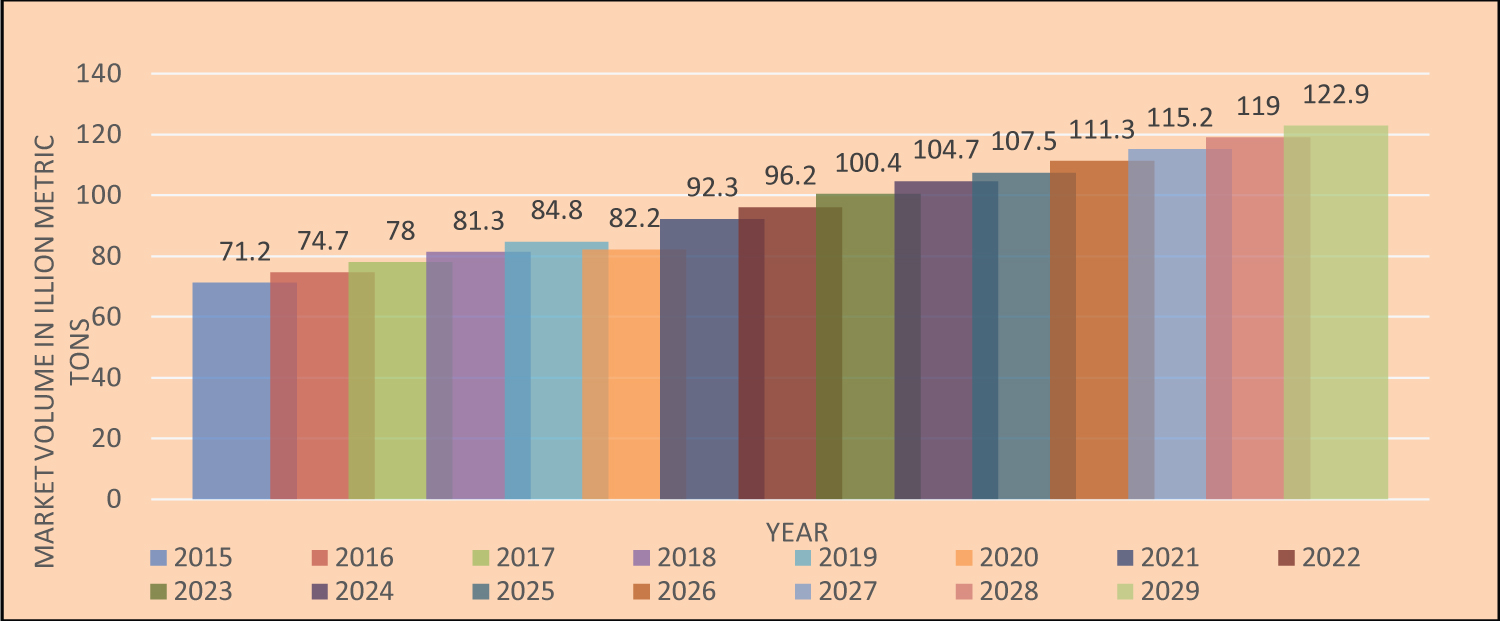
Sodium hydroxide and hydrogen gas (H 2 ) are also created during the electrolysis of a sodium chloride solution to make chlorine. Chlorine compounds are employed in the pulp and paper sector, the chemical sector (e.g., in the manufacture of polyvinyl chloride [PVC], which is used in pipes, flooring, siding, and wire insulation), the manufacturing of titanium oxide, water treatment, bleaching, and sanitation [21]. According to Statista Research Department 2023 [37], the expected global market for Cl in 2022 was 96.2 million metric tons (Figure 8), and salt prices in 2022 fluctuated widely depending on the commodity. According to Bolen [38], the cost of vacuum and open pan salt was US$190 per ton, solar salt was US$90 per ton, rock salt was US$45 per ton, and salt in brine was US$9.40 per ton. According to W. Bolen, solution mining is still the predominant method of producing salt brine for captive use in the United States today as it was in the early 1990s [39].
In the Midwestern United States, salt is used in road maintenance (for de-icing and dust control), the oil and gas sector (for drilling mud and antifreeze agents), agriculture (for fertilizer production), the production of soda ash, pulp, and paper manufacturing (for bleaching), and the chemical industry. NaCl competes with KCl, MgCl 2 , and CaCl 2 for use in road maintenance (Water SMART Solutions Ltd., 2012). Salt is also widely used in mineral exploration drilling in permafrost areas. According to the United States Environmental Protection Agency, approximately 100 tons of scale per oil well are generated annually in the United States.
Sampling and Measuring Concentration
The U.S. Geological Survey's water analysis data, which were gathered from oil and gas producers, are the foundation of this study. The 8877 data entries relating to oil and gas wells in North Dakota were found in the U.S. Geological Survey National Produced Waters Geochemical Database (ver. 2.3, January 2018). The majority of these data entries include a variety of details, such as the chemical makeup and physical characteristics of produced waters. This database was created with the oil and gas sector in mind. This study aims to identify geographic variation in chemical constituents of produced waters. Service providers conduct chemical evaluations of produced water on behalf of oil and gas producers, who then post the results to a website that is open to the public. Inductively coupled plasma-atomic emission spectrometry (ICP-AES) and inductively coupled plasma-mass spectrometry (ICP-MS) standard packages now include a wide range of trace elements and relative errors for the majority of major and trace elements are typically less than 5%. Neutron activation analysis (NAA) can estimate Br, and I concentrations with less than a 3% error. The lack of data on the standardization of sampling techniques and analytical procedures is one limitation of the water analysis data in the U.S. Geological Survey.
In a perfect world, all samples would have been collected, examined, and filtered in accordance with the same protocol [40,41], for example). Results can be considerably impacted by even seemingly insignificant errors, such as utilizing various brands of 0.45 m filter membranes [42]. The makeup of generated water from a single well changes over time, so it is normal to expect that a sample taken lately will have a very different makeup than one taken many years ago. Since the 1960s, sampling and analytical techniques have also changed. However, the database is of sufficient quality to identify regions in North Dakota with anomalous concentrations of salts of interest in produced water.
Conclusion
The Bakken Formation and Inyan Kara Formation have significant differences in salt concentration, making the Bakken Formation potentially more suitable for salt extraction. The Bakken Formation has a higher range of dissolved solids compared to the Inyan Kara Formation, with a range of 46,815 mg/L to 327,714 mg/L, while the Inyan Kara Formation has a narrower range of 4,130 to 6,240 mg/L. The Bakken Formation also has higher concentrations of calcium, magnesium, and chloride, with calcium concentrations ranging from 846 to 30,340 mg/L, magnesium concentrations ranging from 25 to 1,508 mg/L, and chloride readings ranging from 16,820 to 200,928 mg/L. In comparison, the Inyan Kara Formation has lower concentrations of these ions. However, the Inyan Kara Formation has higher bicarbonate concentrations, ranging from 1,900 to 7,100 mg/L, indicating that the water is more alkaline than the Bakken Formation water, which may make it less suitable for certain types of salt extraction processes.
The Bakken Formation is also more economically viable for water production compared to the Inyan Kara Formation. The Bakken Formation has a higher quantity of produced water due to its numerous active and abandoned wells, making it more cost-effective for salt extraction. Additionally, the abundance of produced water could create opportunities for the water to be reused or sold, generating additional revenue streams. In contrast, the Inyan Kara Formation does not have any wells for water production, and building wells in this area would be costly, making water production from this formation less economically viable. From an economic perspective, it would likely be more profitable to focus on salt extraction from the Bakken Formation due to its existing infrastructure and high volume of produced water. However, other factors, such as the availability of water sources and the cost of extraction, should also be taken into consideration when deciding which formation is the most suitable for salt extraction. It is also important to note that both formations have unique characteristics and may have other potential uses beyond salt extraction, such as in agriculture or industry.
In conclusion, while the Bakken Formation appears to be more suitable for salt extraction due to its higher mineralization and concentrations of calcium, magnesium, and chloride, other factors should be considered. The availability of water sources and the cost of extraction must also be considered when deciding which formation is the most economically viable for salt extraction. Nonetheless, the Bakken Formation's high volume of produced water and existing infrastructure make it a more cost-effective option for salt extraction.
Acknowledgement
I would like to express my sincere gratitude to the North Dakota Industrial Commission for funding this scientific research project.
I would also like to extend my thanks to the United States Geological Survey for providing the data that formed the basis of this study. I also want to express my gratitude to co-authors and Dr. Kegang Ling, my academic advisor, for his important advice, inspiration, and assistance throughout the entire project.
Finally, I would like to express my gratitude to the Department of Petroleum Engineering at the University of North Dakota for their ongoing support and encouragement.
Conflict of Interest
There are no overlapping Interests.
Data Availability
The associated authors can be reached for a reasonable query if you need access to the datasets that were utilized for this research and that support its key conclusions.
References
- USGS (2021) USGS Updates Williston Basin Resource Assessment. n.d.
- Water Consumption in the Bakken. n.d.
- (2010) A Brief History of Oil Production from the Bakken Formation in theWilliston Basin.
- Pollastro RM, Cook TA, Roberts LNR, et al. (2008) Assessment of undiscovered oil resources in the Devonian-Mississippian Bakken formation, Williston Basin Province, Montana and North Dakota. 2008-3021.
- ND Study: 167 Billion Barrels of Oil in Bakken. n.d.
- North Dakota Government. n.d.
- (2013) The USGS has completed an oil and gas estimate for the Bakken and three forks formations in the Williston Basin of Montana and North Dakota.
- Chu MH (1991) Study of the Geothermal Production Potential in the Williston Basin, North Dakota, 2: 176.
- Gosnold, William D (1984) Component Parts of the World Heat Flow Data Collection. Text/tab-separated-values.
- Harris KL, Howell FL, Wartman BL, et al. (1982) Evaluation of Hydrothermal Resources of North Dakota. Phase III Final Technical Report.
- Rassenfoss S (2017) Shale Water: Turning Dirty Produced Water Into Fresh Water and Salt To Sell. J Pet Technol 69: 1117-0024.
- Bader JW (2019) A Sequence Stratigraphic Model for the Inyan Kara Formation, North Dakota.
- Langtry TM (1983) Carbonate Bodies within the Basal Swift Formation (Jurassic) of Northwestern North Dakota.
- Murphy EC, Nordeng SH, Juenker BJ (2009) Stratigraphic Column of North Dakota.
- Bader JW (2017) Sequence Stratigraphy of the Inyan Kara Formation, Northwestern North Dakota: Extracting the Maximum from Minimal Core and Outcrop Data.
- Blondes MS, Gans KD, Engle MA, et al. (2019) U.S. Geological Survey National Produced Waters Geochemical Database v2.3. U.S. Geological Survey.
- Busby JF (1995) Geochemistry of Water in Aquifers and Confining Units of the Northern Great Plains in Parts of Montana, North Dakota, South Dakota, and Wyoming.
- Christensen JJ (1967) A Feasibility Study on the Utilization of Waste Brines from Desalination Plants. Part 1. U.S. Department of Interior. 149-178.
- Collins AG (1975) Geochemistry of Oilfield Waters. In Developments in Petroleum Science.
- Rudnick RL, Fountain DM (1995) Nature and Composition of the Continental Crust: A Lower Crustal Perspective. Reviews of Geophysics 33: 267-309.
- Harben PW (1999) The Industrial Minerals Handybook: A Guide to Markets, Specifications and Prices. Industrial Minerals Information. 296.
- Collins AG (1970) Finding Profits in Oil-Well Waste Waters. Chemical Engineering 77: 165-168.
- Garrett DE (2004) Handbook of Lithium and Natural Calcium Chloride. Their Deposits, Processing, Uses and Properties.
- Donald B Cross and Associates (1993) Economic Analyses of Extracting Calcium Chloride and Magnesium Chloride from Alberta Brines (Open File Report 1993-19).
- Kramer D (2006) Magnesium Minerals and Compounds. In: Industrial Minerals & Rocks - Commodities, Markets and Uses. (7 th edn), Society for Mining, Metallurgy, and Exploration Inc., 615-630.
- Erdogan N, Ali Eken H (2017) Precipitated Calcium Carbonate Production, Synthesis and Properties. Physicochemical Problems of Mineral Processing 53: 57-68.
- Teir S, Eloneva S, Zevenhoven R (2005) Production of Precipitated Calcium Carbonate from Calcium Silicates and Carbon Dioxide. Energy Convers Manag. 46: 2954-2979.
- Casey J (1983) Chemistry and Chemical Technology. Pulp and Paper. 4: 2656.
- Simandl GJ, Irvine M, Simandl J, et al. (2007) Primary Magnesium Industry on the Crossroad. Light Metal Age 65: 32-35.
- Simandl GJ, Schultes H, Simandl J (2007) Magnesium - Raw Materials, Metal Extraction and Economics - Global Picture. Proceedings of the 9th Biennial SGA Meeting. Dublin. Irish Association for Economic Geology 827-831.
- Garside M (2023) Primary Magnesium Production Worldwide from 2010 to 2022.
- Alves, Bruna (2023) Annual Volume of Magnesium Recycled from New Scrap in the United States from 2005 to 2020.
- Bray EL (2017) Magnesium Metal. In Mineral Commodity Summaries 2017. U.S. Geological Survey, 102-103.
- Simandl GJ (2002) The chemical characteristics and development potential of magnesite deposits in British Columbia, Canada. In: PW Scott, CMBristow, Industrial Minerals and Extractive Industry Geology. London, UK: The Geological Society, 1690179.
- Li A, Ghilotti D (2017) Chinese Magnesia Market Continues to Surge. Industrial Minerals, 597, 51.
- Gao S, Rudnick RL (2005) Composition of the Continental Crust. Treatise on Geochemistry. 3: 1-64.
- Statista Research Department (2023) Market Volume of Chlorine Worldwide from 2015 to 2021, with a Forecast for 2022 to 2029.
- Bolen WP (2017) Salt. In Mineral Commodity Summaries 2017. U.S. Geological Survey, 140-141.
- Kostick DS (1993) The Material Flow of Salt. U.S. Bureau of Mines Information Circular 9343.
- Horowitz, Arthur J, Lum KR, et al. (1996) The effect of membrane filtration on dissolved trace element concentrations. Water, Air and Soil pollution. 90: 281-294.
- Hall GEM (1998) Cost-effective protocols for the collection, filtration and preservation of surface waters for detection of metals and metalloids at Ppb (Μg l-1) and Ppt (Ng l-1) Levels. (Aquatic Effects Technology Evaluation Program (Task Force on Water Quality Issues), AETE Project 3.1.3). Ottawa, Canada: CANMET, Natural Resources Canada.
- Hall GEM, Bonham-Carter GF, Horowitz AJ, et al. (1996) The effect of using different 0.45 Μm filter membranes on ‘dissolved’ element concentrations in natural waters. Applied Geochemistry 11: 243-249.
Corresponding Author
Md Jakaria, Department of Petroleum Engineering, University of North Dakota, Collaborative Energy Complex Room 113, 2844 Campus Rd Stop 8154, Grand Forks, ND 58202-8153, USA.
Copyright
© 2023 Jakaria M, et al. This is an open-access article distributed under the terms of the Creative Commons Attribution License, which permits unrestricted use, distribution, and reproduction in any medium, provided the original author and source are credited.